All the charts and data we refer to can be found on the Yacht Club page.
Hey everyone,
Data didn't change much; research hasn't dug up anything new. Essentially, we have nothing of value to add. So, with that disclaimer, let's ramble:
- Story vs. Data
- Story
- Data
Story vs. Data
There is a very modern and very cynical view that Data most closely resembles Truth, and that Story is just some more-or-less-necessary perversion of Data—the foggy lens through which Data must be viewed. This cynicism seems mostly reactionary: We've all seen data presented (with a perfect linear regression on a conveniently castrated y-axis) in such a way as to fit a preconcieved narrative—and we imagine that the data could be liberated from the narrative. Then, surely, we'd see the Truth, which was merely concealed by Story.
"Let the data tell the story!"
In reality, Truth is the same, in form, as Story. Truth is a narrative—a series of events tied together by people and things and motivations and irony and folly. Truth will make you laugh and cry and curse the gods. Data won't do that.
So it's maybe not just cynical, but also a bit hubristic, to think that Data—which doesn't even pretend at being more than cold and tabular—is alive in the way that Truth is alive and real. Standard deviations aren't real; stories are real. Indeed, a scatter plot is no more "true" than a grocery cart half-embedded in a snowbank, and yet we all seem to think we can extract Truth from Data.
Now before you object that this is a most preposterous bit of philosophical nonsense (and it is), take stock in your current situation: You are engaged in the truly absurd business of prognosticating the prices of traded securities. Your forebears are the augurs, the oracles, and the soothsayers. Perhaps there are scientific elements to this work, but this is not science.
Ultimately, the best we can do is try to tell good stories. Accurate stories. Stories based on data, surely—but stories nonetheless. We have to be comfortable with this. Why are we thinking about this right now?
Because if ever there was a time to emphasize our reliance on Story in our attempt to suss out Truth, it's now.
So let's unapologetically tell a story.
Story
People haven't been interested in buying puts. For every dollar of put-
buying, there are nearly as many dollars of put-
selling. That's been the big theme ever since
mid-December.
Net put buying is a sign of a healthy bull market; the decay of those puts buoys prices. Net put selling is a sign of a not-healthy bull market; as long as people keep selling, the bullishness is sustained—but eventually, IVs get so low that a lot of people get hurt by even a small amount of adverse volatility.
When there is neither net buying nor selling of put deltas by customers (NPD ~0), that's a strong sign of immediate instability, because it means that the relative impact of customers shifting their option positioning will be larger than when dealers are net long or short—and that there's no perpetual motion machine of bullish flows/hedging to paper over problems.
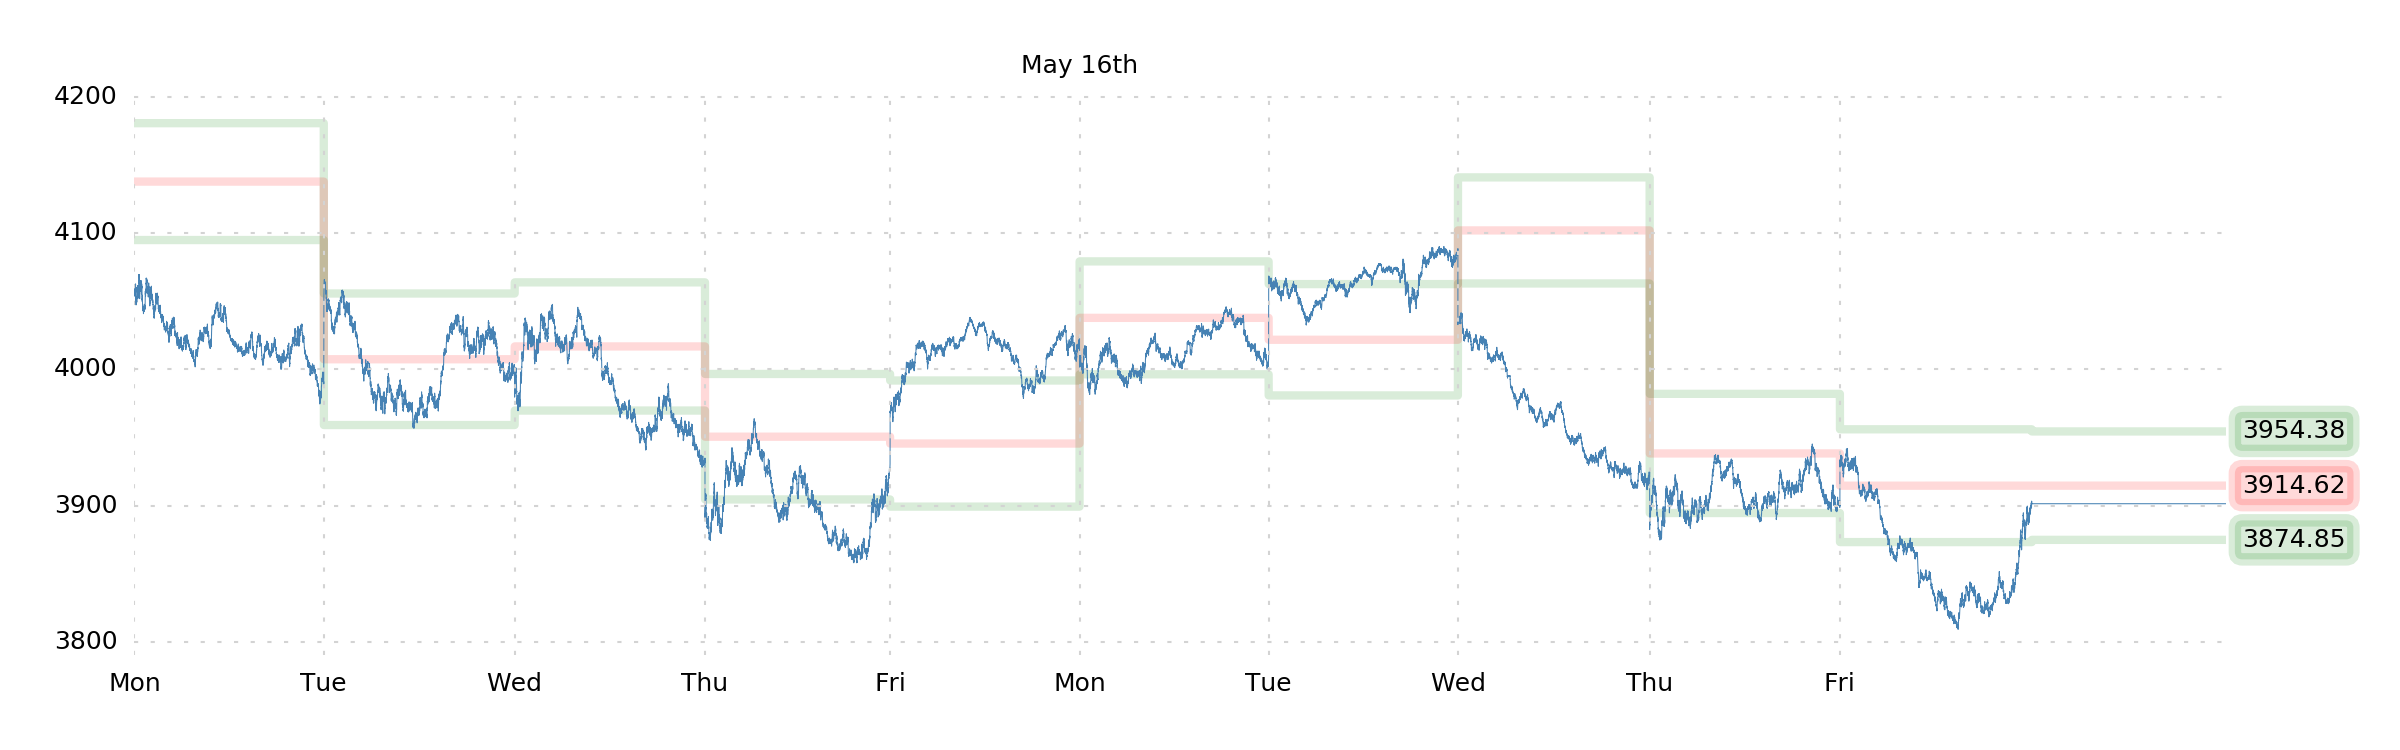
Over the past five months, the fact that there's been little interest in buying puts has kept VIX pretty low, relative to realized volatility, and to the ~20% SPX decline.
This feedback from the market (spot down, vol flat) has given rise to a very common theory—which we once espoused—that we're in for an interminable grind downward in SPX. A boring bear market. This theory has further discouraged investors from buying hedges—and has in turn encouraged more aggressive participants to sell near-term SPX volatility against short SPX delta: A bet on the continuation of the trend, but on the impossibility of a crash.
There's no possibility of a cascading vanna-induced selloff—which means there's no crash in the cards. And that probably obviates concerns about the most violent left-tail events that Jim sees. This is important.
And so, while we were unwilling to be long SPX, or short SPX volatility; we believed very firmly that the left tail wasn't really in play. And over the coming months, what we saw in the data was bear market proclivities. Buy the dip, sell the rip, etc.
It took until
May for that to change.
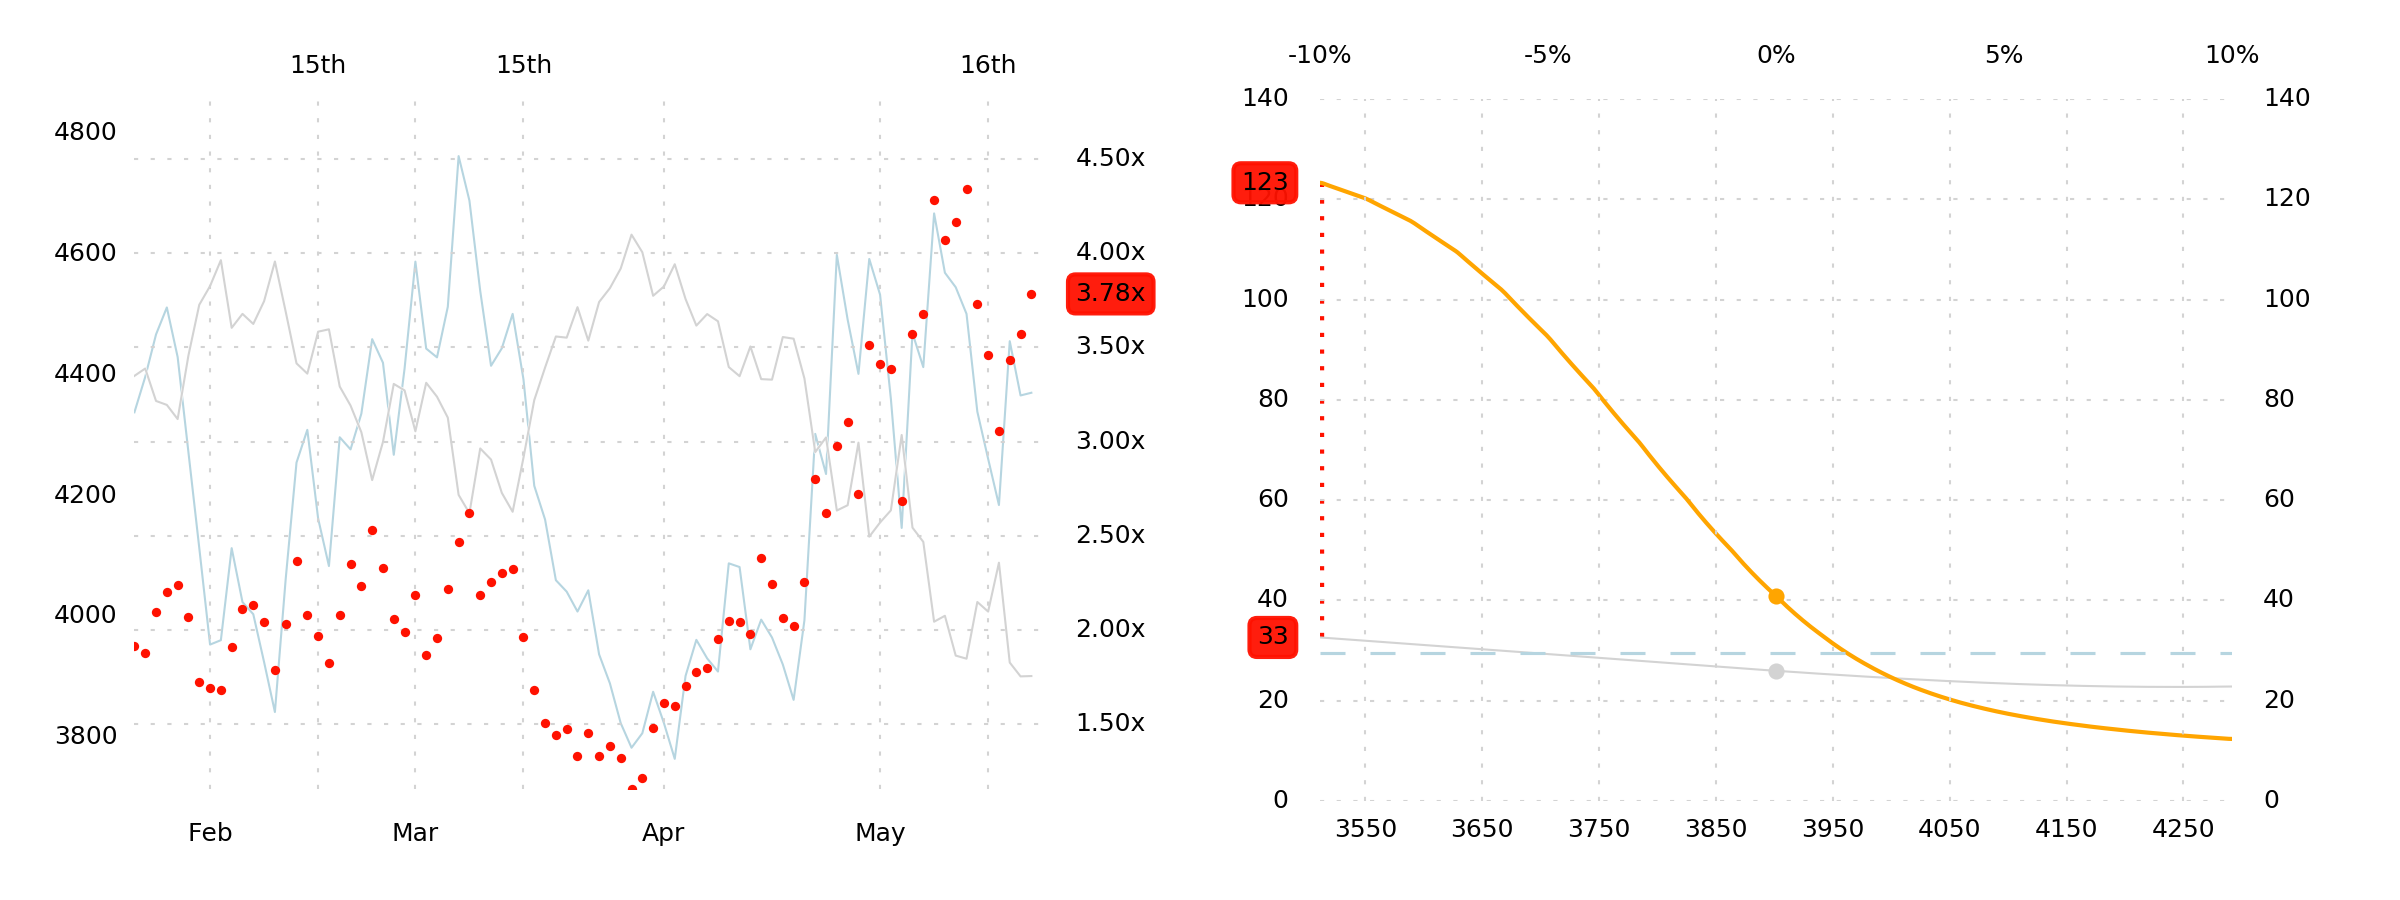
A -10% move in SPX would cause realized volatility to rise to 126 (over 6.00% average daily moves). That's circuit-breaker stuff. The one-month -10% OTM SPX volatility is 36. This is too low to account for this possibility.
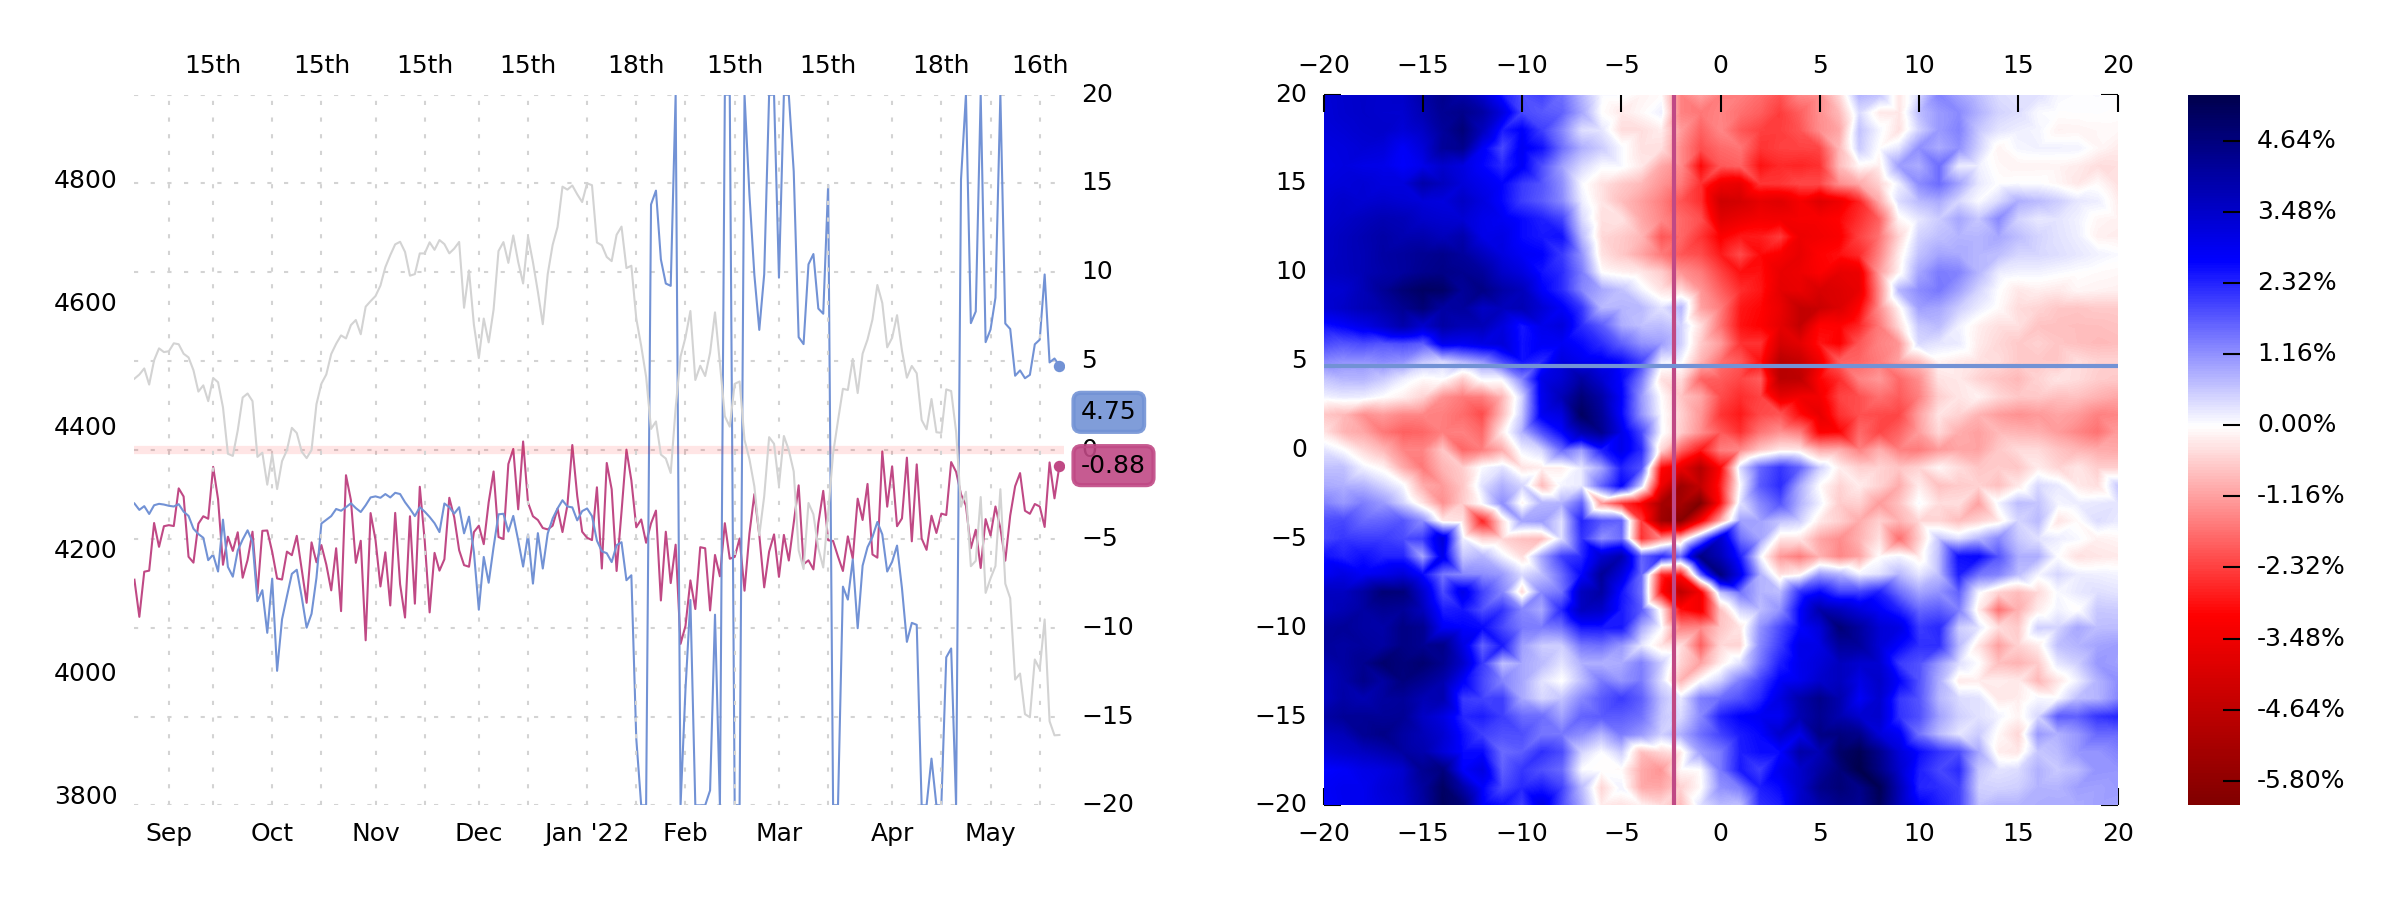
When the conditional -10% GIV is 3.00x higher than the market-implied one-month volatility at the same strike, that's when we start getting worried. As you can see above, it's now 3.51x.
And so while we'd have been willing to be long an SPX put spread (as we were a number of times in February) in January through April, and we'd have approved of any strategy that was long ATM vol and short skew—positioning data is different now.
The Risk, however small, of a true left tail event is now present. Why? According to Data, it's because there are a substantial number of SPX option dealer hedging obligations below spot which, historically, have led to crashes. According to Story, it's because between January and May, a lot of market participants though it prudent to make the bet that the left tail was not in play. (Thereby creating said [vanna]-hedging obligations.)
And now, more than ever, the opinion that a crash is impossible—and that the short SPX, short SPX vol trade makes sense—has taken center stage. Why? Because the trade has been working really well so far this year, that's why. "This is a bear market, not a crash scenario!" The seemingly "smart" thing to do is to bet that SPX keeps going lower, but slowly. What an easy, sensible trade to make! Win both ways!
Now, the Data won't tell you this, but as a general rule, the market eats hubris and excretes irony.
The hubris is that short volatility is an easy trade here (hah!), and that short S&P 500 is "working." There are two possible ironic outcomes: One is that a crash occurs in earnest. The other, perhaps more ironic, is that SPX rapidly ascends to 4200+ and VIX doesn't budge—stays at 30. In both cases, the short SPX, short VIX tourist is punished for his sins.
This is a Story. But it's a story told from the perspective of Data. Are we taking some dramatic license here? Sure. But for all of the insufferable "market psychology" stuff you might run across, it's undeniable that market data is, at best, a view into incentives and human psychology. And this is what we see going on in our data right now.
Data
Our only position over the past week was a long OTM SPX put position, spread across a whole bunch of strikes down to 3000, which we intend to keep rolling. It wasn't a bad week for this position, because SPX went down 100 points. It's meant to capitalize on the 1-month+ crash potential.
But the position is sized to minimize regret in the event of a crash—not to retire on a Mediterranean estate. Indeed, we've been taking [mostly-failed] potshots at long volatility for a while now, so sizing has stayed small.
This coming week deserves a bit more risk, we think, and we'll accomplish that by simply tacking on a 1-week strangle. Something that would benefit bigly from, e.g., a 250-point move.
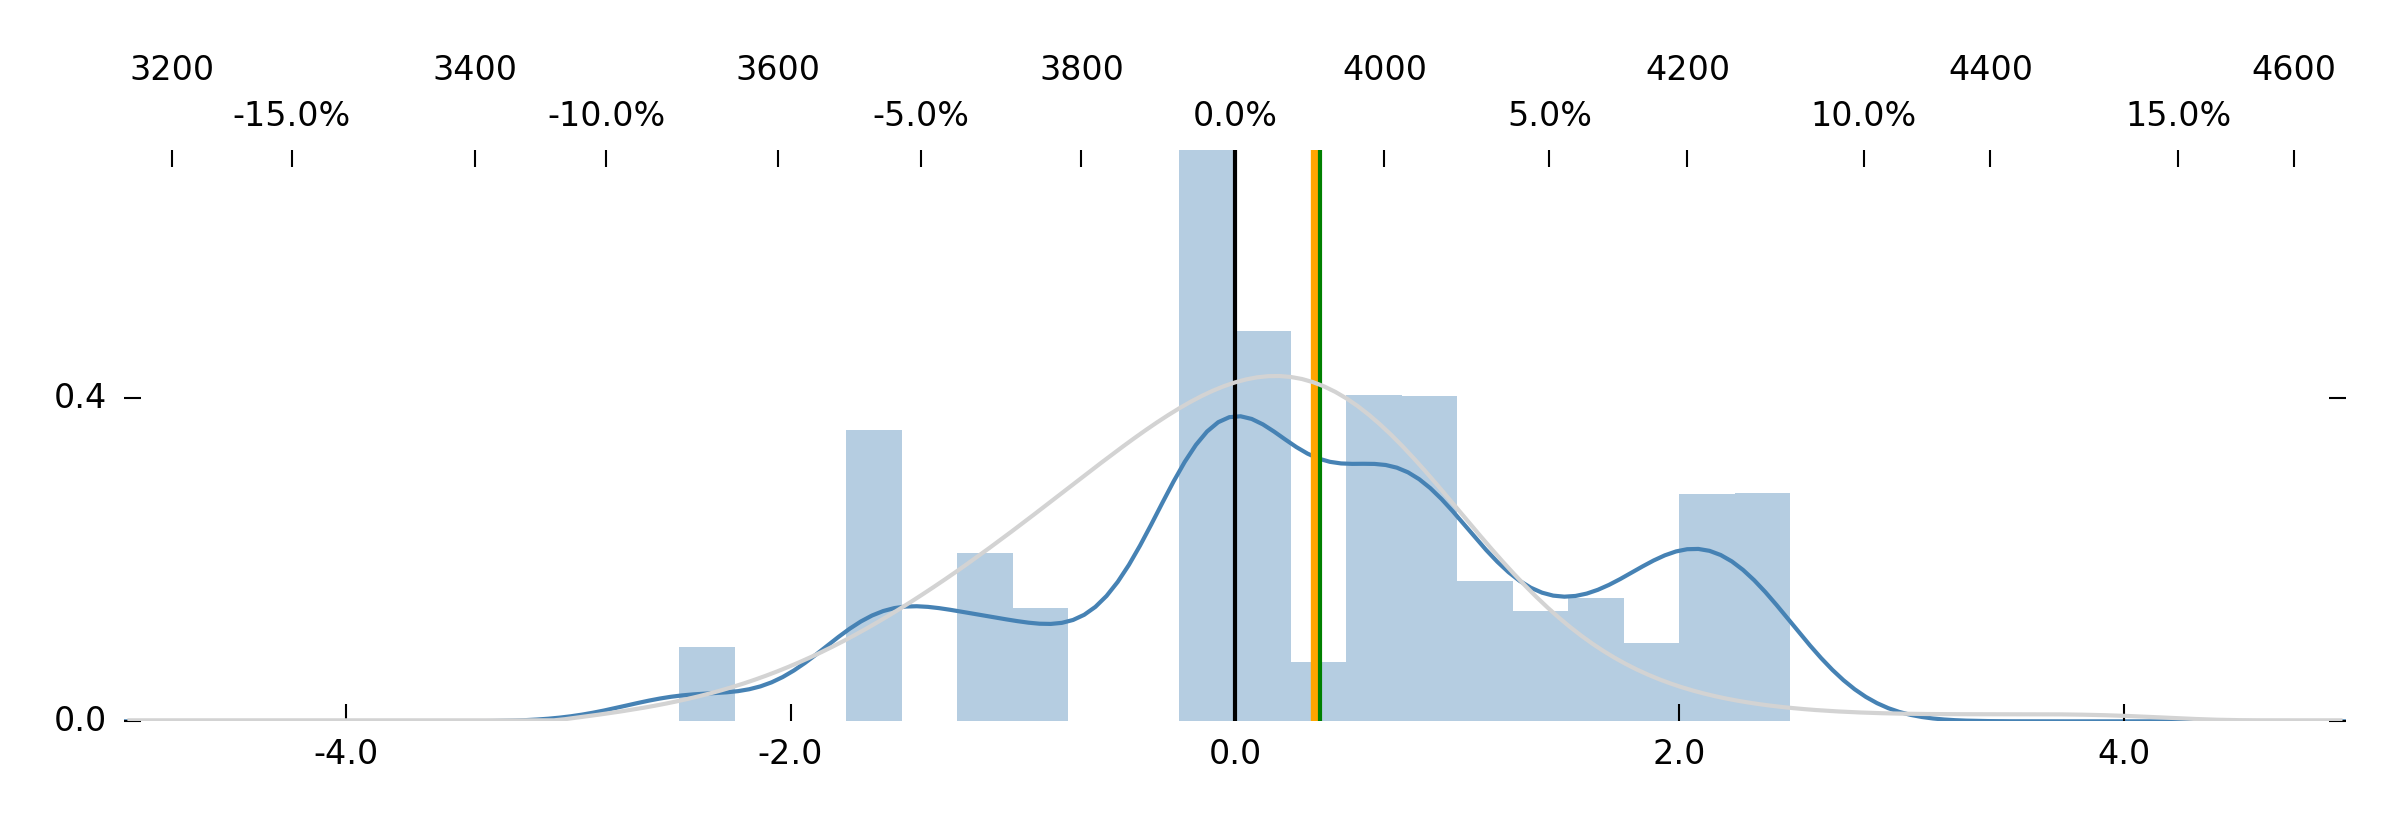
From the perspective of the JimBot, the 300-point upside (lump at SPX 4200) is underpriced, and without reference to Crash Risk, the equivalent downside (SPX 3600) is fairly priced (blue line overlaps gray line)
And we know from
last week's analysis (
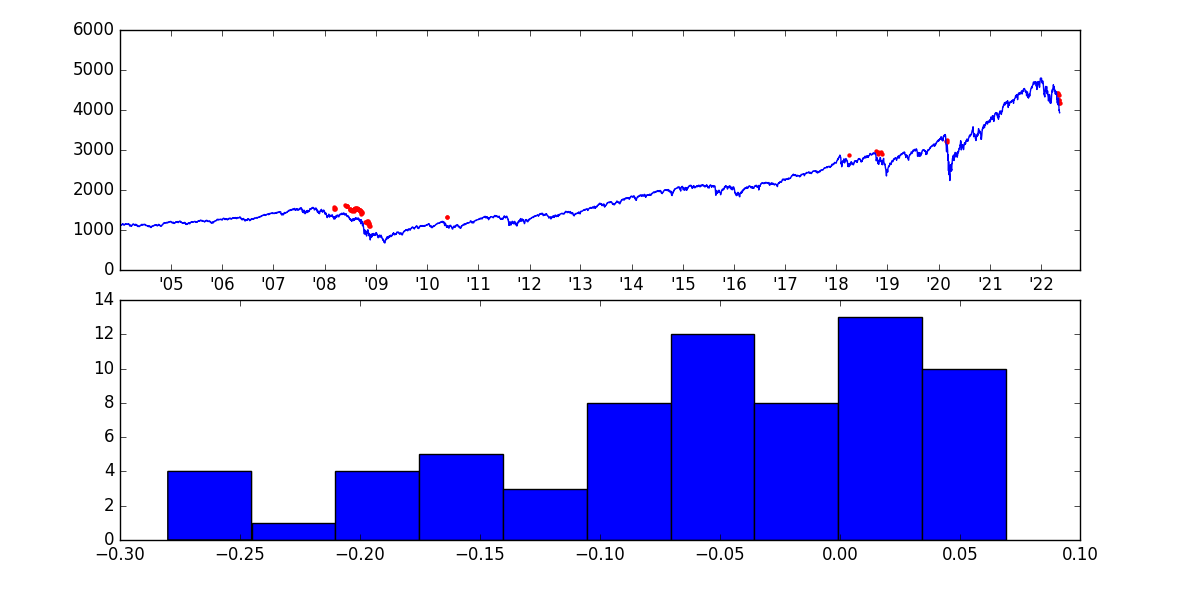
here's a version of the Python script with VGR added, and with dates on the x-axis) Crash Risk does add quite a bit of color, even though the sample sizes are, by nature, low.
So, taken together—by golly we want to be long a strangle. The Data says it's a good bet, and the Story makes sense to us. It's a hard trade to make, but it's the right trade.
Notes:
NPD has been extremely near to zero in the last few days. This intensifies vol and vol-of-vol impulses.
Crash Risk is still above 3.00x, and gamma-implied vol (GIV) is around 40, which predicts 2.00% daily moves, on average.
Hold on tight.
The SqueezeMetrics Team