All the charts and data we refer to can be found on the Yacht Club page.
Hey everyone,
We've been talking about Crash Risk for a couple weeks now. We don't talk about Crash Risk very often. And we're going to keep talking about Crash Risk, because it's important. But let's try to keep it brief this week.
- The meanest reversion
- Through gritted teeth
- Some assembly required
The meanest reversion
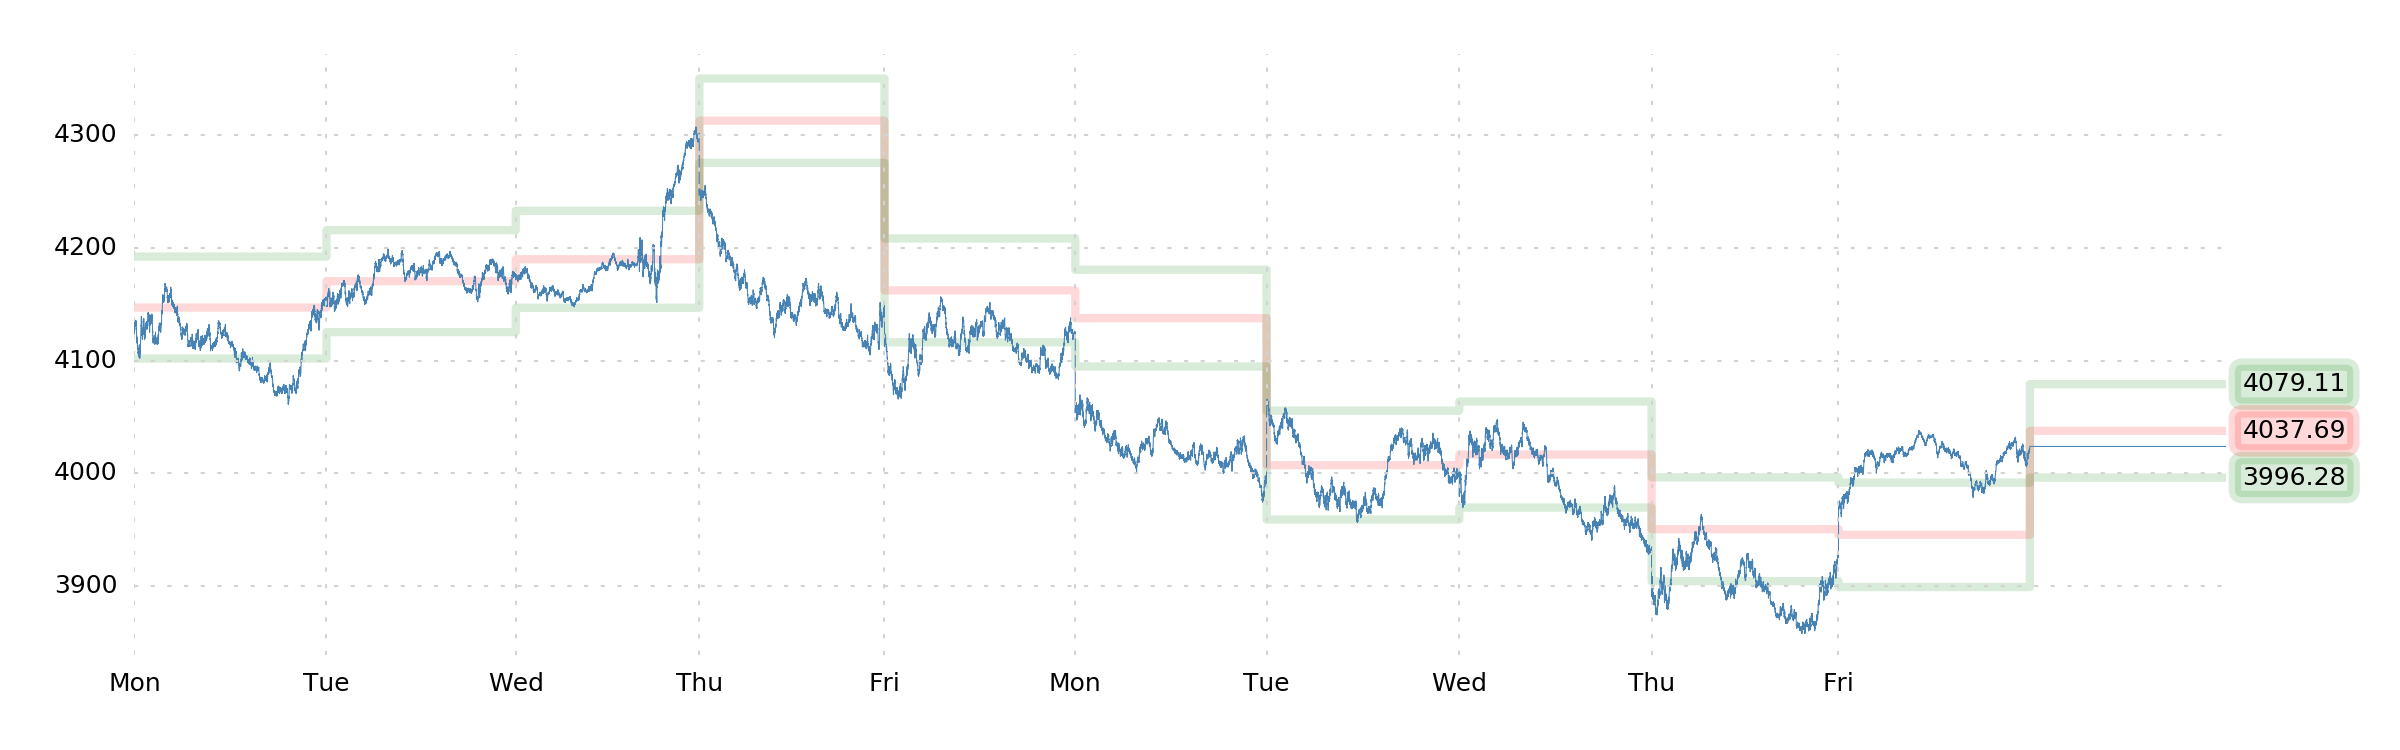
Our money was on a big weekly gain or a big weekly loss, because that's where the edge was. Unfortunately, this is a low-probability bet by design, and our gently bleeding PnL continues to demonstrate the fatigue of this strategy.
While Thursday's >6.00% intraday weekly loss would have done us good, Friday brought the weekly return back to –2.41%.
Which didn't do us any good.
Our calls expired worthless on Friday, and we added to our OTM put position at EOD Friday, which is now spread out across several tenors and strikes.
Through gritted teeth
We aren't big on buying puts. It's not our "thing." It's usually not a good trade: It's always low probability—even when it has positive expected value—and it's frustrating.
But right now, we have no doubt that it has positive expected value, and it's not as if there are any good high-probability trades out there. This is not an environment for short vol (or even long index). So here we are, buying more puts.
A few thoughts:
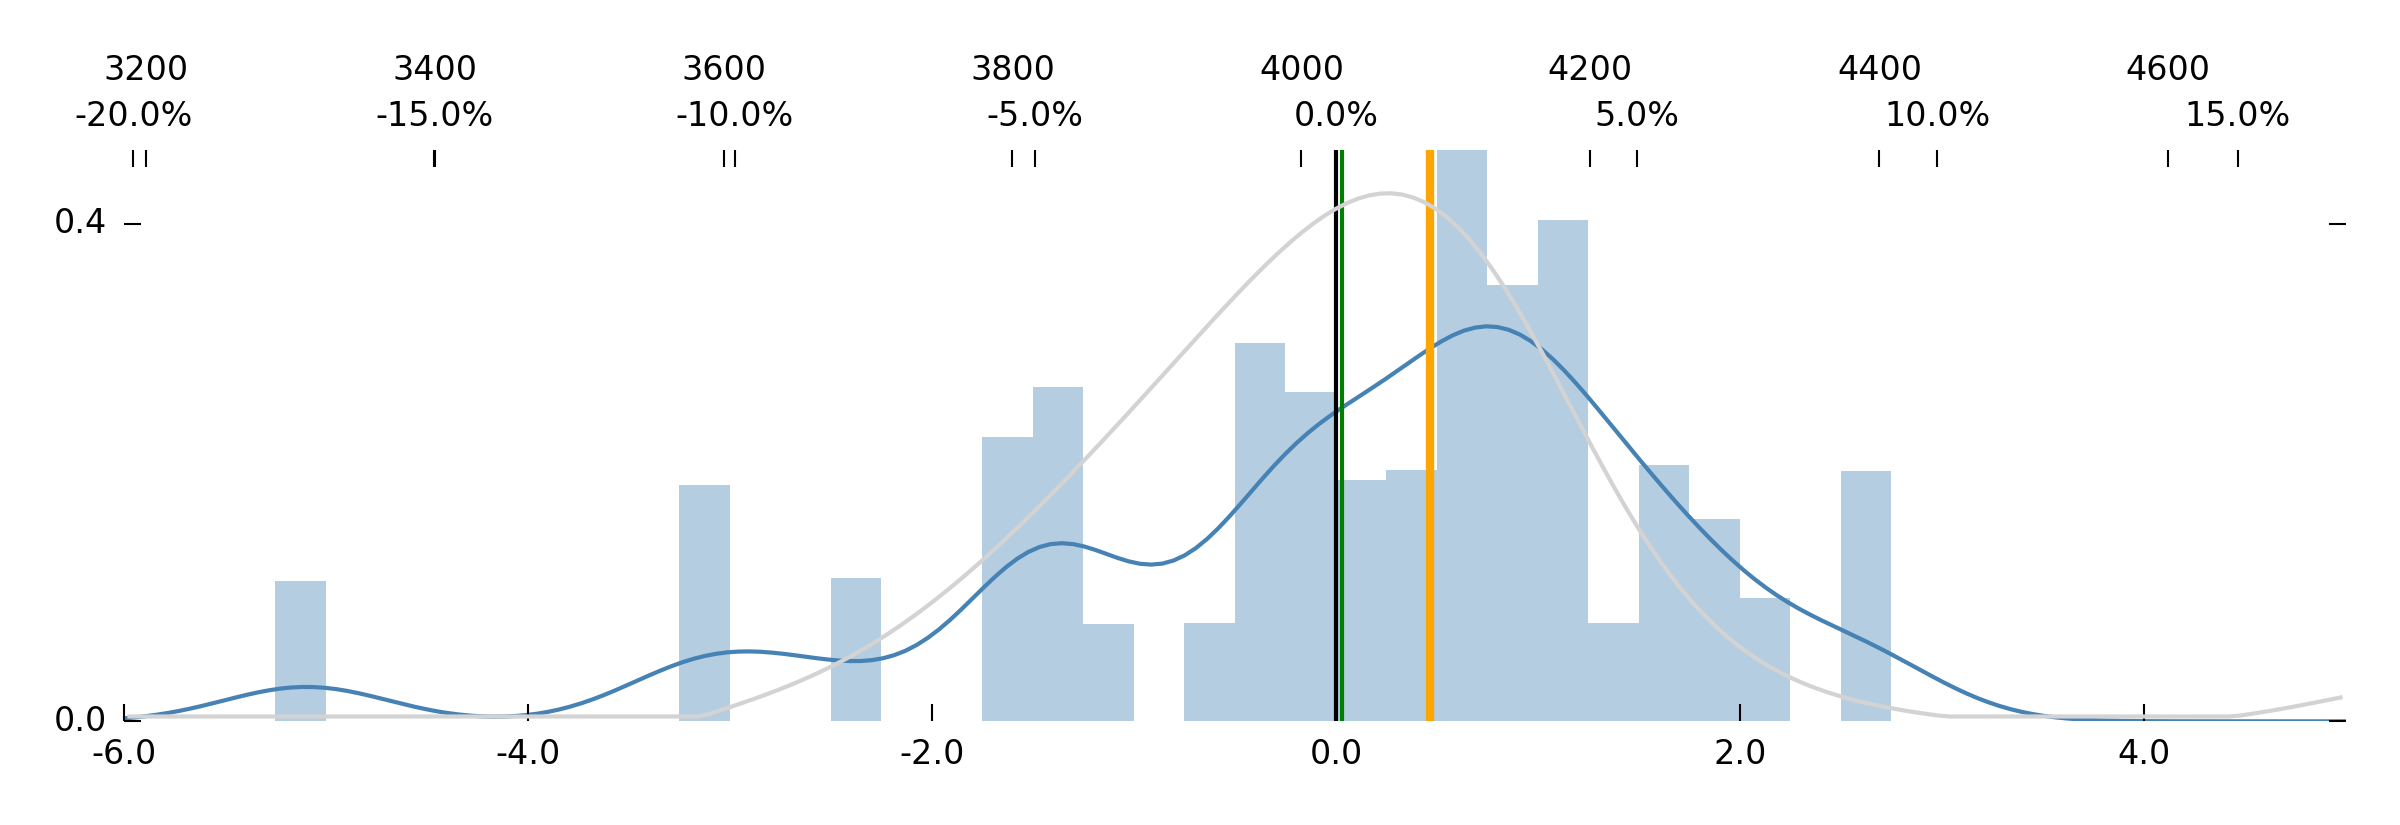
Our friend Jim has a very long left tail and a mean return (green line) around 0.0%.
This means it is not rational to be long SPX or short VIX (or short straddles, for that matter). Rather, edge [still] lies in being long the tails. Note that the blue line is most notably above the gray line around +10% and –10% weekly returns (or thereabouts).
We have never witnessed Robot Jim quite this heavy in the tails relative to the market. Nor is this because of peakiness/kurtosis (e.g., from a very high GEX situation). It's just a very broad distribution of returns—very high volatility. Now, bear in mind that our dear Jim does not consume Crash Risk, or GIV skew, as an input. So this distribution is derived absent that consideration!
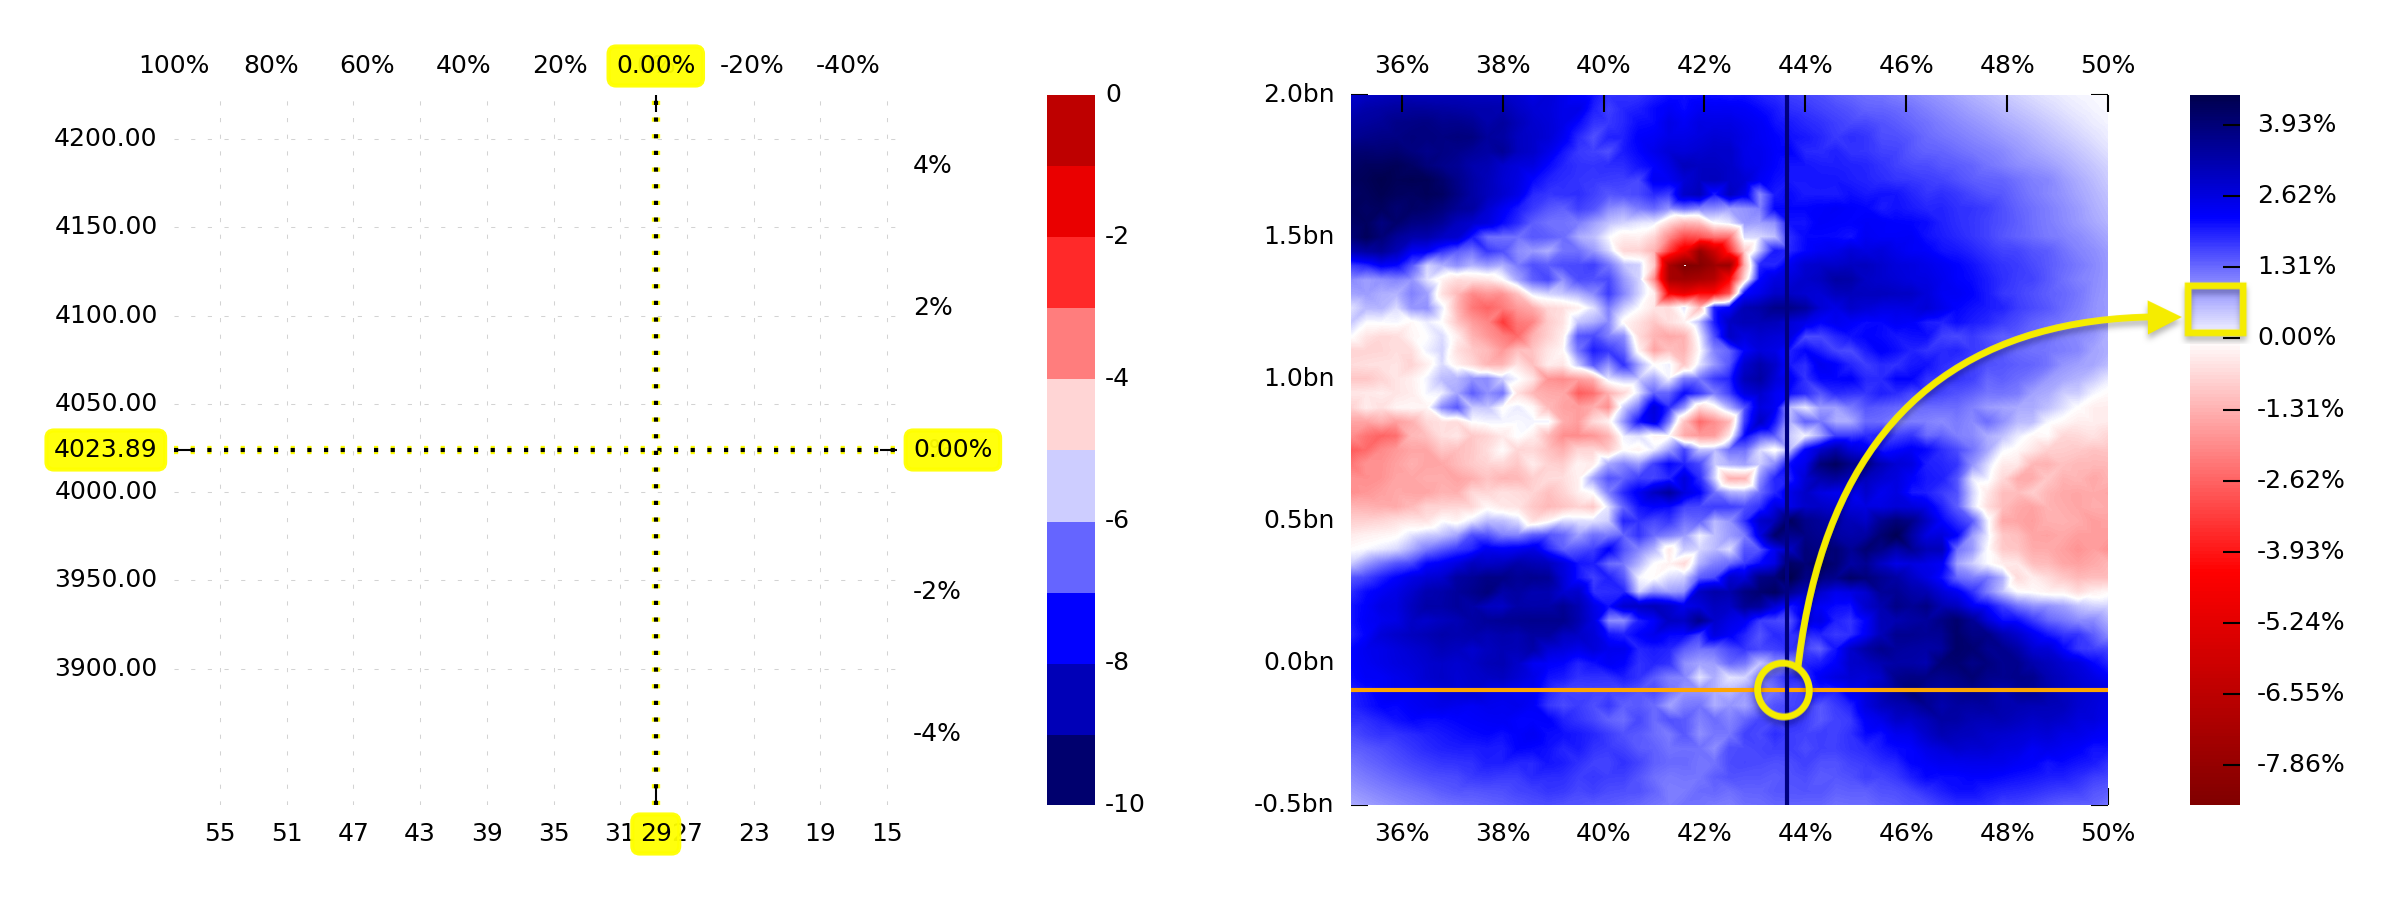
DIX has been weakening over the past month. The 5-day mean DIX is under 45%, and the DIX/GEX heatmap places us back in a neutral area for 1-month returns.
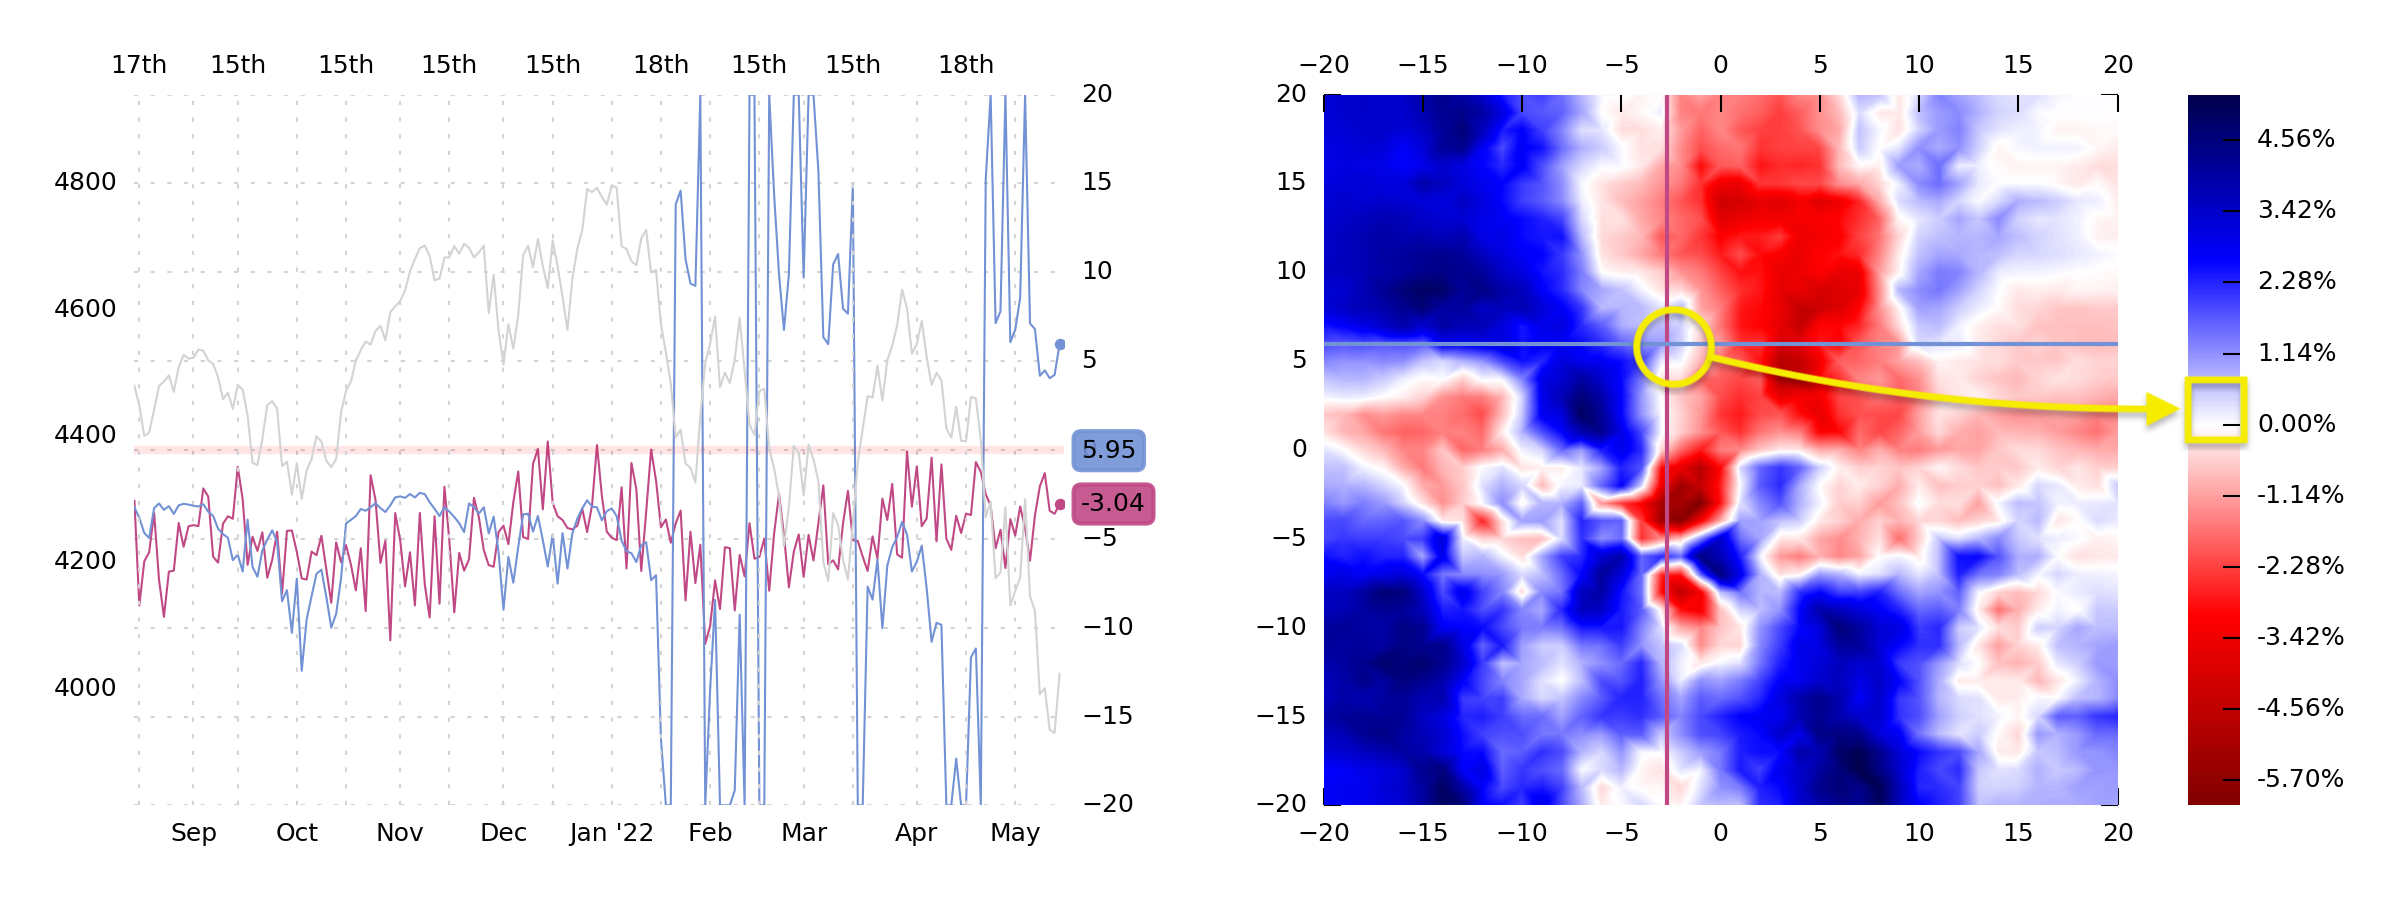
NPD has been consistently dangerous, with a persistent dearth of put-buyers. It winds up in a similarly iffy situation, like DIX.
And if you envision VGR rising from here (i.e., if SPX rises), the crosshairs just move up into a redder area. So, that's not bullish.
But to actually want to buy puts, we need something more than all of the above. We also need this:
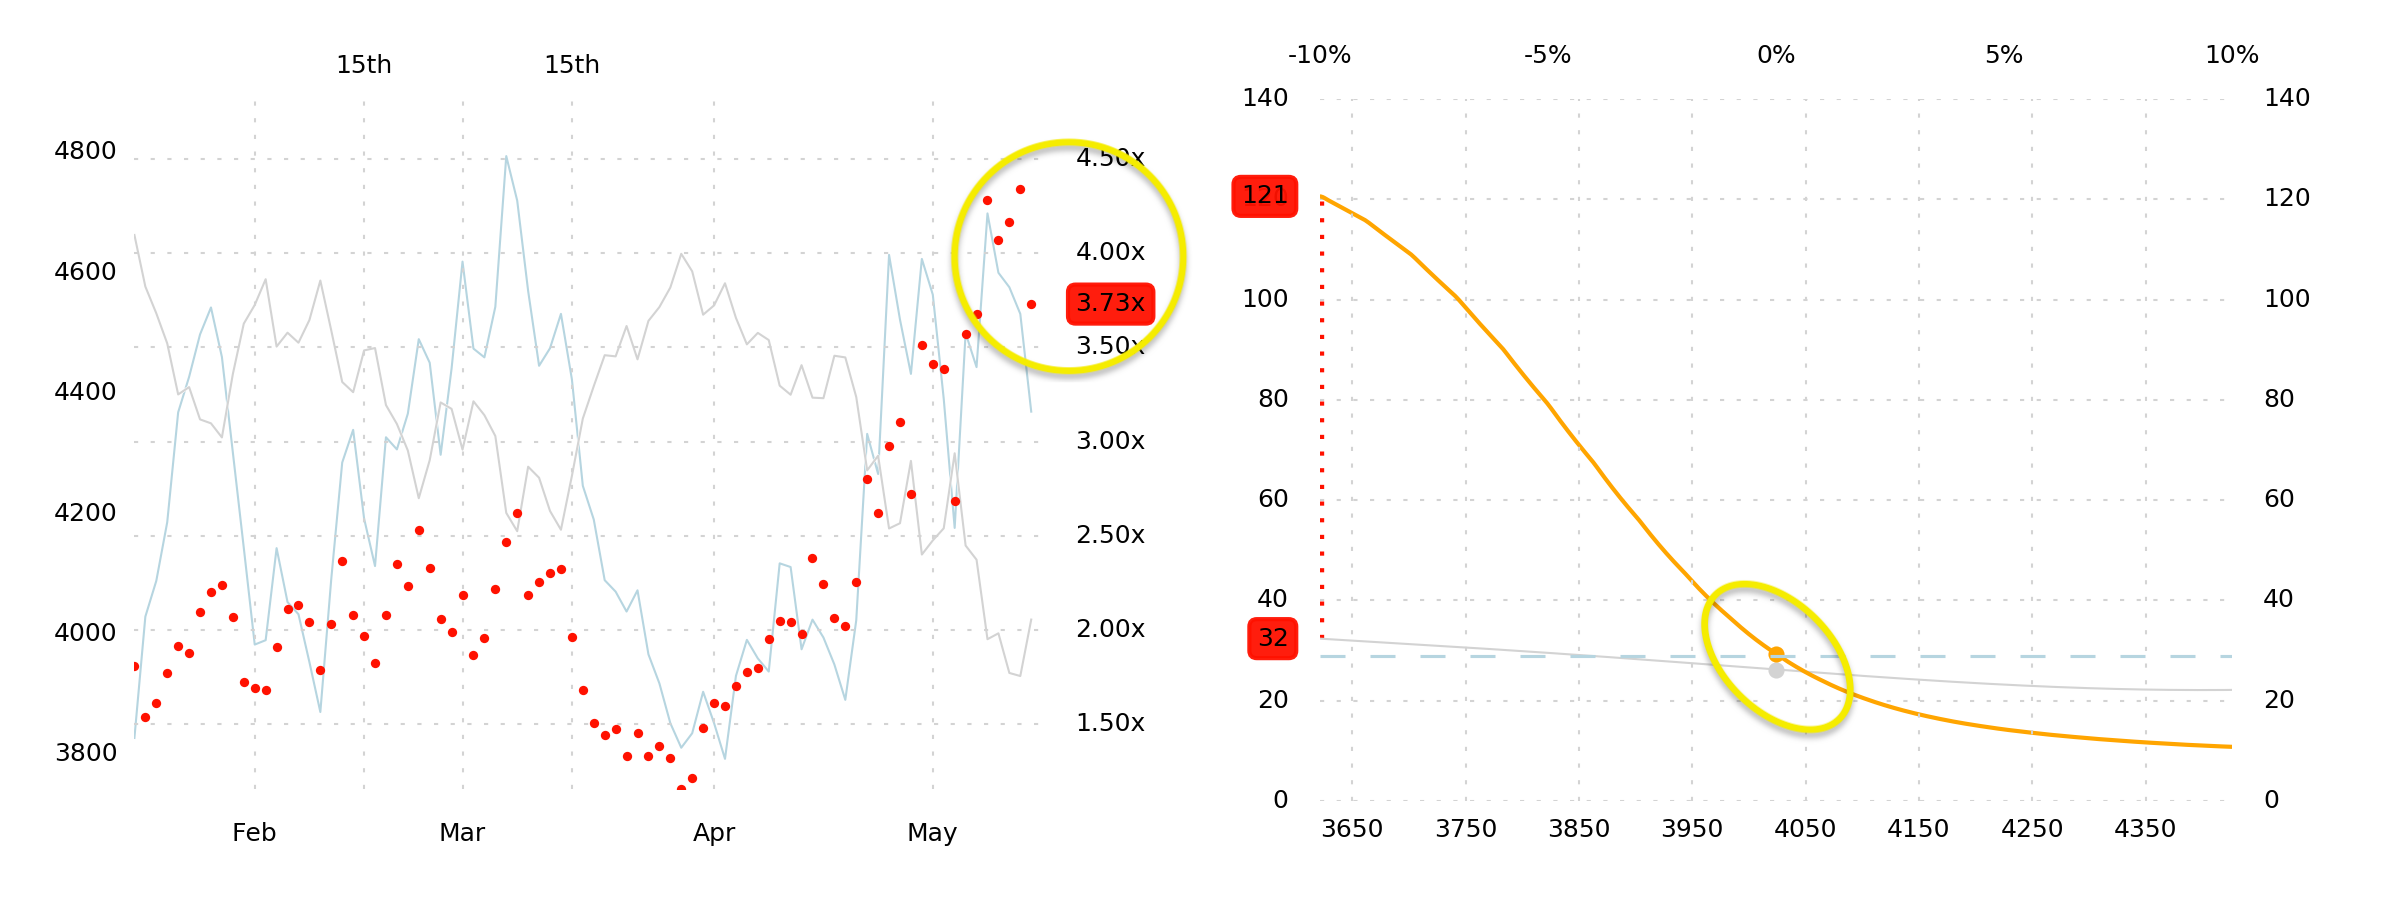
A substantially elevated Crash Risk, and a GIV above the 1-month ATM IV.
These factors can take a situation with high volatility at spot and turn it into a situation also with high volatility below spot. This is the stuff that causes black holes of liquidity.
But remember, Robot Jim isn't actually looking at Crash Risk. We've kept him blind to this (mainly because the sample sizes for high rash risk are necessarily small and clustered in time). So while Jim sees the fragile NPD (and gets a lot of his left tail from that), only we see the scary GIV skew and its implied crash risk.
After all, the human-machine interface requires some input from the human sometimes.
So let's do a bit of thinking.
Some assembly required
"How can you not own puts?"
Uttered for the first time (ever?) on Wednesday morning, we felt that left tail risk was dramatically unappreciated, and that it was worth betting on it. And we're still betting on it.
But to really get a sense for why we feel this way about the combination of (1) Crash Risk over 3.00x and (2) NPD in the vol-of-vol "danger zone" between -5 and +5, we ought to exhume some historical data.
We encourage you to follow along, and to extend our investigation in whatever ways you see fit. So here's a 3-step guide to doing just that:
- Download the "GEX+ Spreadsheet" CSV from the Yacht Club page.
- Download, or copy-paste, this Python3 script into the same directory as the data.
- Run the script on the command line ("python3 crashy.py").
The only dependencies are the csv module and matplotlib. With the existing operators (>3 crash risk and -5 to 5 NPD), the terminal output should look like this:
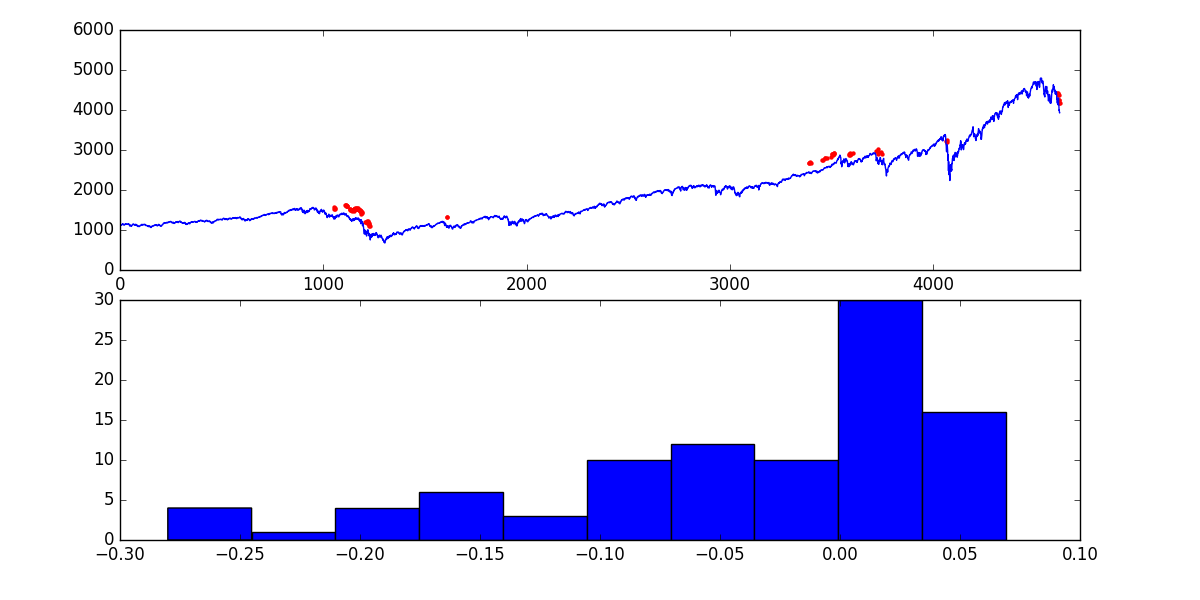
EVENTS: 96
MEAN 21-day return: –0.0373...
That means that there were 96 days in history, back to 2004, that had high crash risk and near-zero NPD, and the subsequent mean 1-month return was –3.7%.
Then, this plot should appear:
Red dots show up on the SPX time-series when the conditions were met, historically; and the histogram shows us a crude distribution of returns. There are clear analogs to the current situation in 2008, 2011, 2017, 2018, and 2020.
And the distribution of returns is astonishingly skewed, with a strong mode at >0.00% 1-month returns, but the longest, fattest tail you've ever beheld (all the way down to -25% monthly returns). Yes, some of the data is overlapping, but perhaps not as much as you might assume.
Now, at this point, it's worth really emphasizing that Crash Risk (CR(x)) is nothing more than the –10% GIV compared to the 1-month –10% market implied volatility. So when it's "3.00x," that just means that the GIV at –10% is three times higher than the market IV.
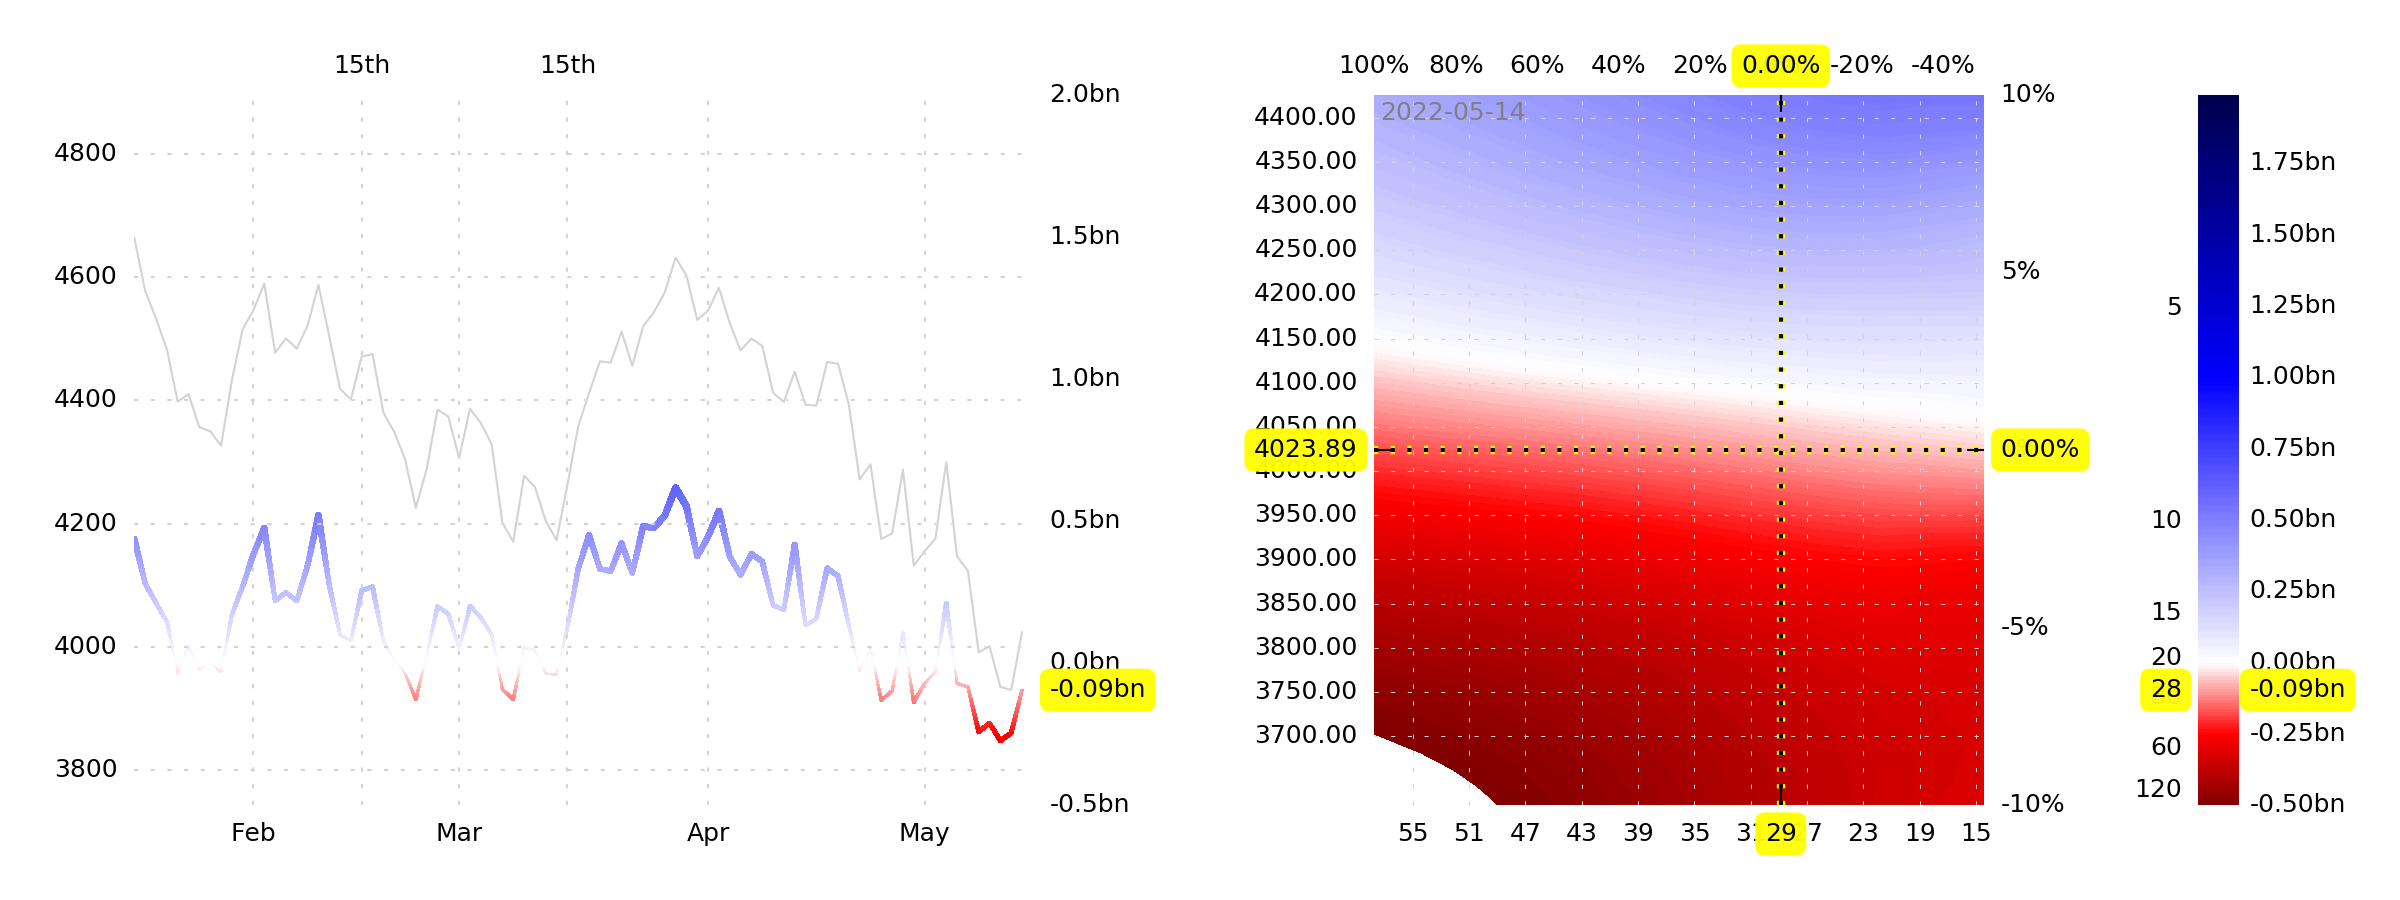
Basically, all this is saying is that GEX+ becomes really really negative at –10%. Nothing about this number is being trained / goal-seeked. Indeed, all that Crash Risk is telling us here is what the GEX+ heatmap is telling us already—that in the bottom-left corner of the map (below), GEX+ is more negative than it's ever been in history. (The map ends!)
So please feel free to open up the script and play around with it. Add or remove parameters. Change their conditions. The script is left as simple as possible, so as to be extended. And if you only have Python 2.x, it will run on that as well.
There is a great deal of Risk present over the next month. Historically significant Risk. Underappreciated Risk. We will gladly buy and roll the puts, even if that means bleeding PnL for the next month.
Only current position is long OTM puts.
Good weather for long walks.
The SqueezeMetrics Team