All the charts and data we refer to can be found on the Yacht Club page.
Hey everyone,
This seems like an important juncture in the market, so instead of doing a few disjointed sprints like we usually do, let's take a liesurely stroll...
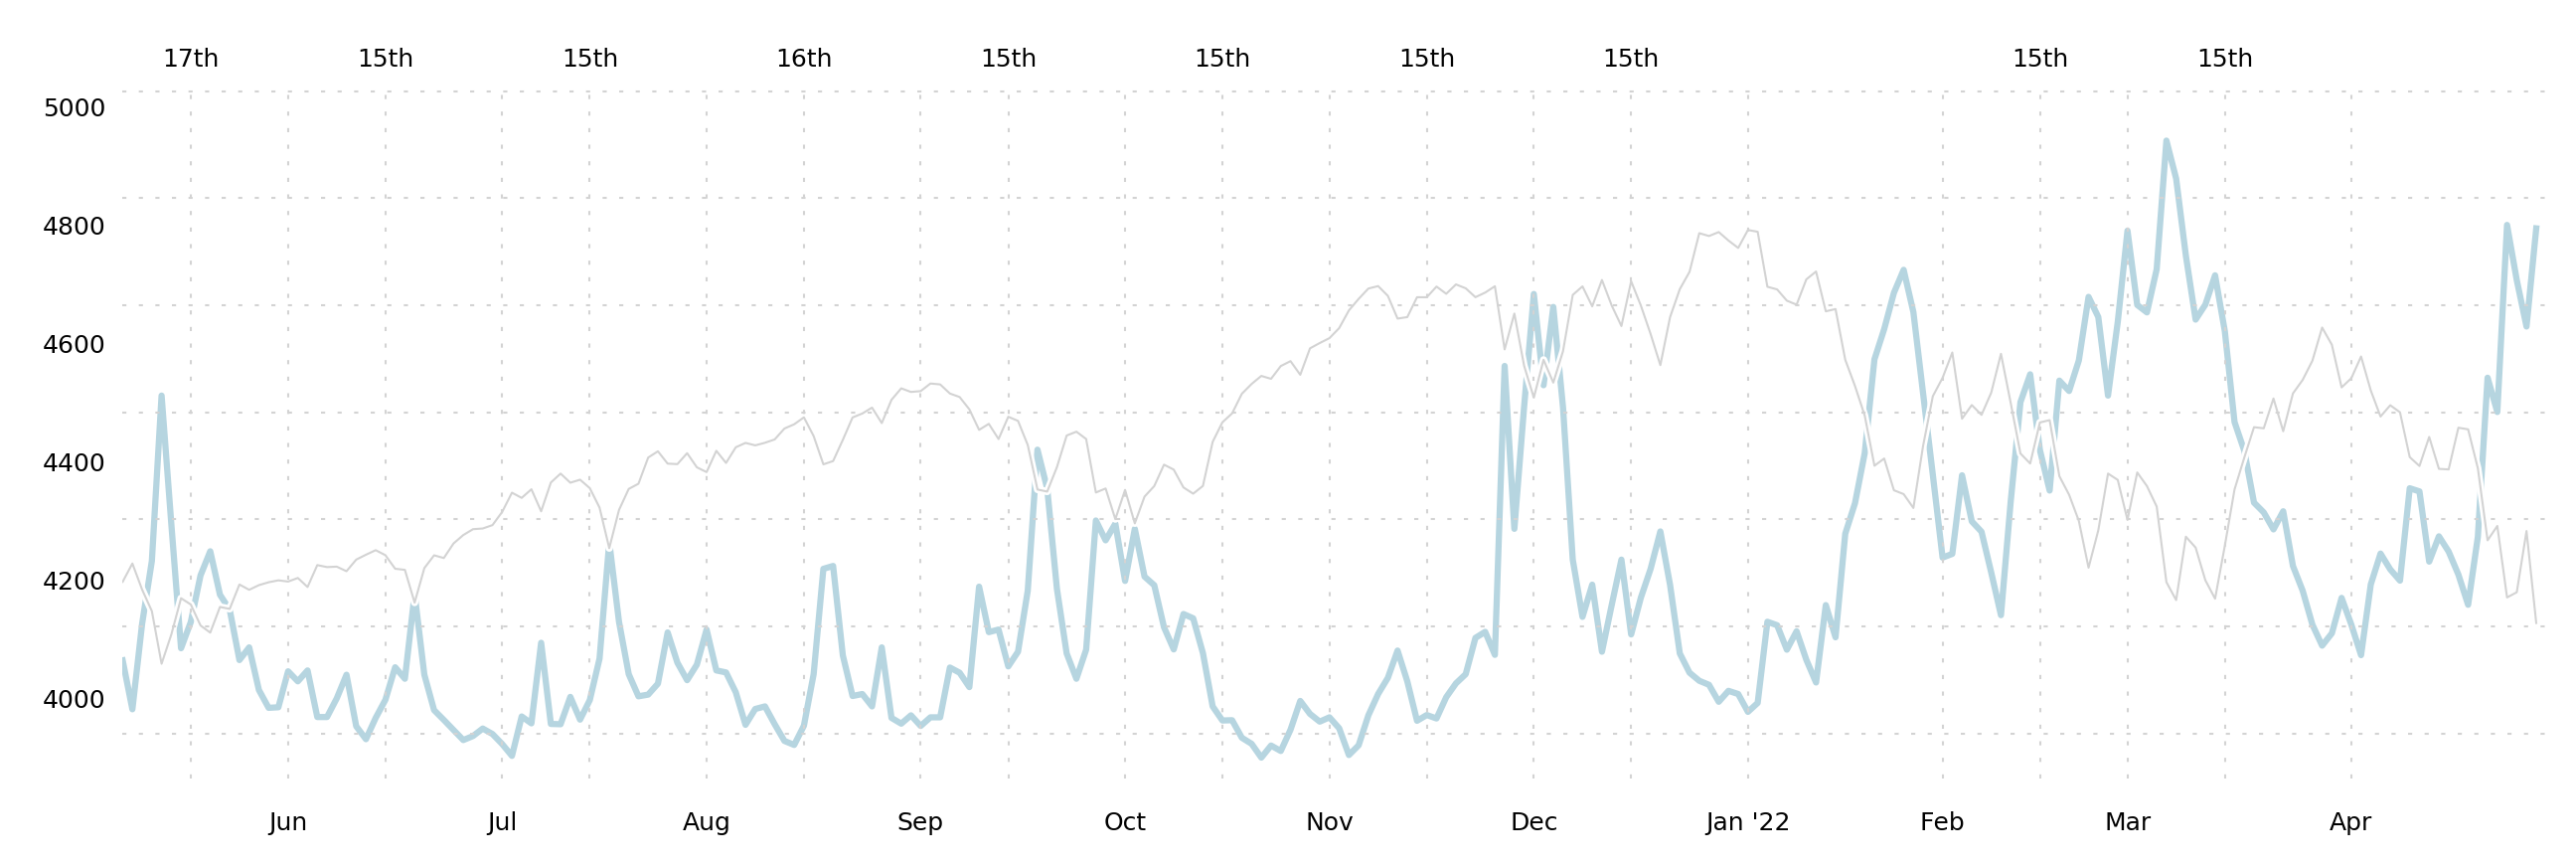
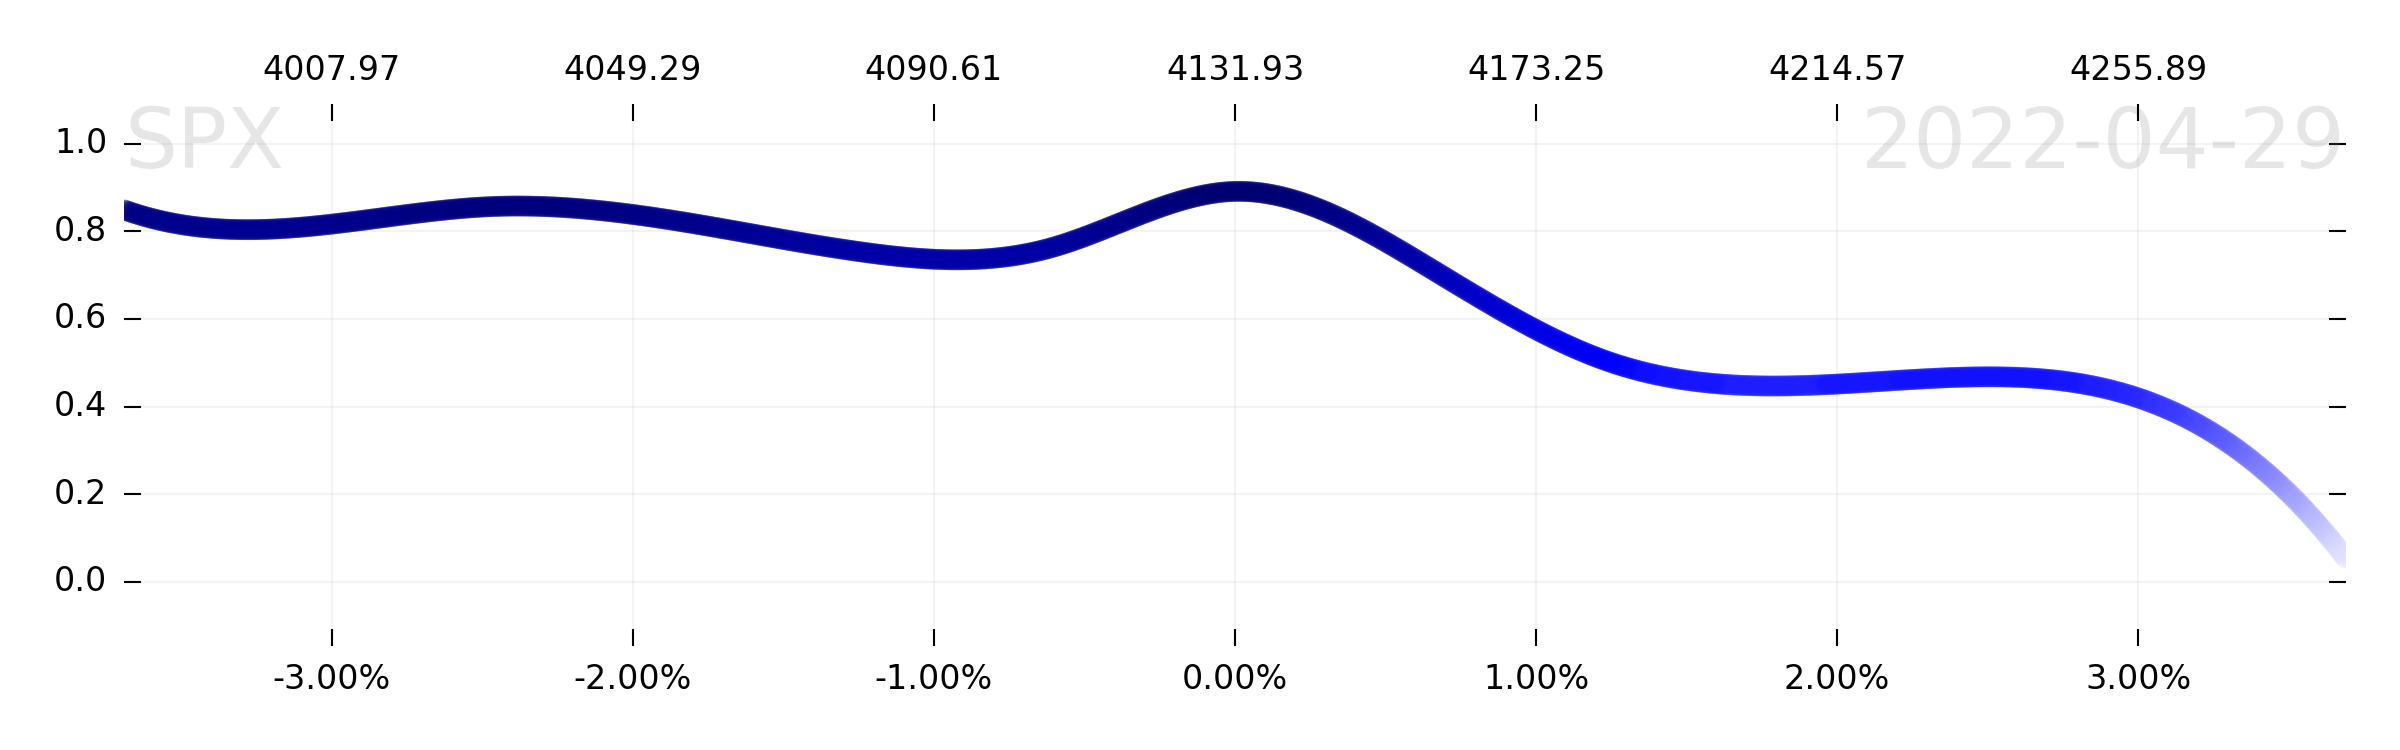
If you asked us to look at just the charts of SPX and VIX, with no other context, we would probably say that this is a decent time to sell volatility and/or buy the S&P 500. There's nothing sophisticated about this—we know that the market embeds a large risk premium when things get pear-shaped, and more often than not, we want to accept the risk that, really, it's not going to be all that bad after all.
And if you told us that next week is an FOMC meeting, and people are really concerned about the prospect of panicked rate hikes—we'd be even more sure that short vol was the way to go. Tactically, event risk premia are extra juicy, and even when "the bad thing" happens, the loss from selling the volatility usually isn't enough to make it a bad bet.
Usually.
But the essence of making money, long-term, in S&P 500 volatility is a keen understanding of this word: "Usually."
Nor is this unique to trading specifically in options, or VIX. The S&P 500 itself crashes when risk is mispriced, and the mispricing of risk is an artifact of left tail pricing in options (and other convex instruments). The simplest example is that, before Black Monday ('87), option prices (incl. "portfolio insurance" products) didn't have skew. Unfortunately, the true distribution of returns had plenty of skewness. This mispricing caused a crash—and you didn't have to be selling puts or portfolio insurance to get hurt.
This is why we've spent most of our time and resources trying to figure out whether "capital-R Risk" is present or not. Those events matter disproportionally to anyone's long-term PnL, or—given leverage—long-term survival.
We haven't talked much about Risk recently, because there wasn't anything to talk about. You have to look back
two years to hear the last word on the subject.
[...] it's when options are too cheap relative to real volatility potential when true risk arises. "Risk" is the underpricing of volatility, not volatility itself
There are endless reasons that volatility could be "underpriced." Most of them are "external" reasons, like "valuations," or "sentiment," or "geopolitics." There is talent in assessing these things, but we do not presume to have that talent.
Rather, we want to look for an "internal" reason: That the number of options bought and/or sold at strikes below spot intrinsically demand a certain degree of delta-hedging that would necessarily take enough liquidity to overwhelm any natural bid.
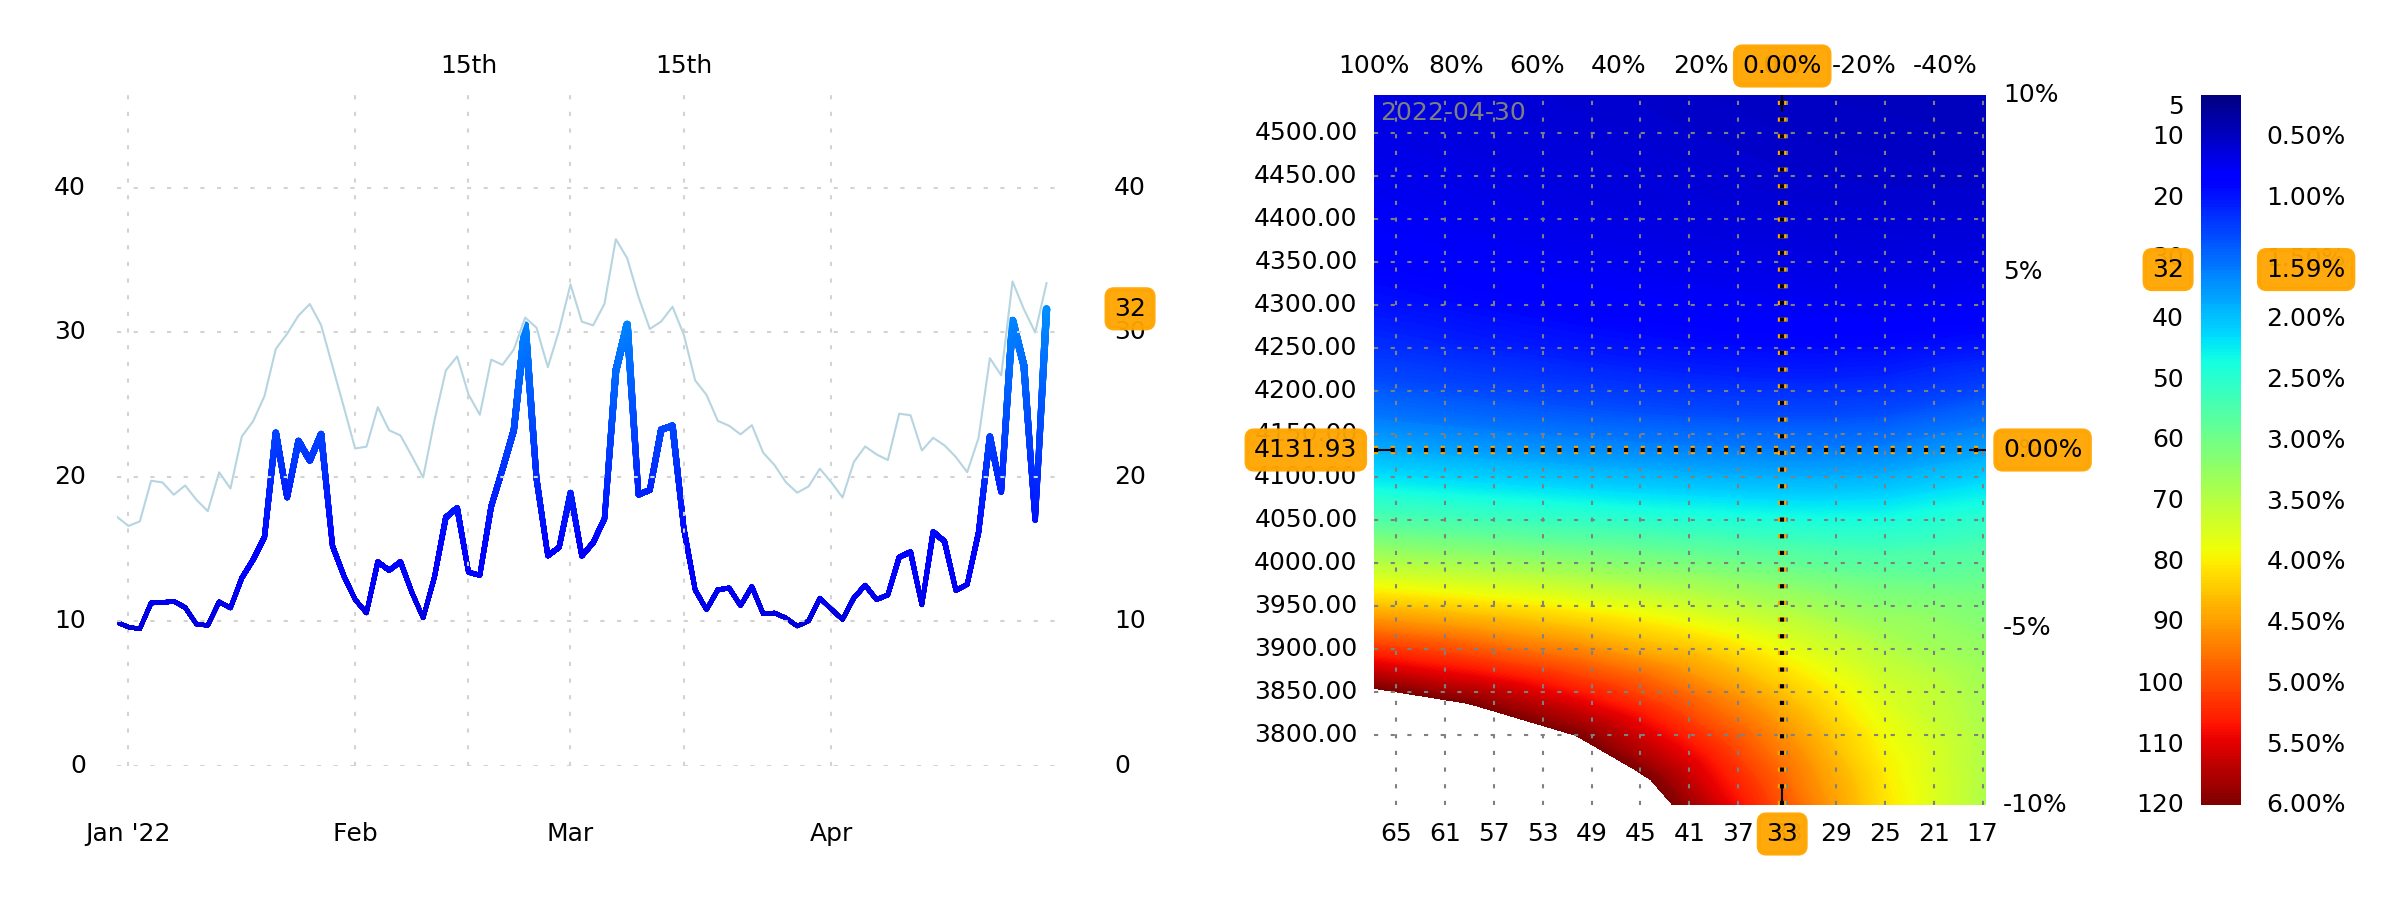
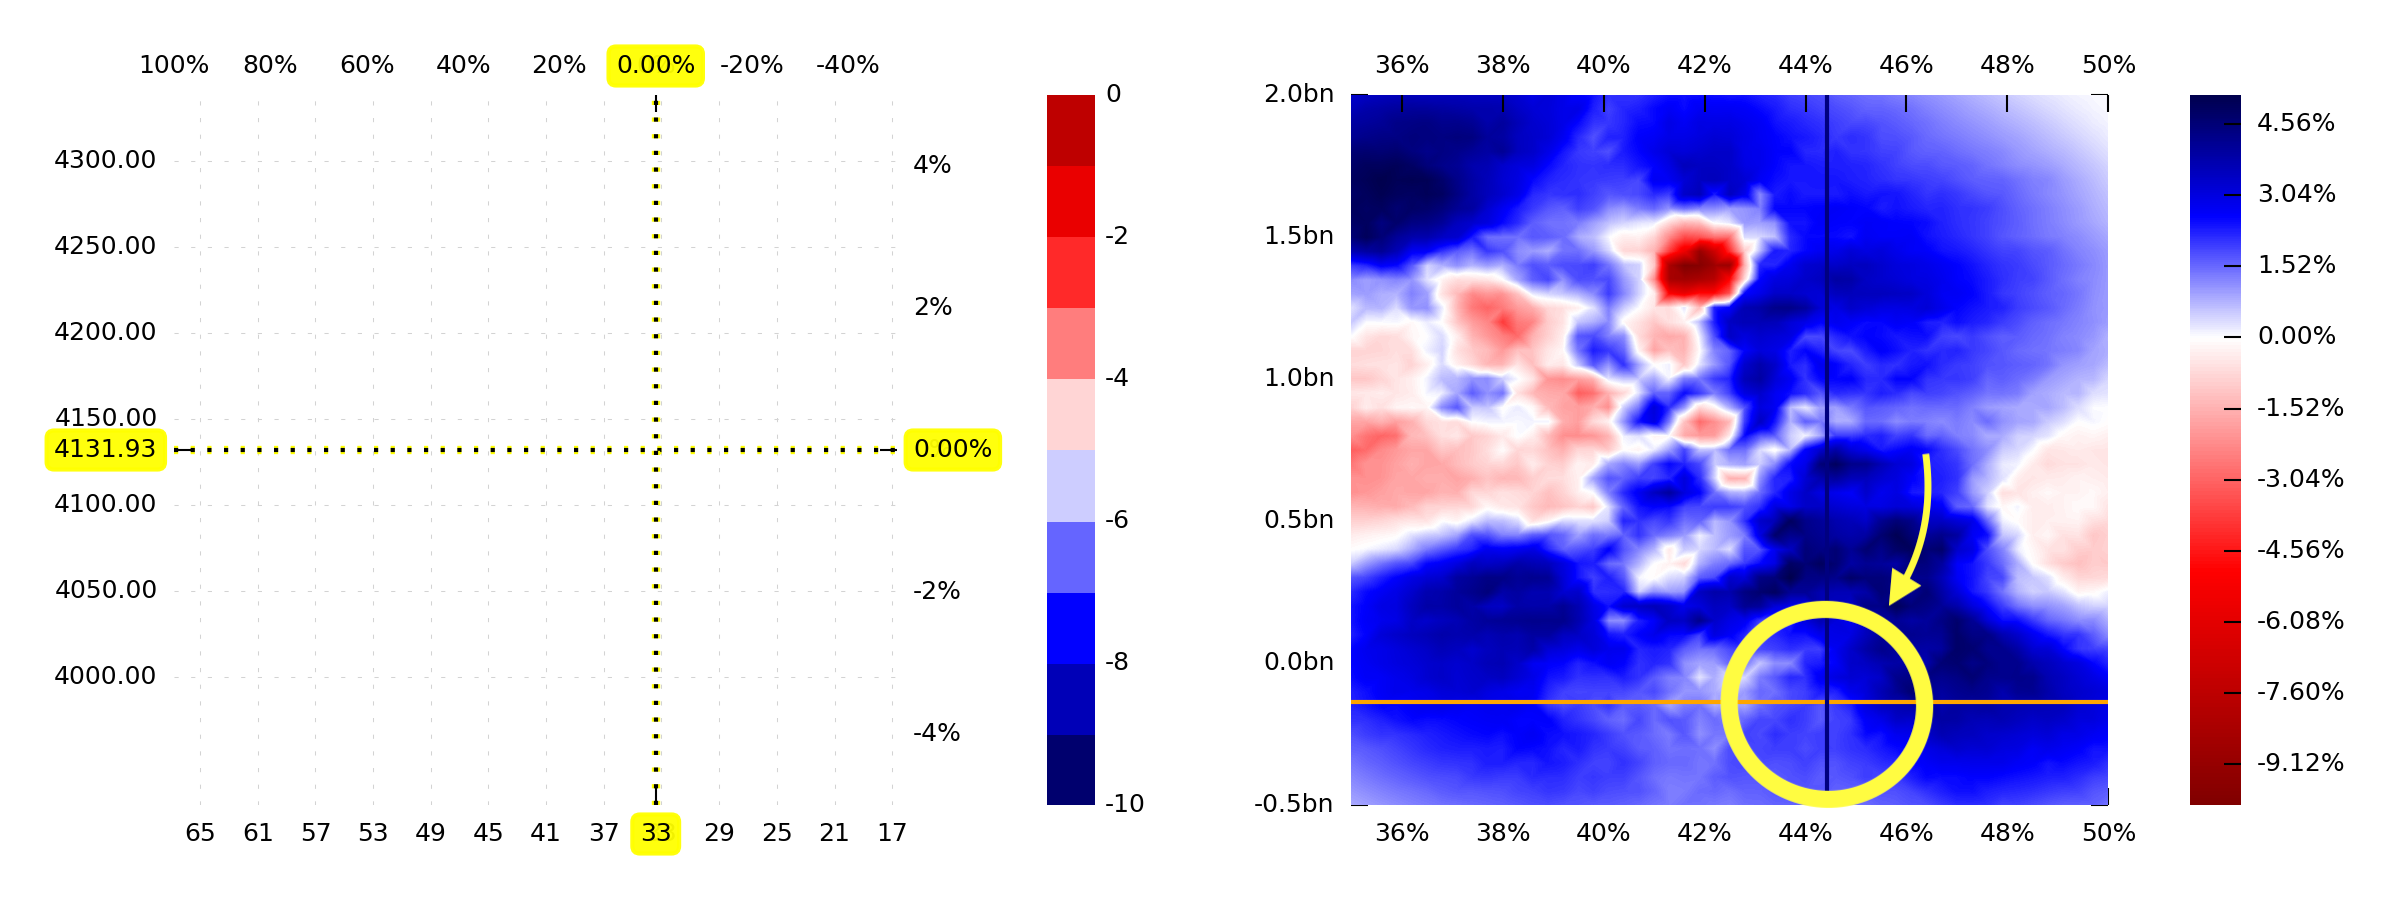
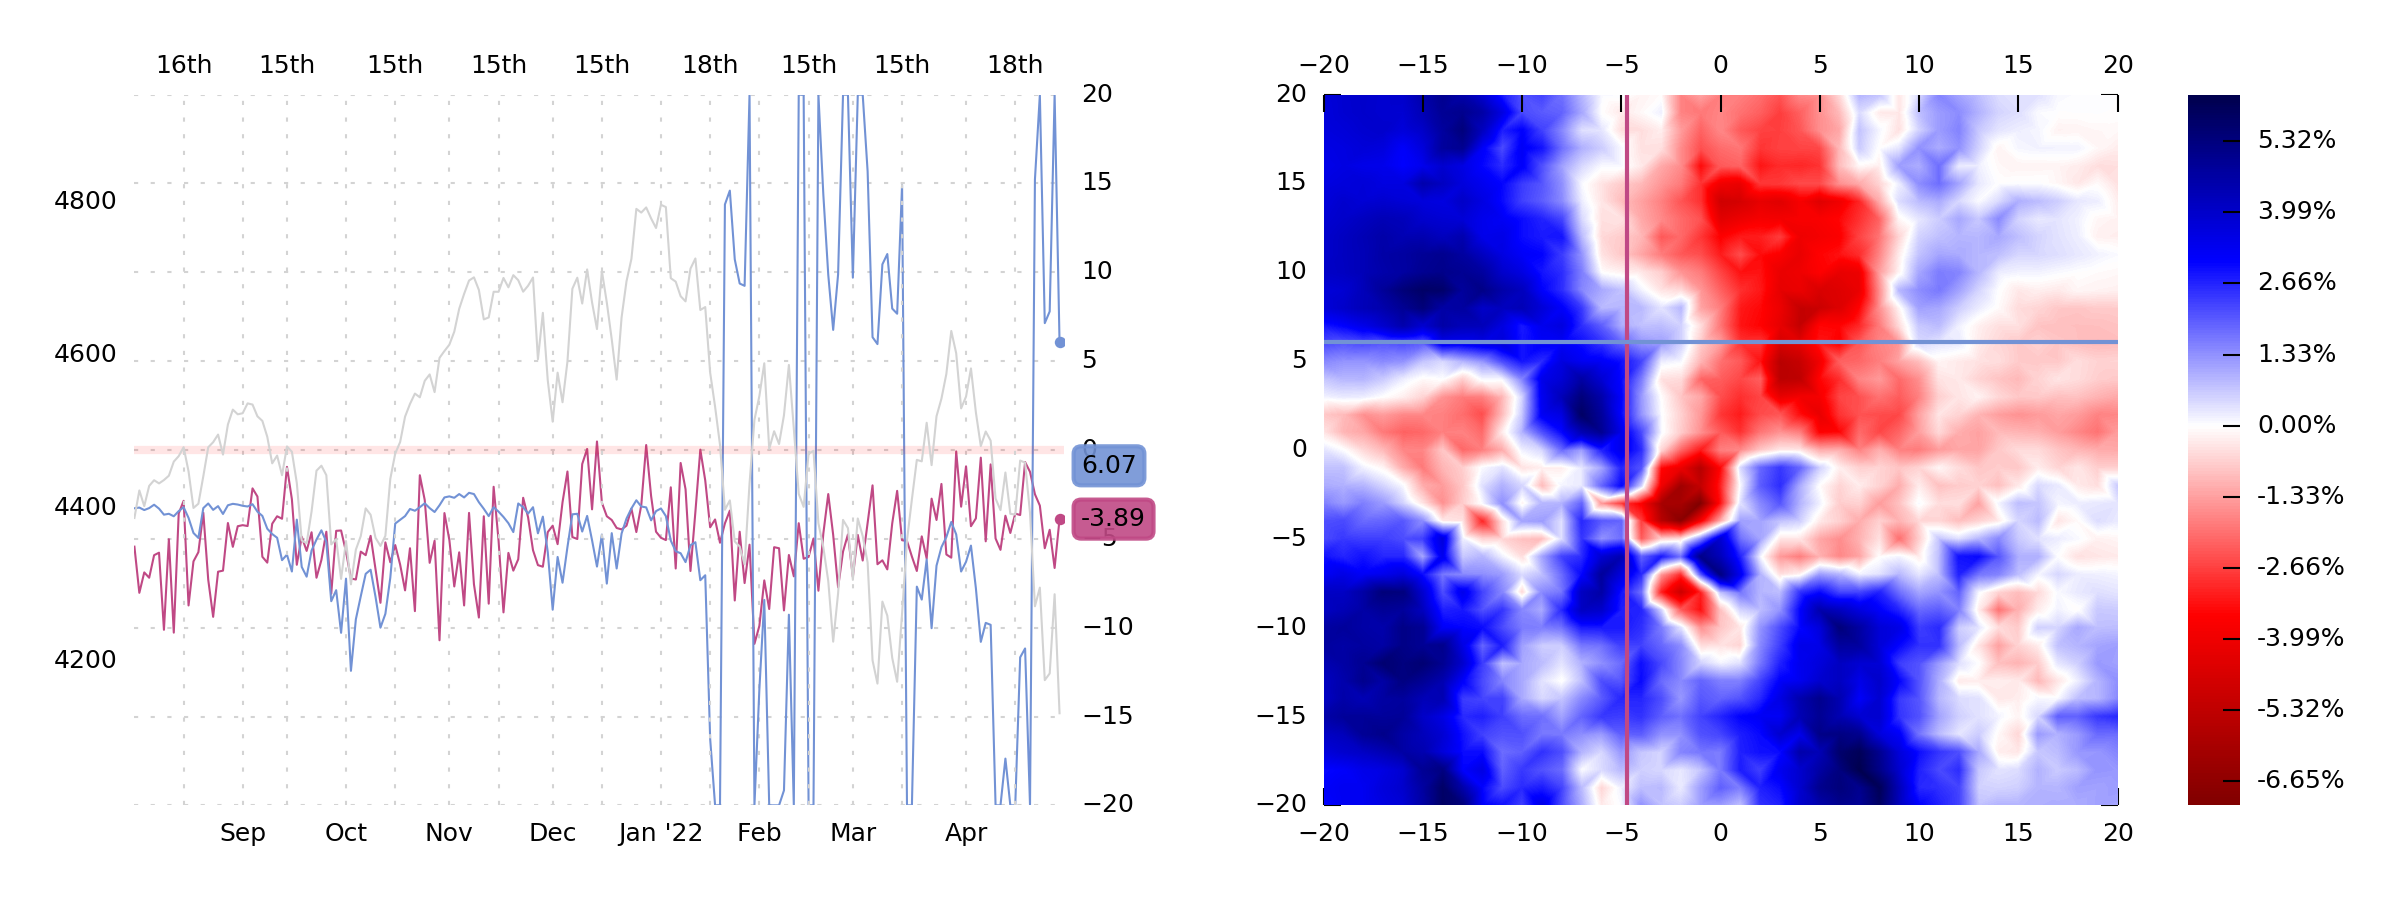
Above is a map of gamma-implied volatility (GIV). The heatmap is essentially a modified "local volatility surface:" It tells us what volatility would be, conditionally, if SPX and VIX were to move in any number of different ways, up or down.
Imagine, for instance, that SPX (heatmap y-axis) falls another 5.00% from here. The crosshairs re-position lower, into a yellow region of the map. Check the key: Yellow means 80 vol. And 80 vol means 4.00% daily moves... on average.
Another way of thinking of this is that, if SPX falls 5.00%, VIX would have to move much closer to 80—and quickly—to accommodate the new, extremely high, level of realized volatility. And since VIX is "only" 32 right now, that would be a very violent re-pricing of risk. Extremely high vol-of-vol. Liquidity would disappear entirely.
That's capital-R Risk.
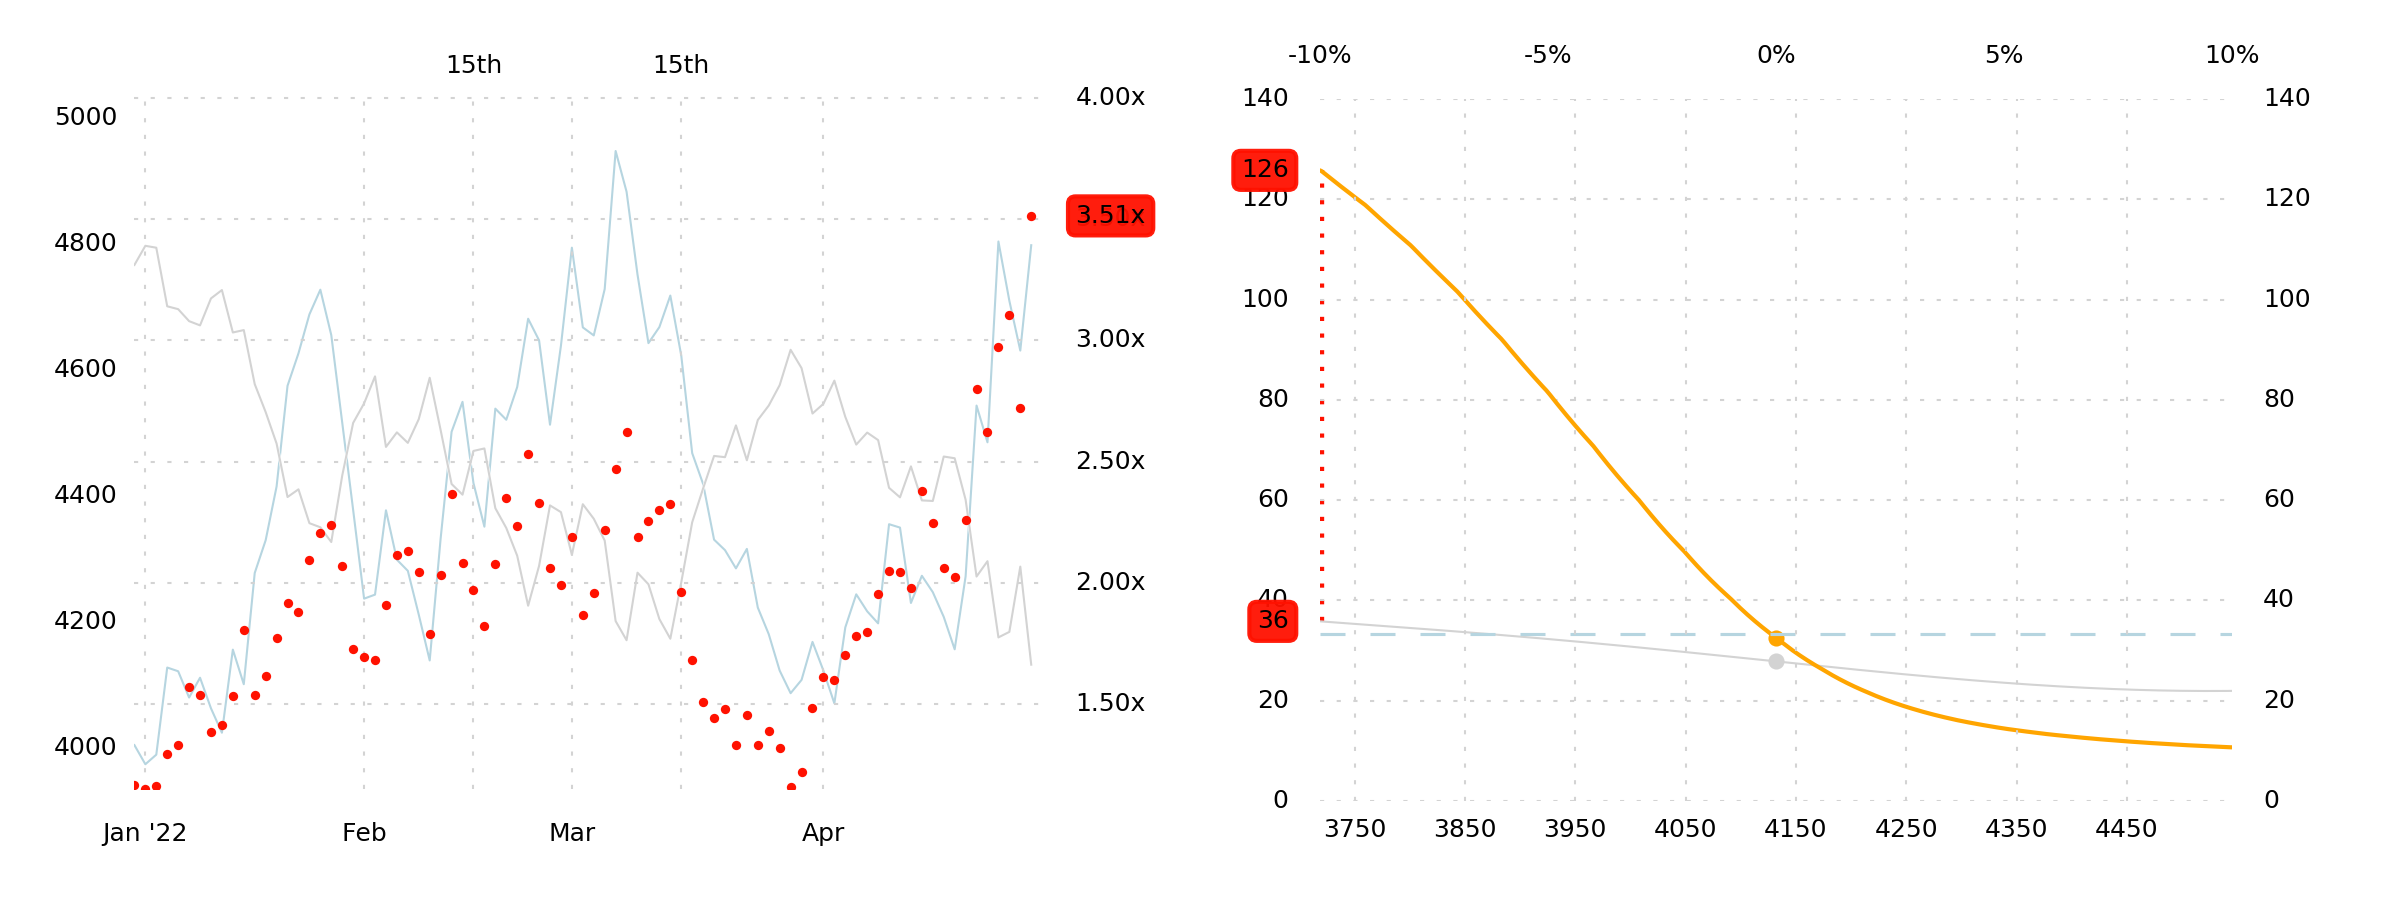
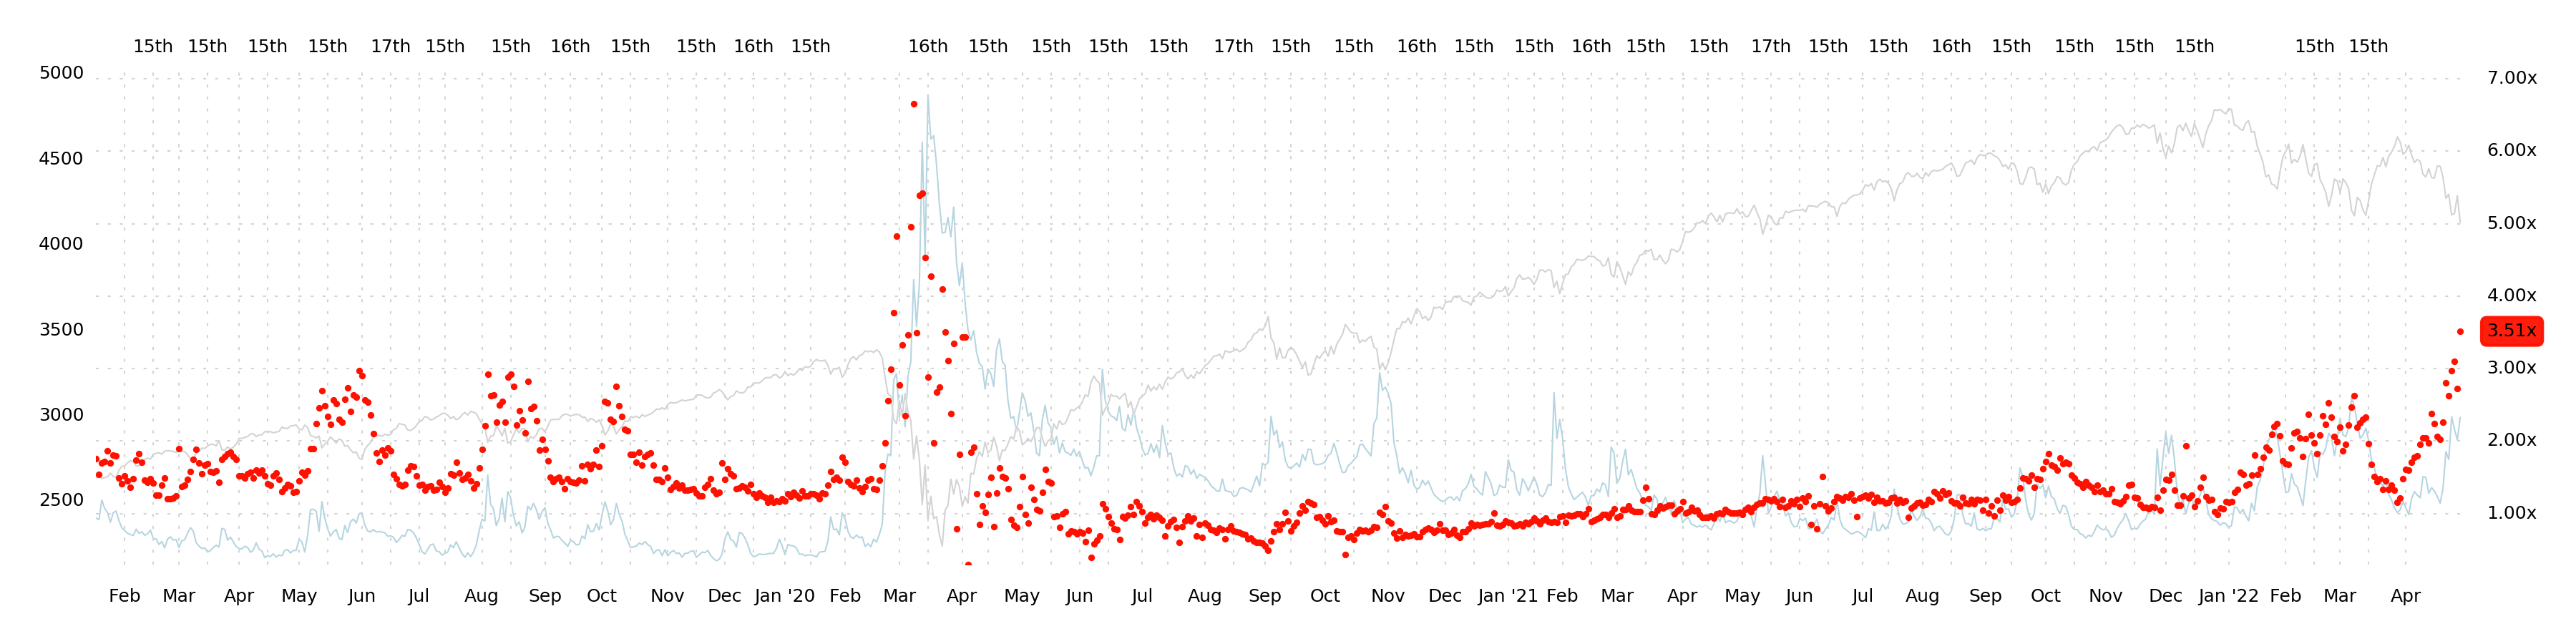
The Crash Risk (CR[x]) indicator (left, below) does what we just did above, except that it looks at not a -5% move, but a -10% move. Naturally, the story is going to be the same.
A -10% move in SPX would cause realized volatility to rise to 126 (over 6.00% average daily moves). That's circuit-breaker stuff. The one-month -10% OTM SPX volatility is 36. This is too low to account for this possibility.
When the conditional -10% GIV is 3.00x higher than the market-implied one-month volatility at the same strike, that's when we start getting worried. As you can see above, it's now 3.51x.
What does this mean, in context?
It's meaningful. This degree of Risk internal to the market has not been seen since February 27th, 2020, when CR[x] was 3.77.
We don't often buy puts, and when we do, it's usually a put spread. It is rational, depending on your goals, to actually buy OTM puts at a juncture like this (and it was for most of last week, too). It is very likely a bet with a positive expected value.
However! A positive expected value is not a slam dunk, and this is where we need to hear from the irascible Robot named Jim—who can provide a bit more context. Yes, the dealer gamma-vanna situation is such that an actual crash could occur here, but we must understand that the circumstances that trigger a crash needn't occur. (Read about
"things that didn't happen but totally could have happened.")
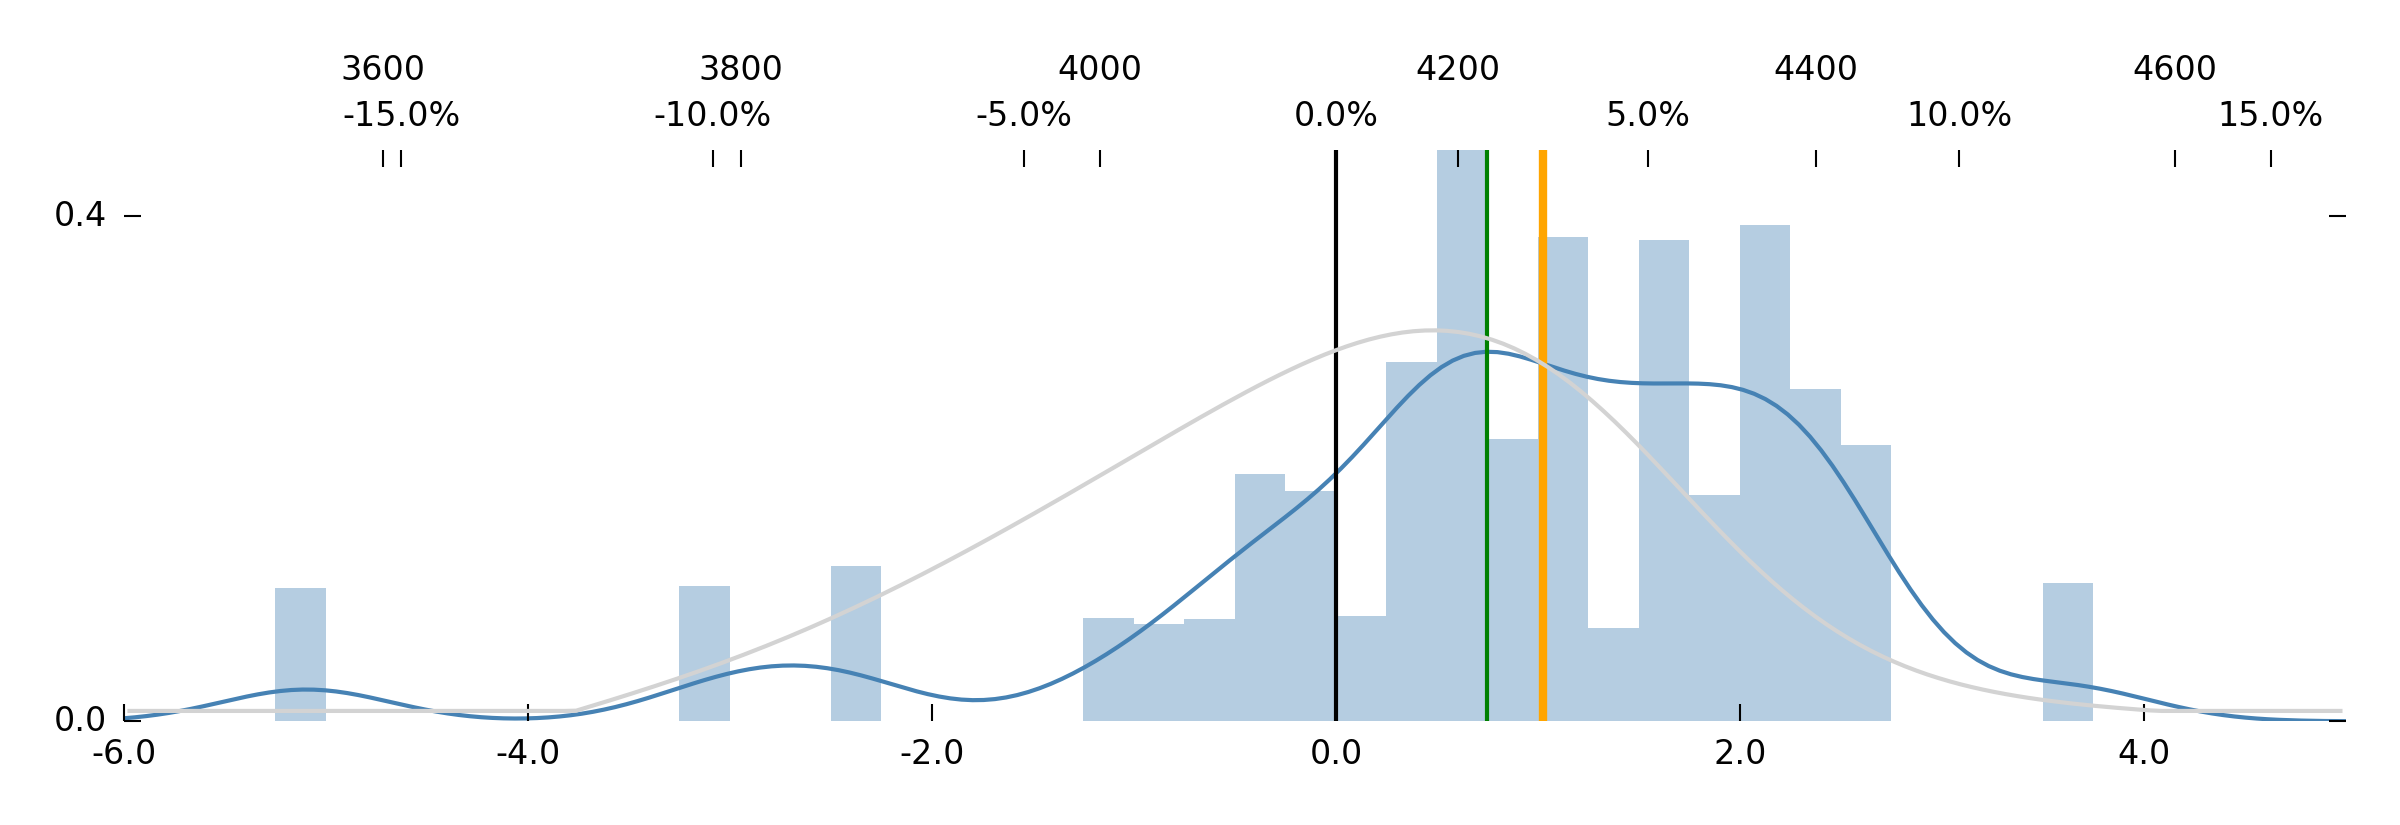
You can call Jim an optimist if you're feeling sour about his relatively sanguine outlook lately, but there's no denying that he's a pragmatist. You can remove whatever bullish data you believe is skewing his distribution (Price, DIX, GEX+), you can make him look at data back to 2004, or you can make him apply weighting to older data to encourage bearishness (we've done all these things)—but his distribution hardly changes.
(Did we ever mention that Robot Jim is actually named after Jim Simons? We imagine him smoking cigarettes and laughing wryly at us.)
The truth of the matter is that the left tail is always a low-probability bet, even if we have reason to believe that it's a good one. And when volatility is fairly priced or underpriced, the best bet, historically, is overwhelmingly to be long OTM calls. (Some of you will remember that we were long OTM calls into 2018 Volmageddon. We don't regret this. We knew vol was cheap, and all we lost was a couple dollars while everyone else was blowing up.)
To that point, Jim sees an advantage in being long calls and betting on the right shoulder of the distribution (2.0 MAD, ~6.00% weekly gain).
And so, in the same way that the back half of 2020 had us slamming the bid on SPX iron flies for juicy, high-probability wins; it feels like the front half of 2022 is going to have us poking continually at calls. It's not nearly as satisfying—but there's no doubt that any temptation to be short vol here is a foolish one.
Aside from that, there is a lot of room for discretion. In a spontaneous act of regret minimization, we actually bought some 3800 puts at the beginning of the day on Friday after pondering Crash Risk (so far, lucky). These will probably expire worthless, but we know it's not a bad trade.
Want to delta-hedge your calls? Go for it. Want to be long SPX and long VIX, in some suitable ratio? Go on with your bad self. Long SPX, hedged with long puts? Nothing wrong with that.
For our part, we'll be keeping those far OTM puts, and grabbing some OTM calls, too. Of course, we will continue to favor the bullish angle.
That's it. That's all we've got. A crash is on the table. At these junctures, survival is your priority—everything else is details.
Other relevant thoughts:
1.
The 5-day mean of DIX isn't quite 45%, but there's no denying that there's still some dip-buyers out there. If we had to guess, the rotation of discretionary bondholders into SPX (though a relatively small exodus from bonds—a big deal for the passive bid in equities) is pretty much done.
The heatmap of DIX/GEX suggests an average of perhaps 1.50% monthly gains. And like we said above, even if you make Robot Jim ignore DIX entirely, his distribution doesn't change.
2.
NPD is not giving us a bullish signal. This was also true of last time SPX traded at these levels, and we said that this basically precluded the possibility of a stable, sustained rally.
In other words, no, a fresh bull market does not start from here. It can't. Not until we get a wave of put-buyers. However, VGR is so skewed toward customer vanna that a drop in VIX will strongly bid up SPX. Even this "vanna rally," however, would be temporary.
It's going to be a fun week.
Good luck!
The SqueezeMetrics Team