All the charts and data we refer to can be found on the Yacht Club page.
Hey everyone,
Last weekend, we vainly twisted our brains into a pretzel, and then, after generating much heat and noise, managed to simplify things:
Perhaps the best [first] question to ask to find out if GEX is being displaced by "meta-GEX" is simple. Is GEX(+) getting worse at predicting incremental differences in realized volatility?
Because if so, that would suggest that some delta-hedging, at the index level, is being neglected.
This proposes a less-sophisticated causal mechanism than "dispersion," correlation matrices, or anything having to do with skews or risk premia or whatever—the idea is simply that if dealers have been able to pick up some index-correlated long call and/or short put exposure in sectors or single-names in recent years, then we should see the effects of GEX+ on realized vol dampened.
What this could mean, then, is that an option dealer, short an SPX call and long an AAPL call, carries both options without a delta-hedge in either underlying. As a result, we (seeing only that the dealer is long an SPX call) would generally expect a certain amount of index vol-dampening from re-hedges—but we're wrong. Because the delta-hedge isn't happening.
Our
first round of tests focused on how this situation might lead to mishaps. E.g., if a dealer is relying on AAPL, or TSLA, to correlate to the index and it doesn't... well, what happens then? Sounds interesting, right? Well—it really wasn't. But perhaps we were thinking about it
backwards...
In the past, we've commented on how when GEX+ is high, that actually drives uncorrelated returns in index components. Why? Because if index vol is being dampened, that doesn't dampen component vol directly or necessarily—the "solution" for index-centric vol-dampening was for sectors to wiggle around opposite to each other. The index could realize 5 vol while sectors realized 10 vol, but danced around opposite to each other. This explanation assumes the relative dominance of "index" flows—that they are the efficient cause.
Instead of getting fancy, let's maintain this assumption for today.
And so, if we're right that there's "delta-fudging" going on in the index, and we're assuming that the index hedging flows still dominate day-to-day price movement, it seems logical that we should expect to see less of that uncorrelated dancing movement in high-GEX markets in the last few years. Instead, realized correlations should be more stable across the board, particularly between the S&P 500 and the component(s) with the most call-buying and put-selling option flows.
I.e., there should be less volatility-of-correlation between SPY and QQQ over time.
This is pure logic. This extends naturally from what we know about GEX and all of the research we've done over the years. However, it feels like a totally backwards thesis in this current market.
Which, honestly, makes us more hopeful that it's correct...
Let's find out.
But first...
- T–4
- Vega convexity
- Lower complexity
T–4
Two things jumped out at us from this past week. First, a bout of put-selling.
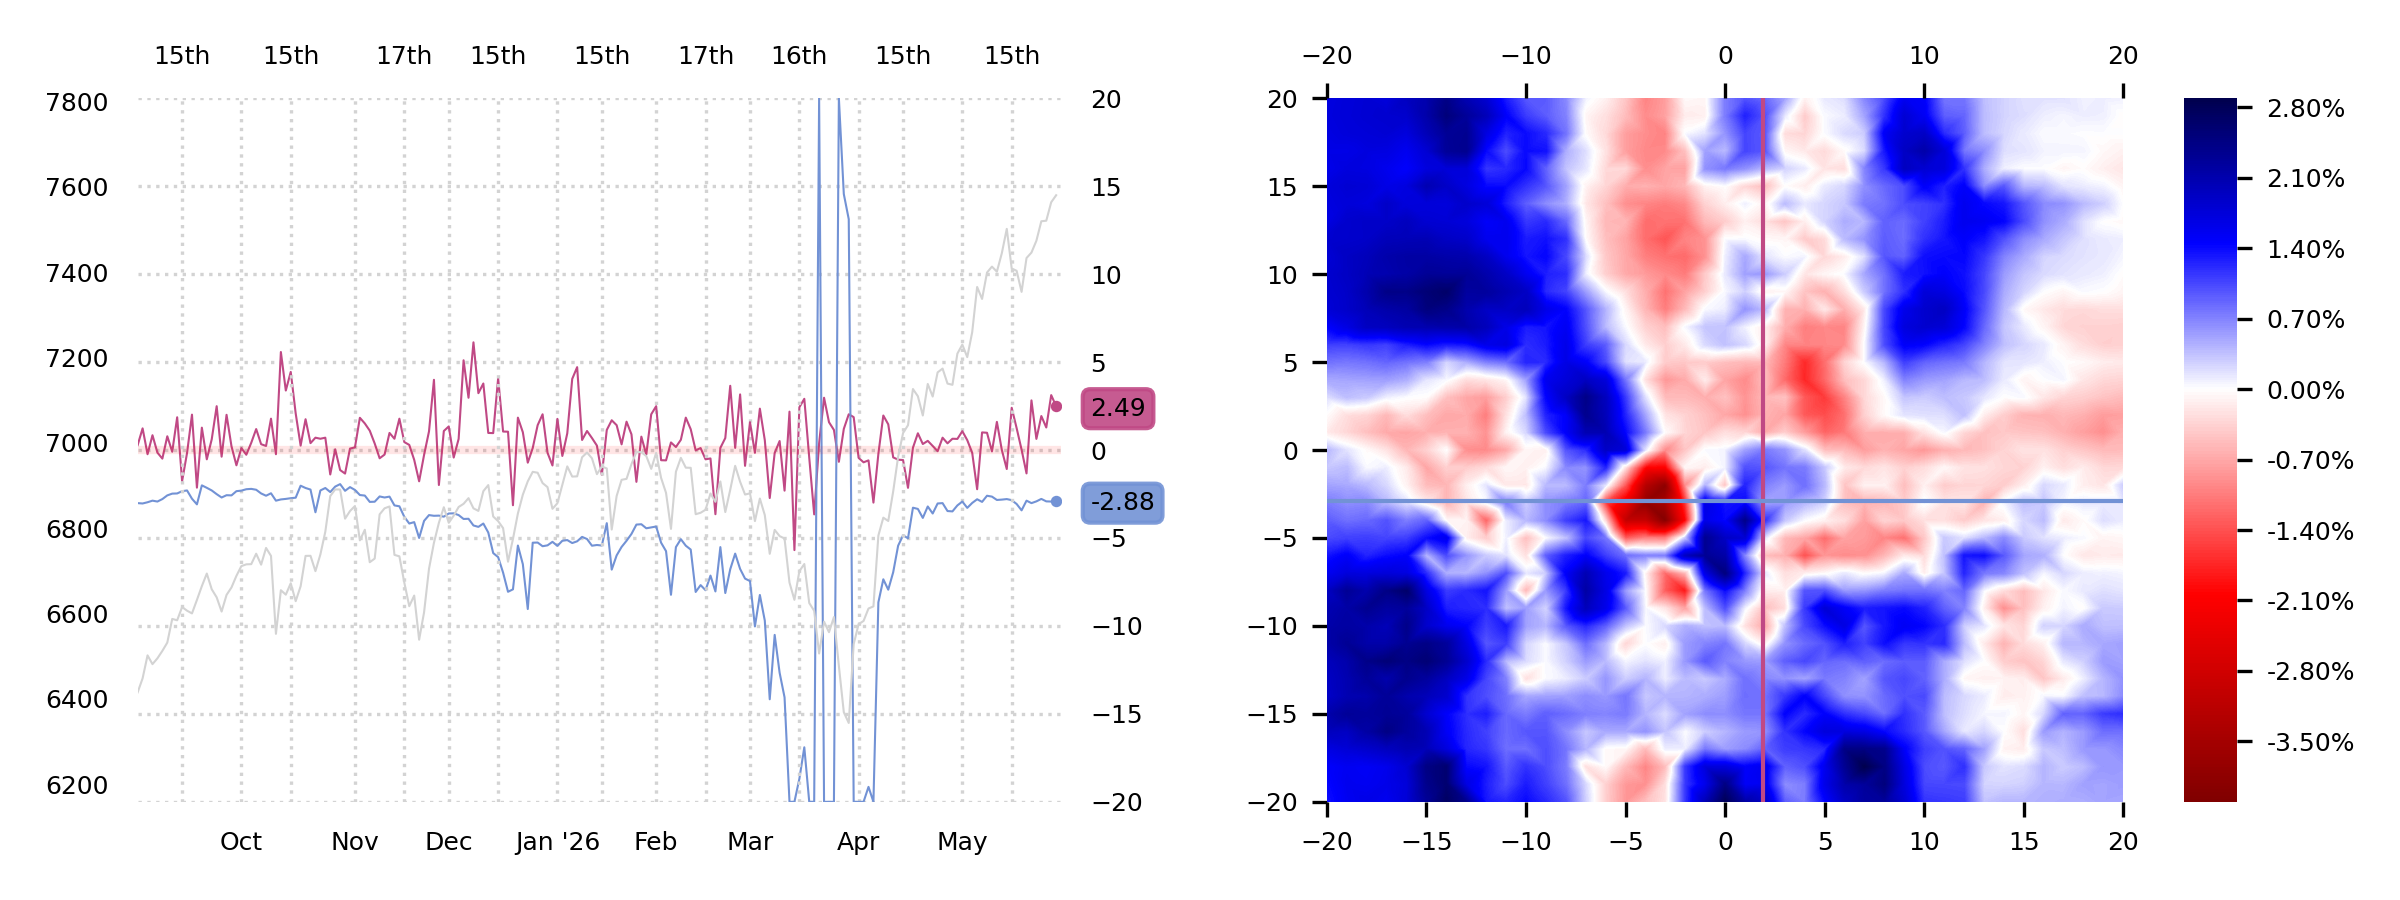
The wine-colored line indicates that this week has been uniformly characterized by put sales (NPD +2.49 on Friday). They're not big numbers, but it's persistent. Put sales, historically, don't seem to impact SPX IV directly, but this week, at least, they've coincided. VIX has fallen to 15.
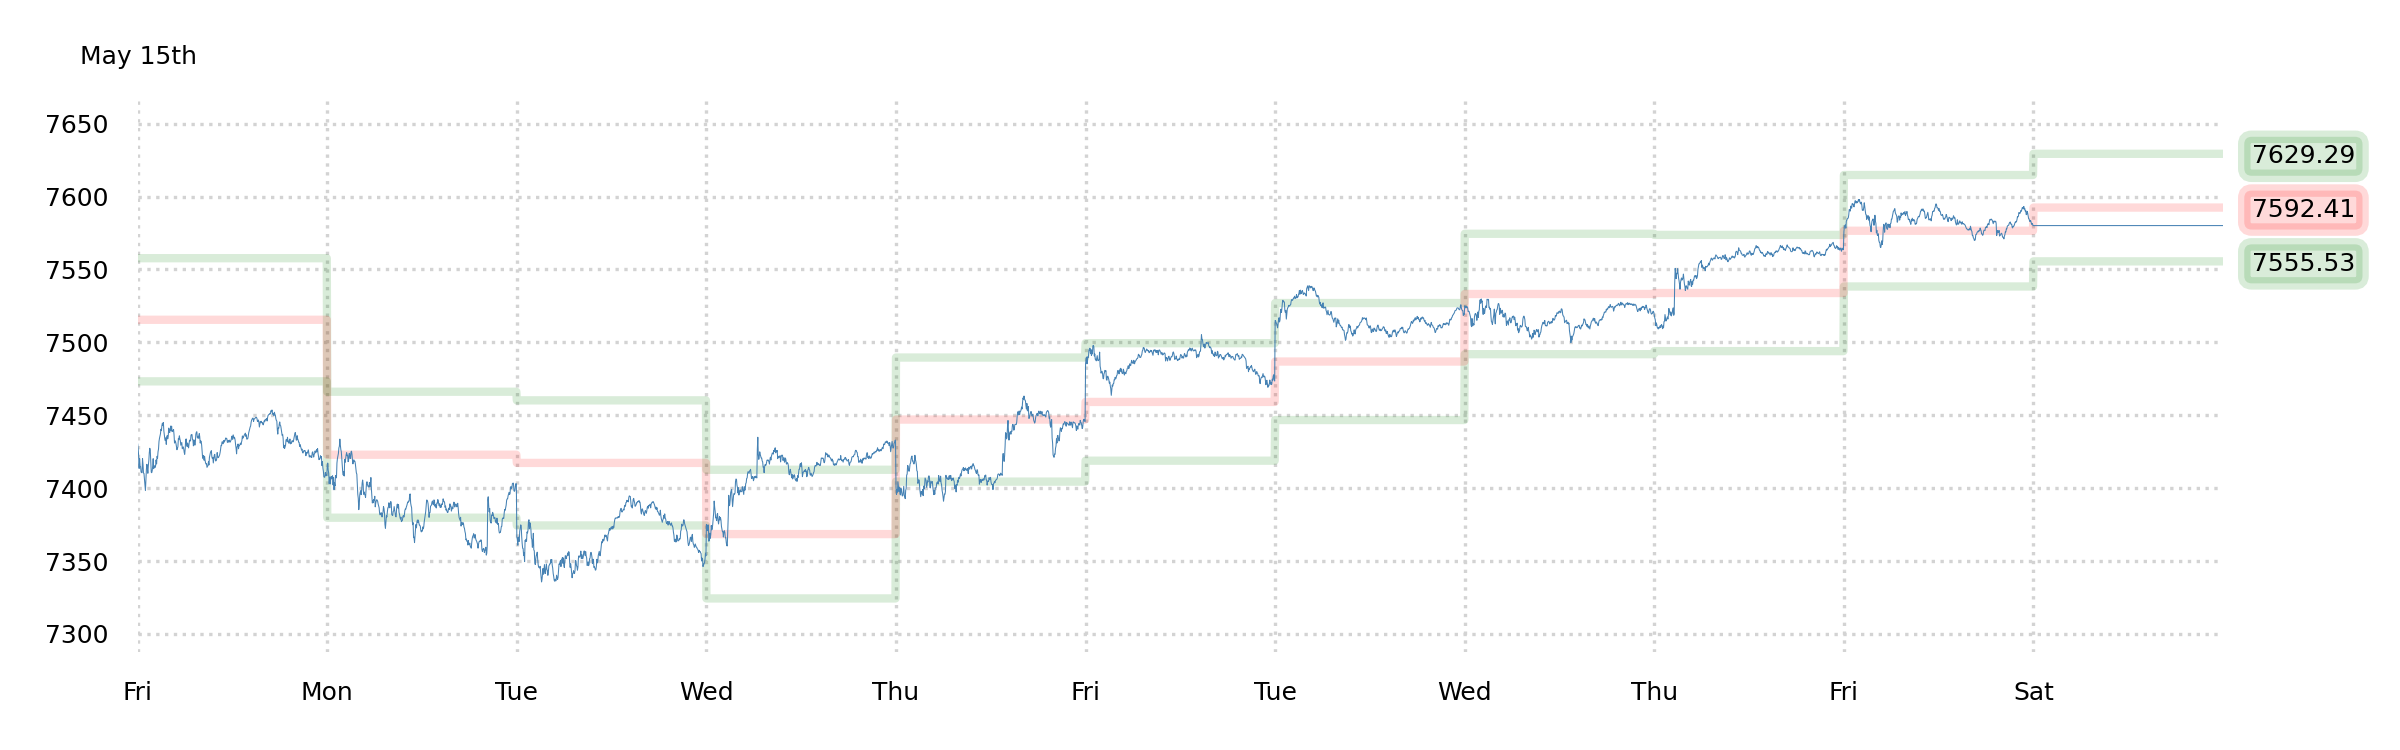
The second interesting data point was the fact that the 0DTE dealer re-hedging data indicated rally potential above certain intraday levels, but those rallies never sparked. This is not to say that the action wasn't bullish—it was—but that despite a clear justification, some rallying was dampened.
Taken together, these two incidental bits of data suggest that folks are interested in moving toward a lower-volatility environment. No more rally. Instead, "summer calm."
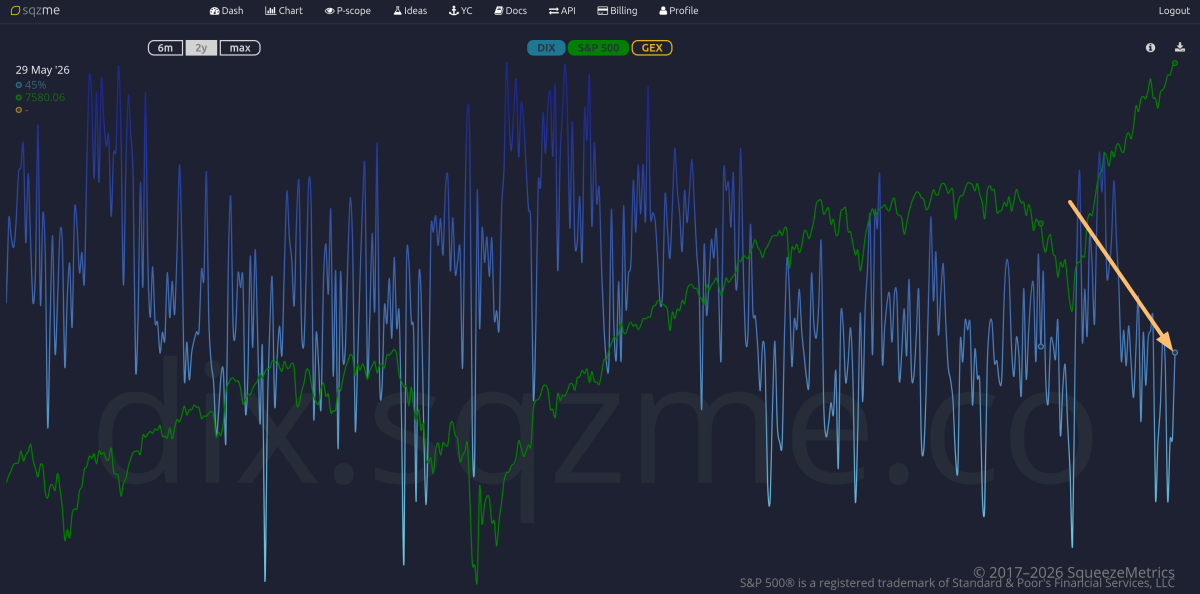
Also in the "this rally is over" camp is DIX, which has returned to levels that, historically, presage neutral to bearish action.
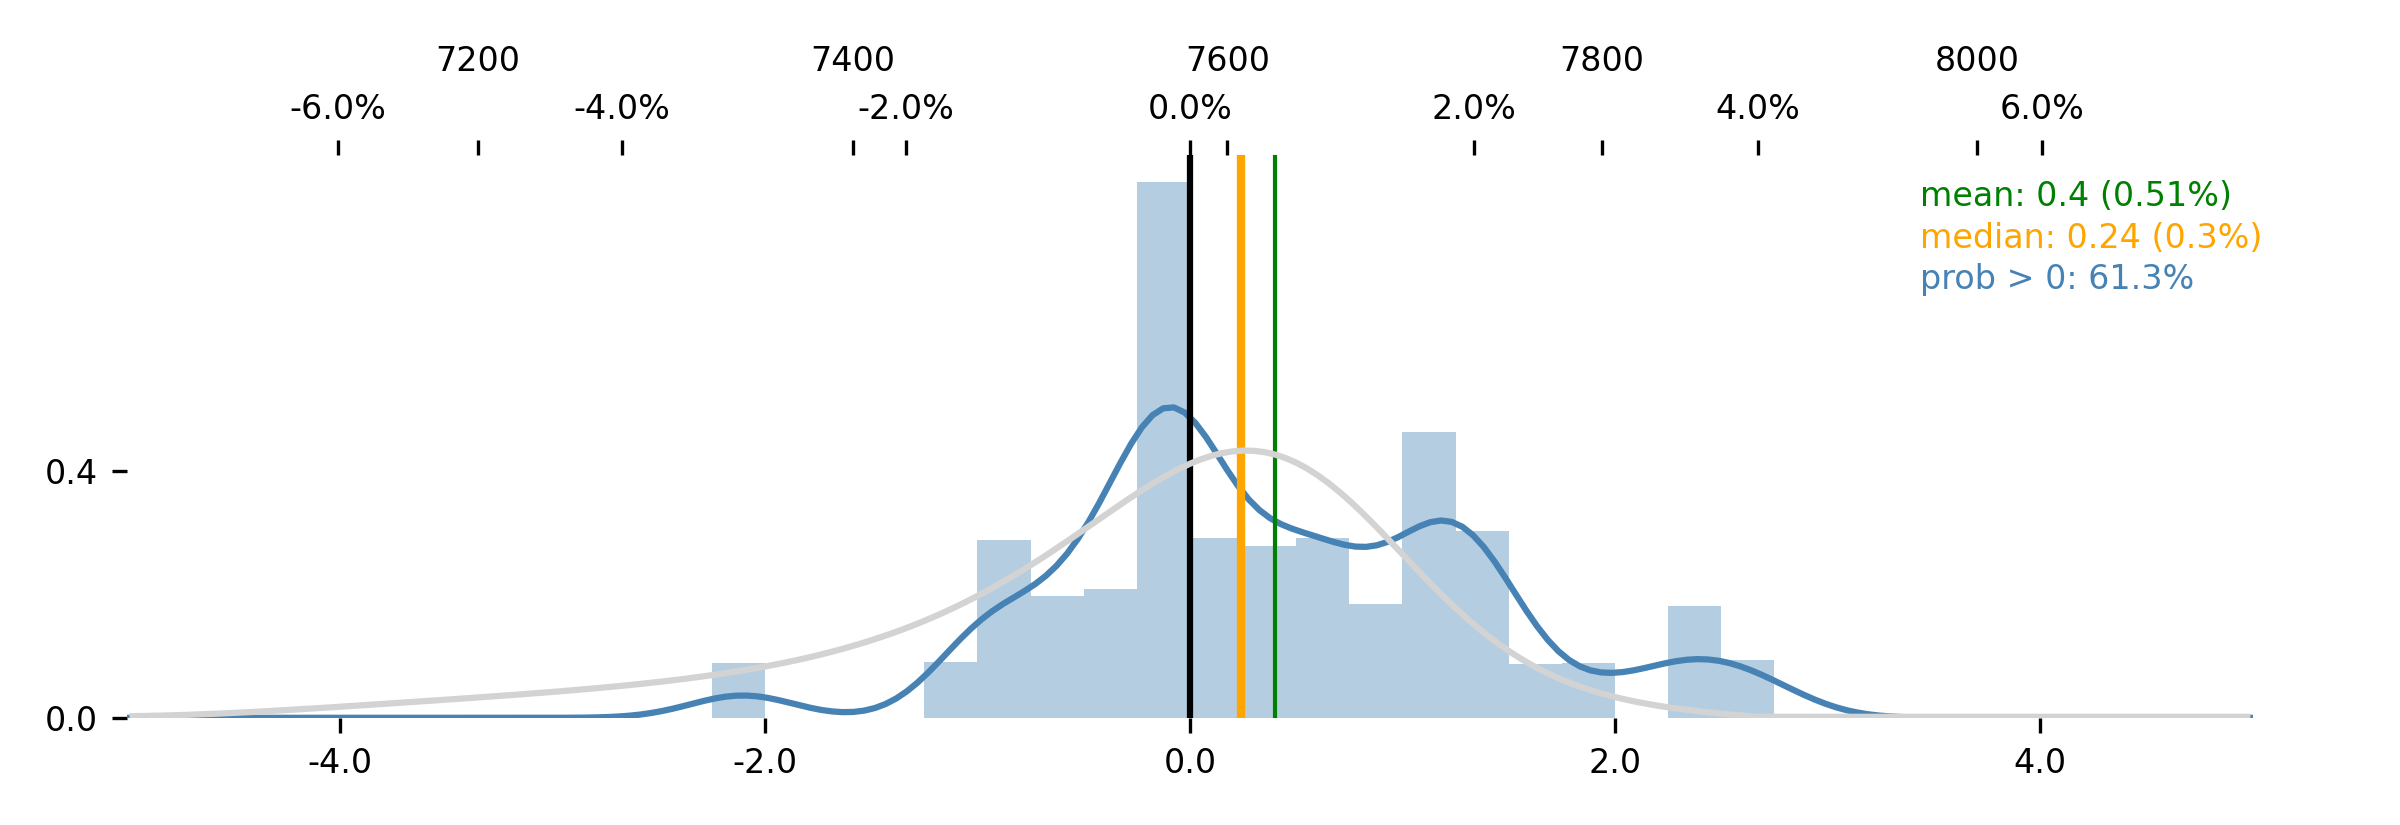
Jim's forecast for the week was neutral. Nearly a 1.50% rally transpired, which feels like a bit more than "neutral"—but we're not offended, because we've been hands-off aside from purely intraday bets.
But that changed, as of Friday.
Vega convexity
We
bought some volga on Friday. Deep OTM puts. A tiny bet, a tiny outlay, but a response to some changes in the data.
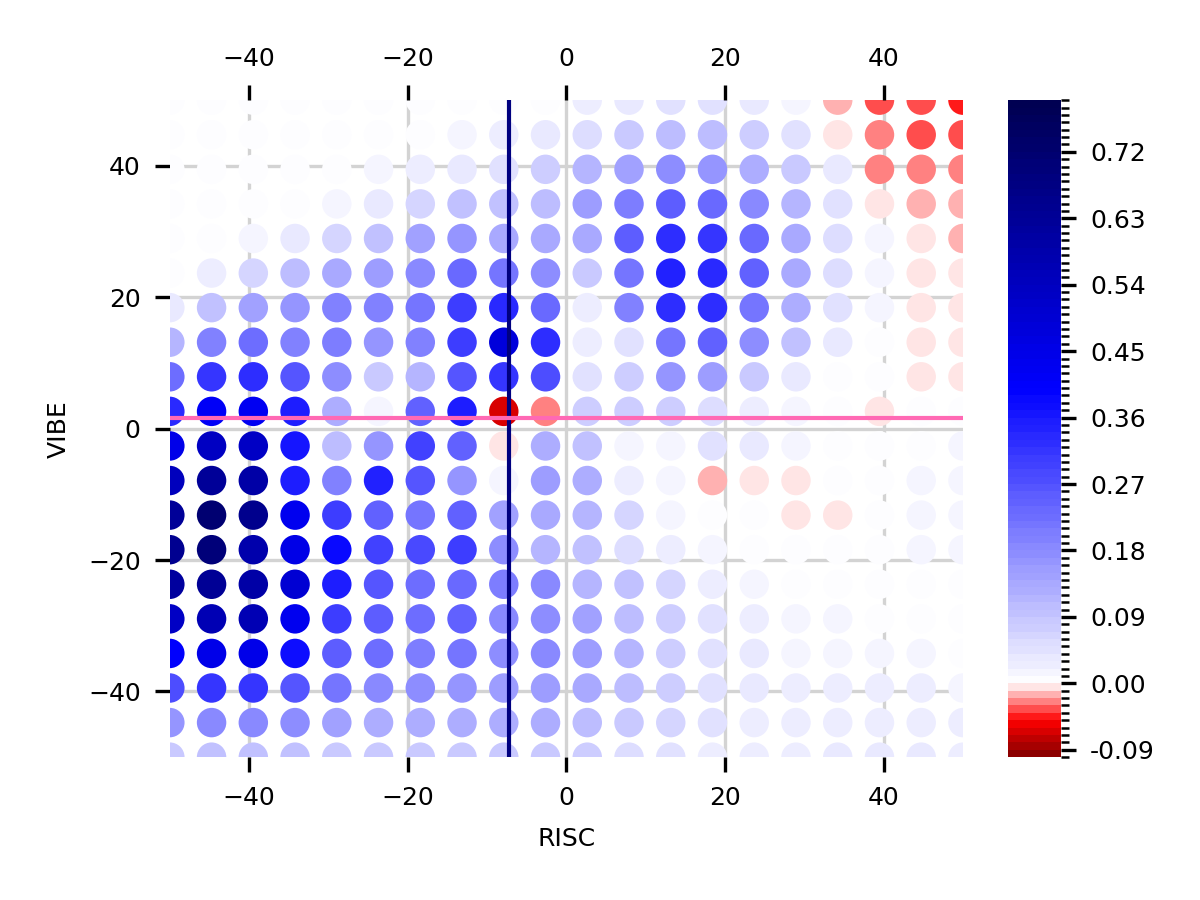
First of all, our eyes are drawn to the first time that RISC and VIBE have "circled the drain" in a long time, and ended up in the red zone. The crosshairs have spent the last two months slowly tracking inward as implied vol, realized vol, and their own respective volatilities made big moves and settled down.
Historically, this current combination results in volatility expansion over the next month.
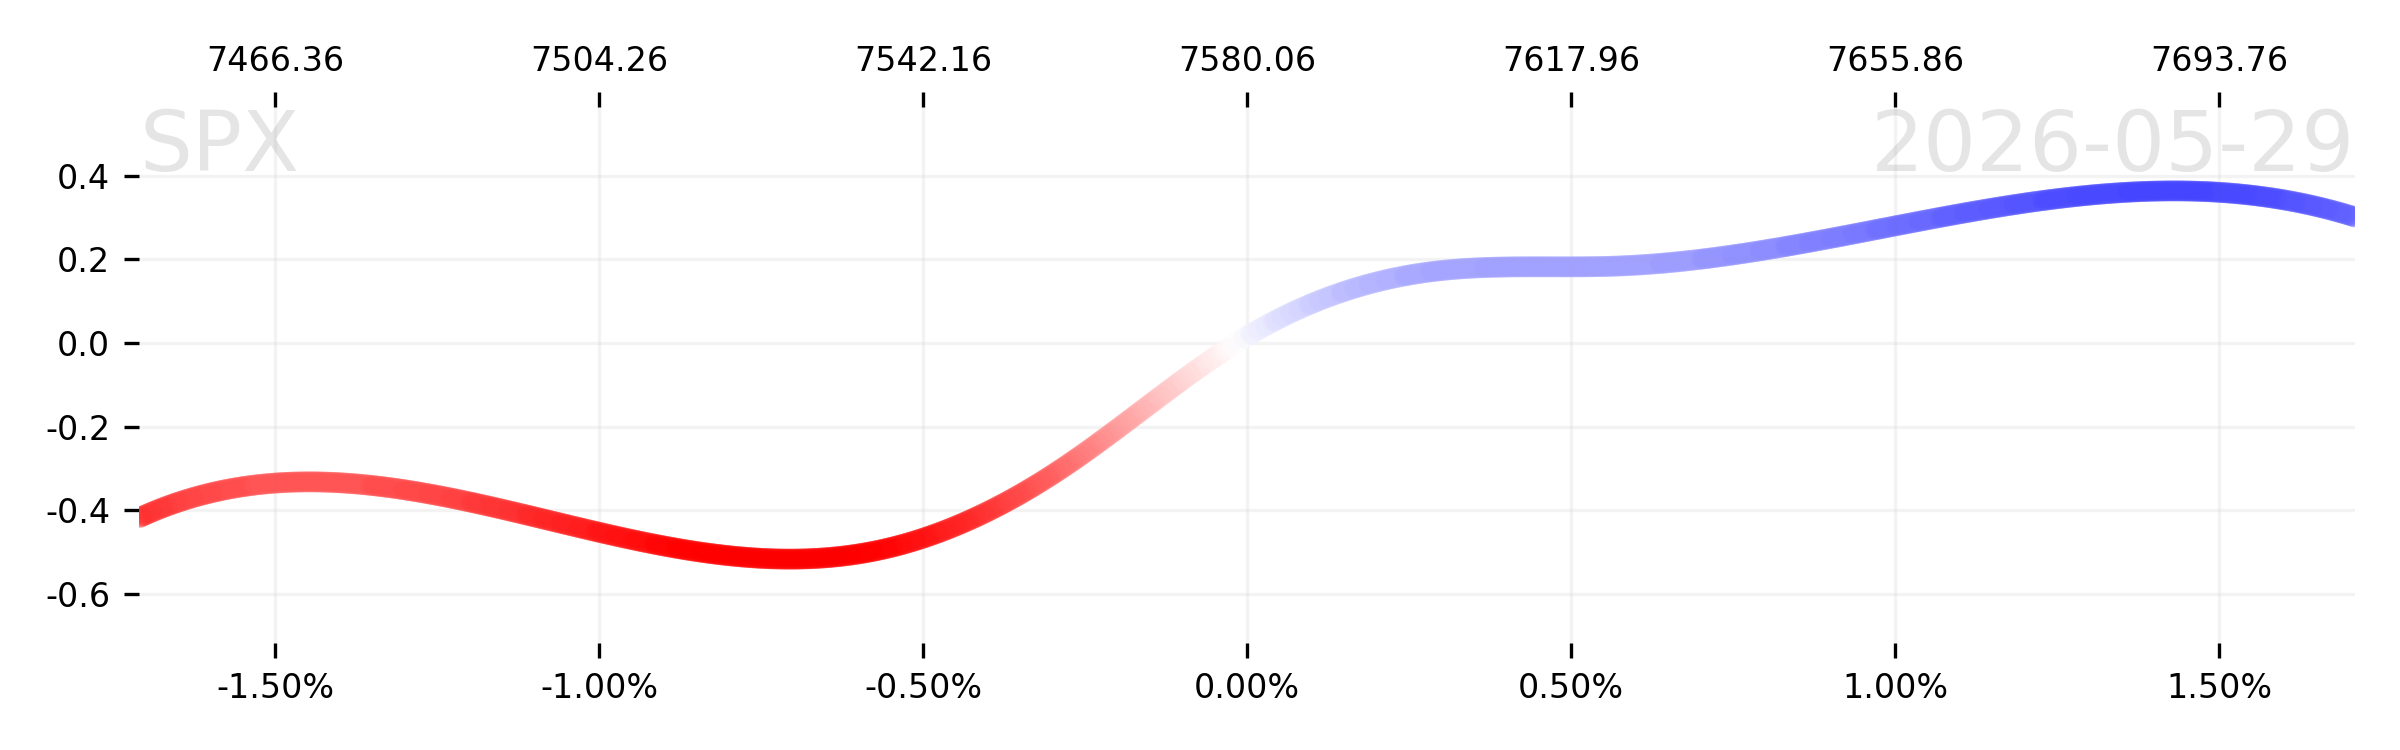
Second, there's Jim's step-forward plot.
Yes, right now the forecast is neutral, or even a touch bullish...
...but Jim says that the smallest loss on Monday shifts the balance in favor of bearishness. And he's quite decisive about that.
Had we been listening to Robot Jim over the last couple months, this probably would be the first time we'd actually be buying an SPX put. Instead, we "went full macro" and bet against this historic (and historically stupid) rally in stocks—which Jim was all-in on. So let's be sure not to tarnish Robot Jim's name.
Long a few wingy puts for the vega convexity. 'Cause there's finally a chance that vol gets bid for positioning-and-flow reasons.
Lower complexity
Let's restate the thesis:
there should be less volatility-of-correlation between SPY and QQQ over time.
That means that the realized correlation between SPY and QQQ should be more stable over time (particularly post-2022, as we found last weekend). So, instead of wiggling back and forth from -1 to +1, the correlation should be stickier.
And the reason for this would be that SPX option dealers are now routinely short QQQ-adjacent call options, and are not hedging the deltas of those call options, but are instead laying off the risk by using the inherent correlation between SPX (SPY) and NDX (QQQ) to neglect the hedge. And as more customers get long calls in NDX/QQQ stuff over time, there's more dealer long SPX call gamma that doesn't need to be hedged, and that thereby prevents "high GEX" scenarios from causing uncorrelated movement in index components.
Yeah.
Getting tingly. This is a simple-but-exciting thesis.
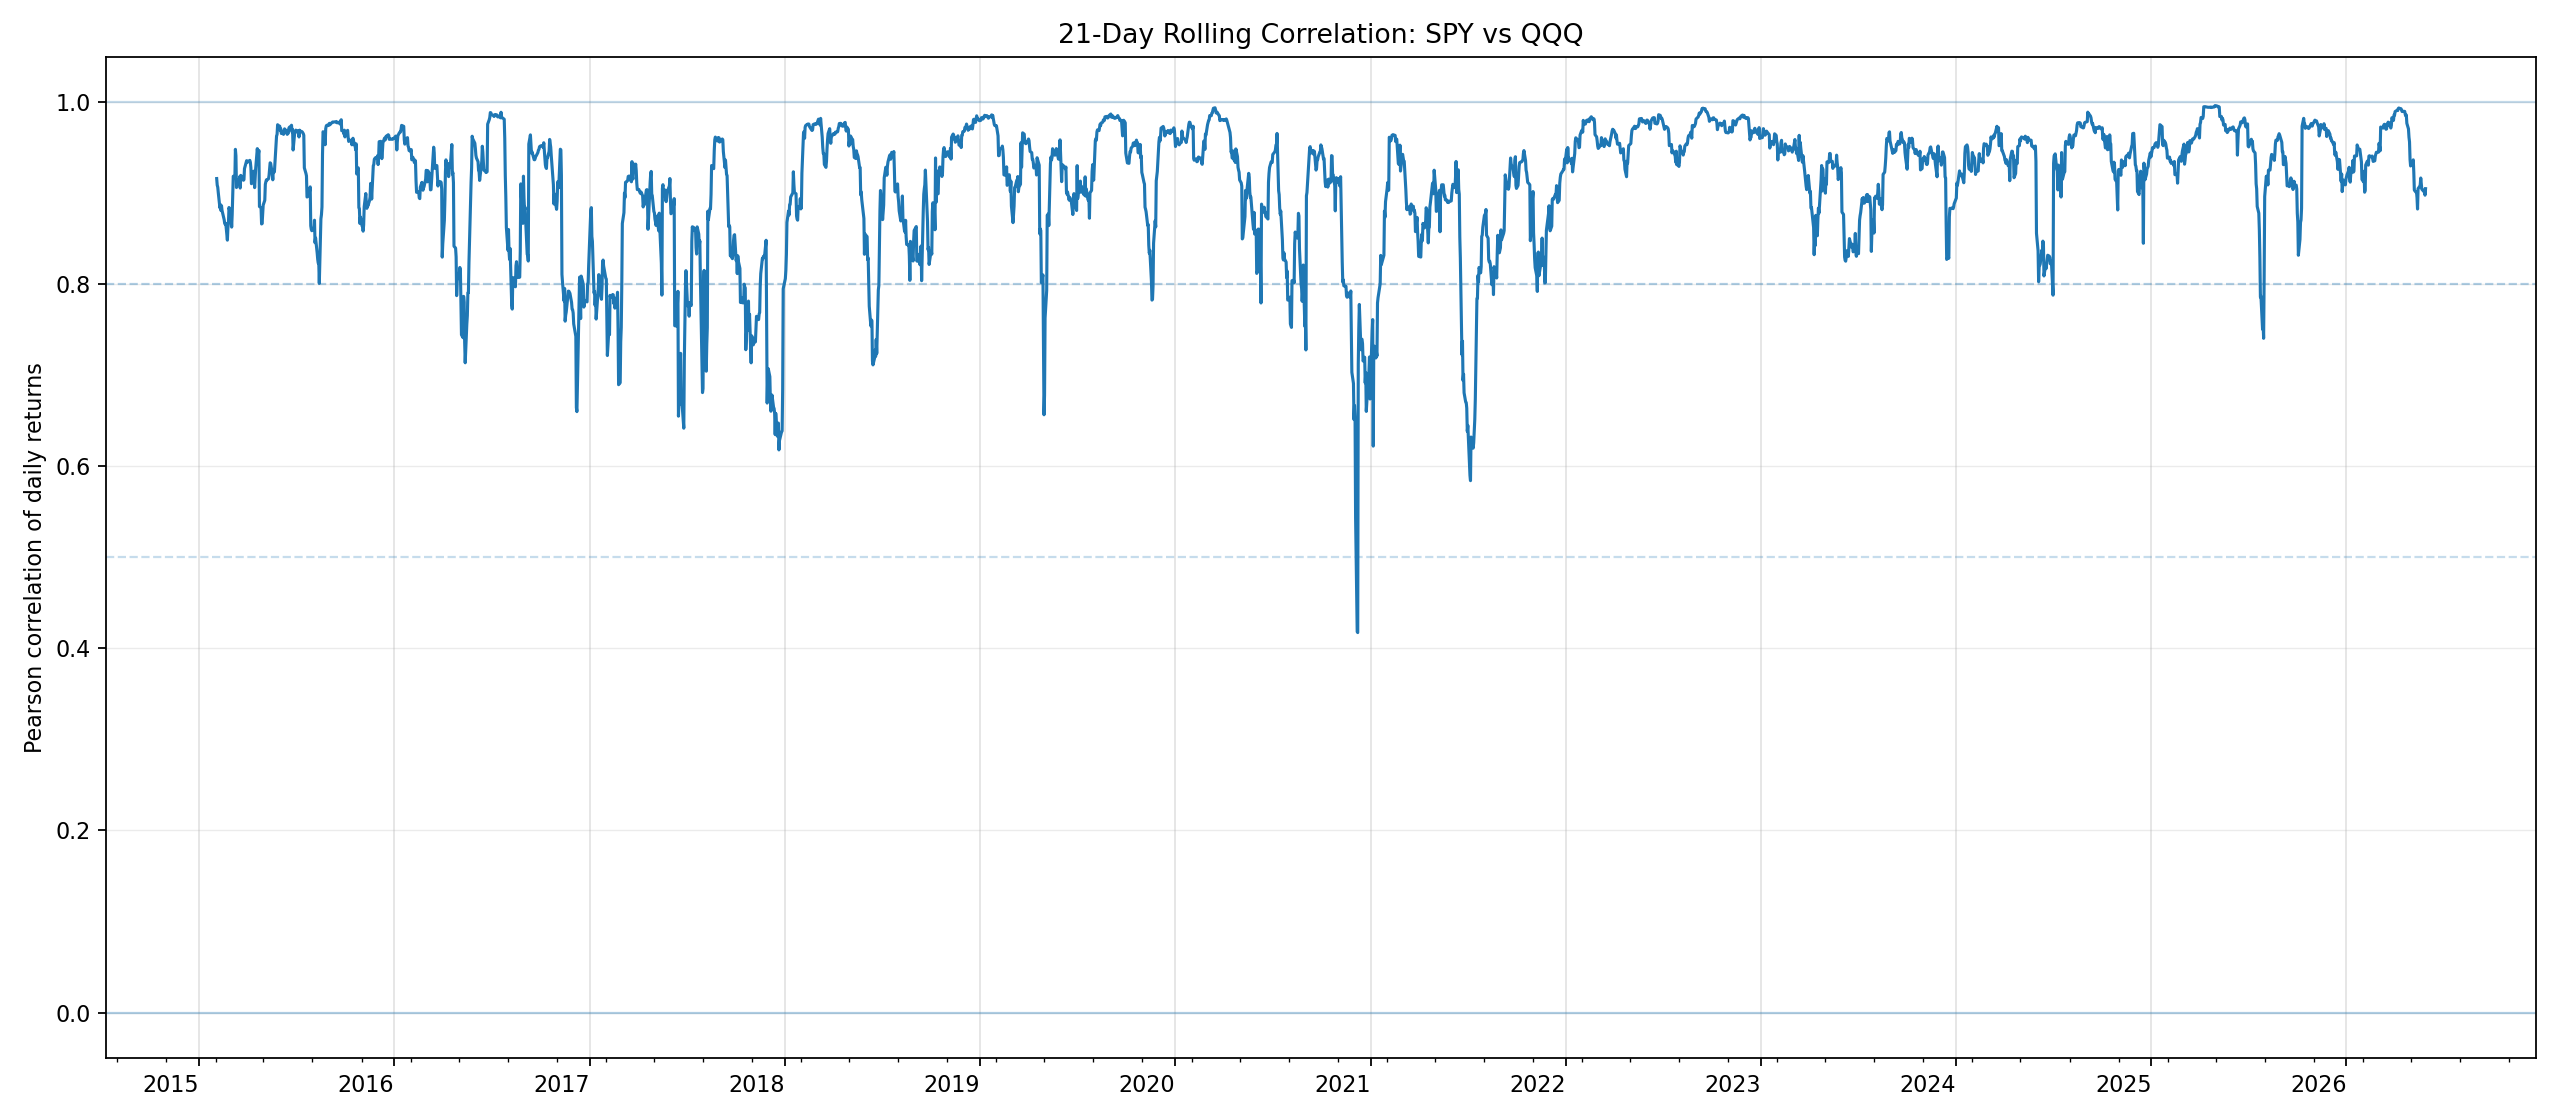
Querying the API. Grabbing SPY and QQQ. Going to do a "rolling one-month" (21-market-day) Pearson correlation between daily returns. Going to do 2015 to present. Python script is only around 200 lines, and it looks like we're ready to plot it.
Deep breath...
Bomb. Diggity.
Recent correlation, since 2022, nearly always above 0.8. Strong data there. Trend also appears pretty clear if you squint, but maybe the 1-month rolling correlation is a bit too choppy for a 10+ year plot.
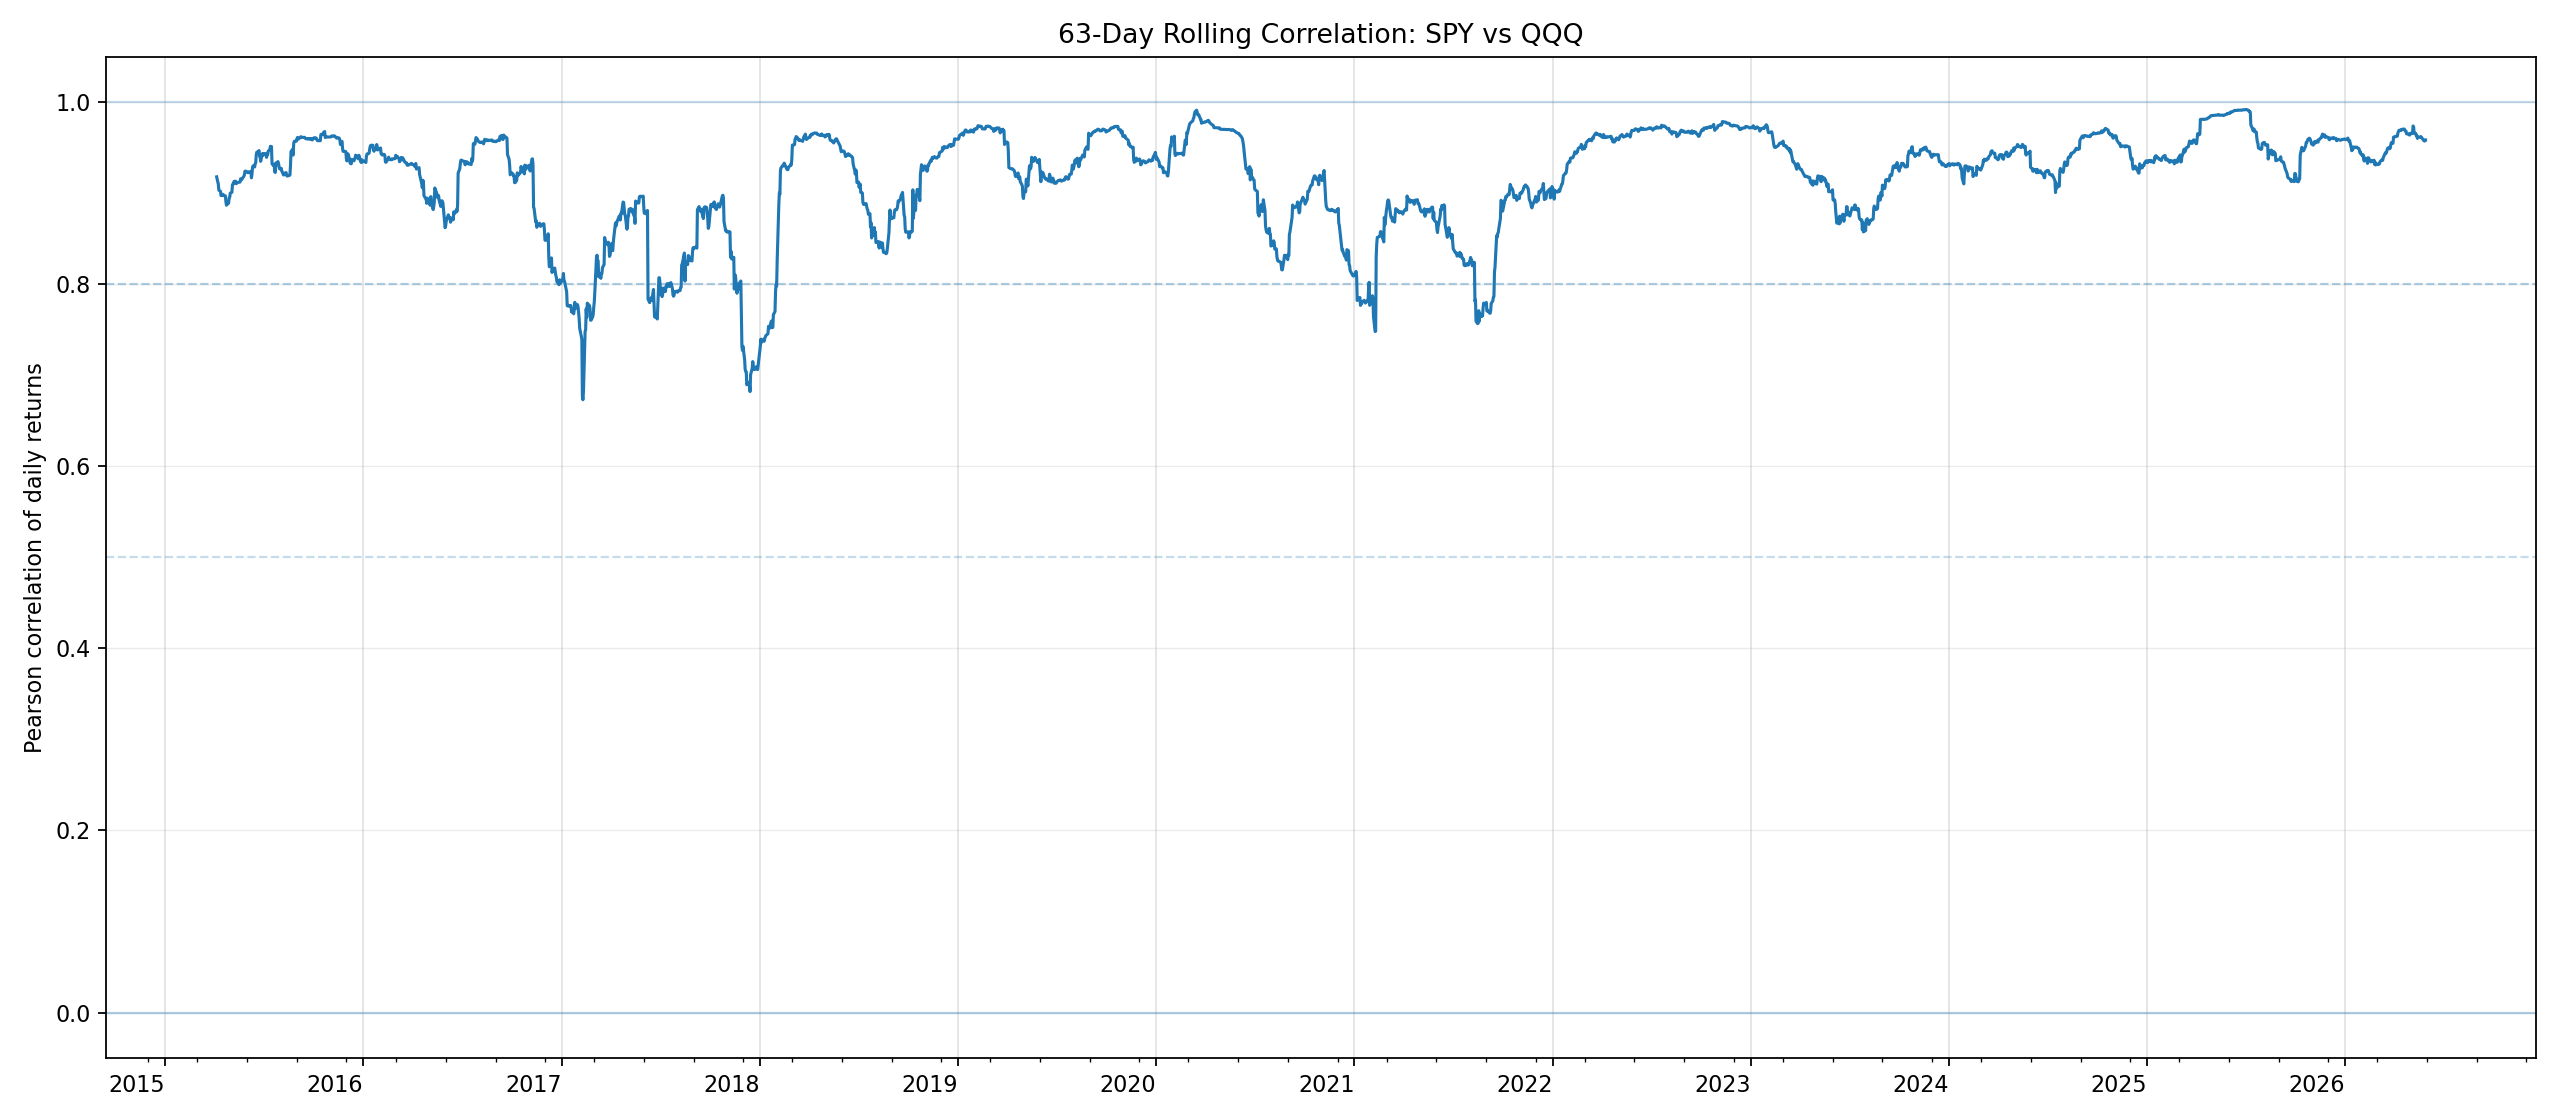
Do a quarterly rolling instead? Just for a bit of a smoother trend...
Oh yes. Look at it. It's beautiful.
there should be less volatility-of-correlation between SPY and QQQ over time.
There is.
(Ask for Python script if you'd like to replicate.)
But stare at it a bit too long and the quiet satisfaction of a well-behaved chart will be slowly drowned out by questioning voices:
- How much of this is from the indices become more "top-heavy" and, thereby, more similar?
- Is this a chicken-egg problem? Are unhedged calls in growth and momentum stocks a proximate reason for those stocks' outperformance? Oh my...
- What about the downside correlation? You need to break this out into upside and downside correlation to see if there's actually an effect from sold puts in single-name stocks or sectors.
- Is this chart "coiling?" Is this a cyclical thing?
- Can we isolate the bought calls? Where are they coming from, really?
- Weren't people buying a lot of calls in 2021? Remember the COVID gambling thing? Why are the correlations low there? Was it because "meme stocks" were never correlated with the index, and so had the opposite effect?
But let's shut out the voices for now.
That's what next weekend is for.
Enjoy the week!
The SqueezeMetrics Team