All the charts and data we refer to can be found on the Yacht Club page.
Hey everyone,
Yesterday morning, the data looked "clean."
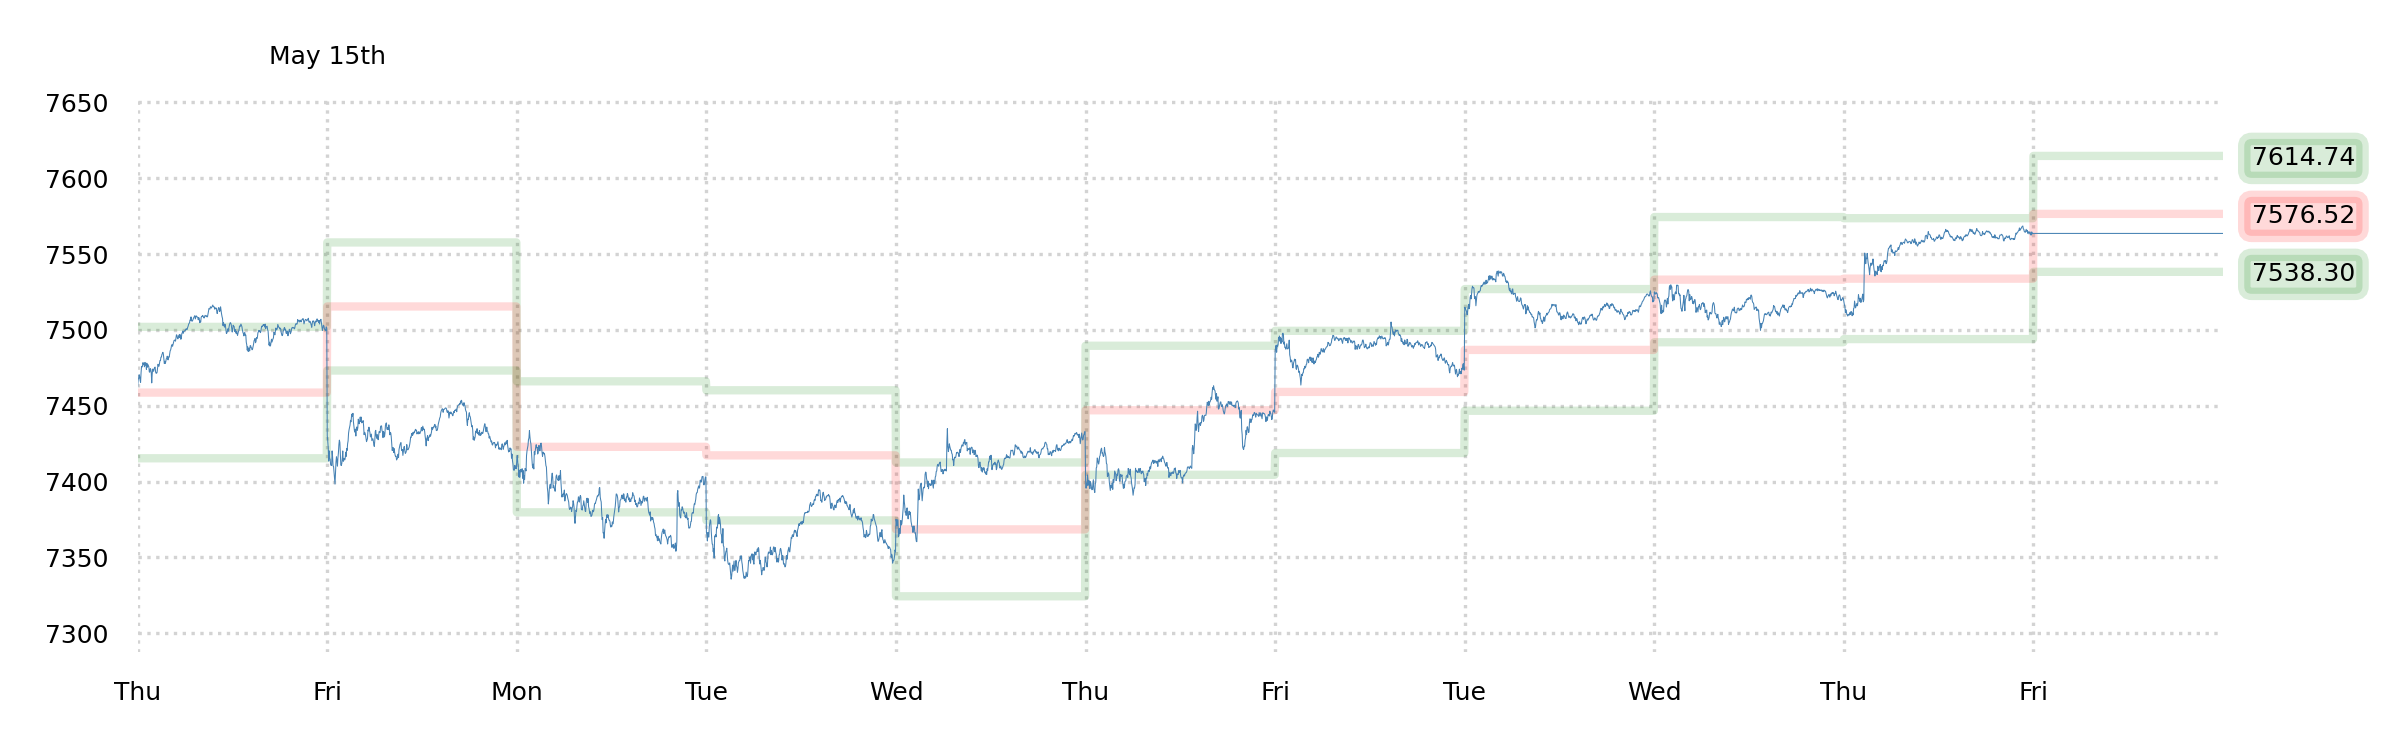
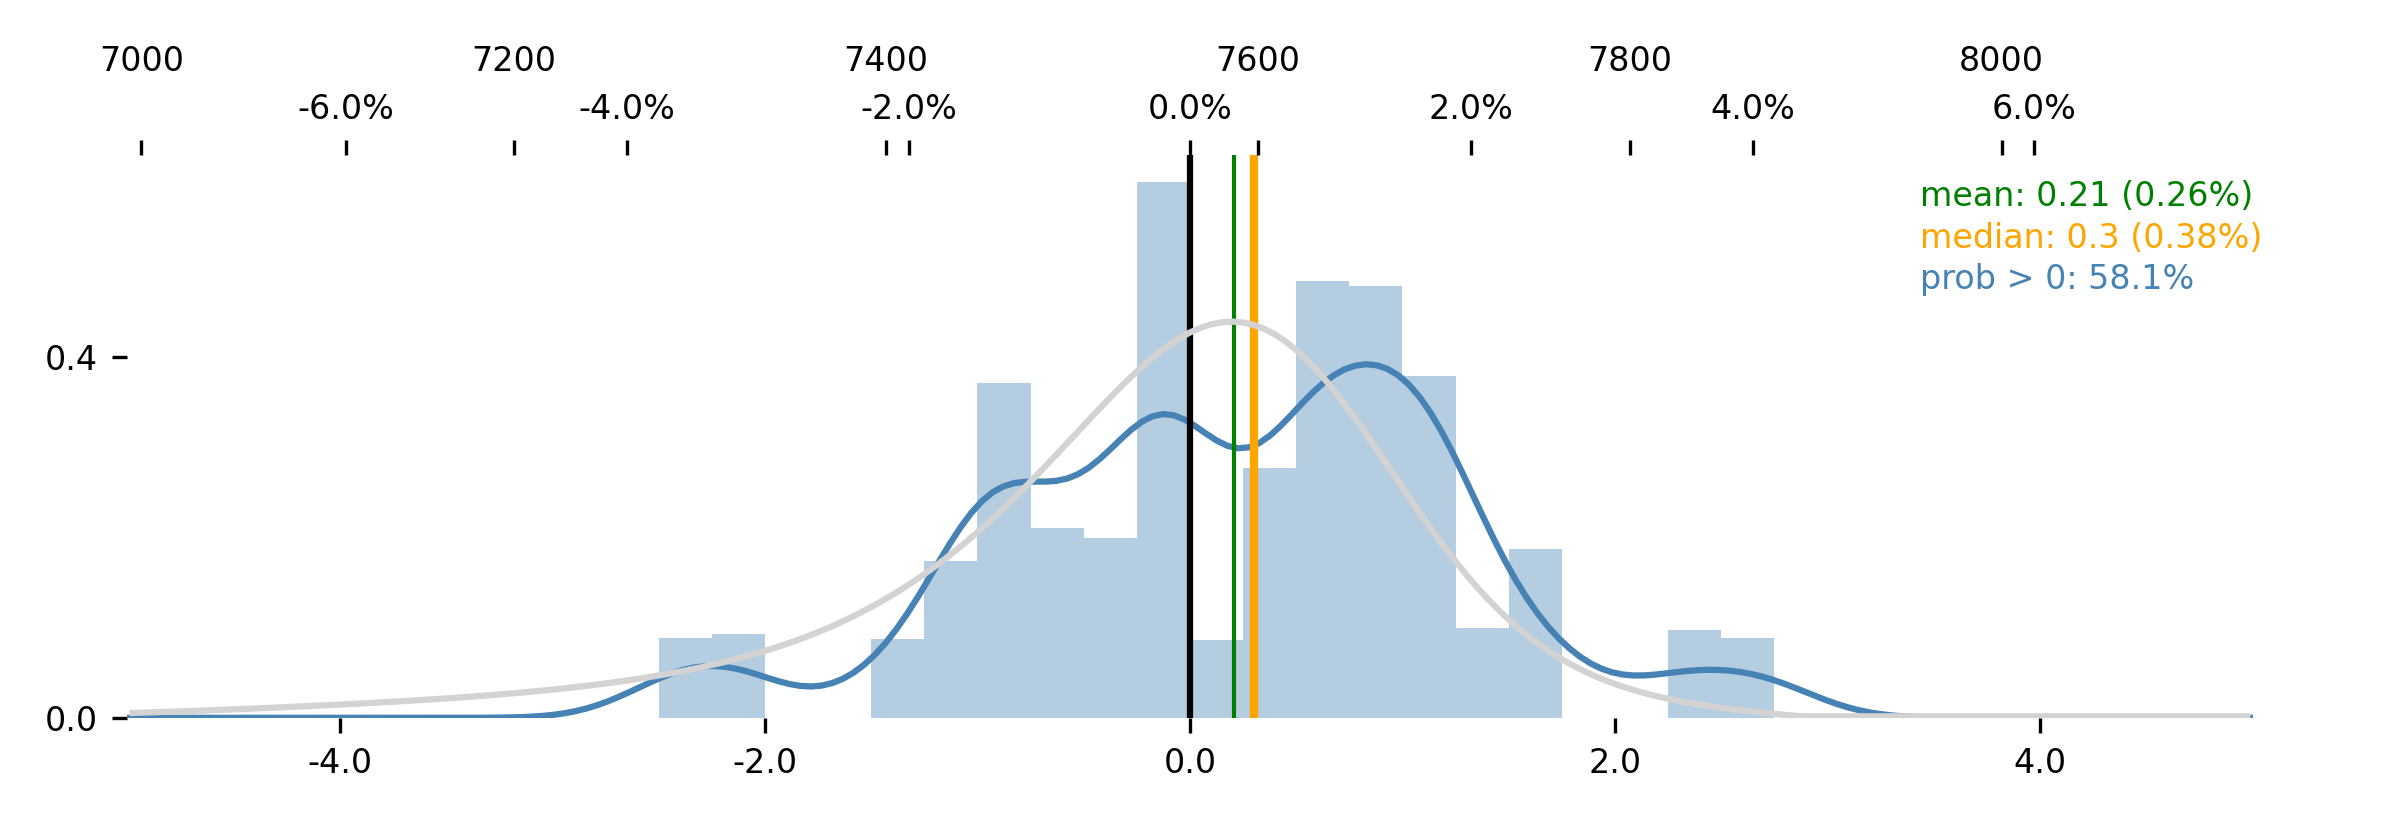
Jim's distribution was symmetrical, there was an uninterrupted intraday period where puts switched from being bought to sold, DIX had completed the journey from "very high" to "very low," the step-forward indicated that momentum was likely to the upside or downside, depending on which way the market went, index sitting at highs... etc. A lot of things aligning into an objectively more interesting picture.
Today, that interesting picture continues. Jim's distribution mostly matches the market's implied probabilities...
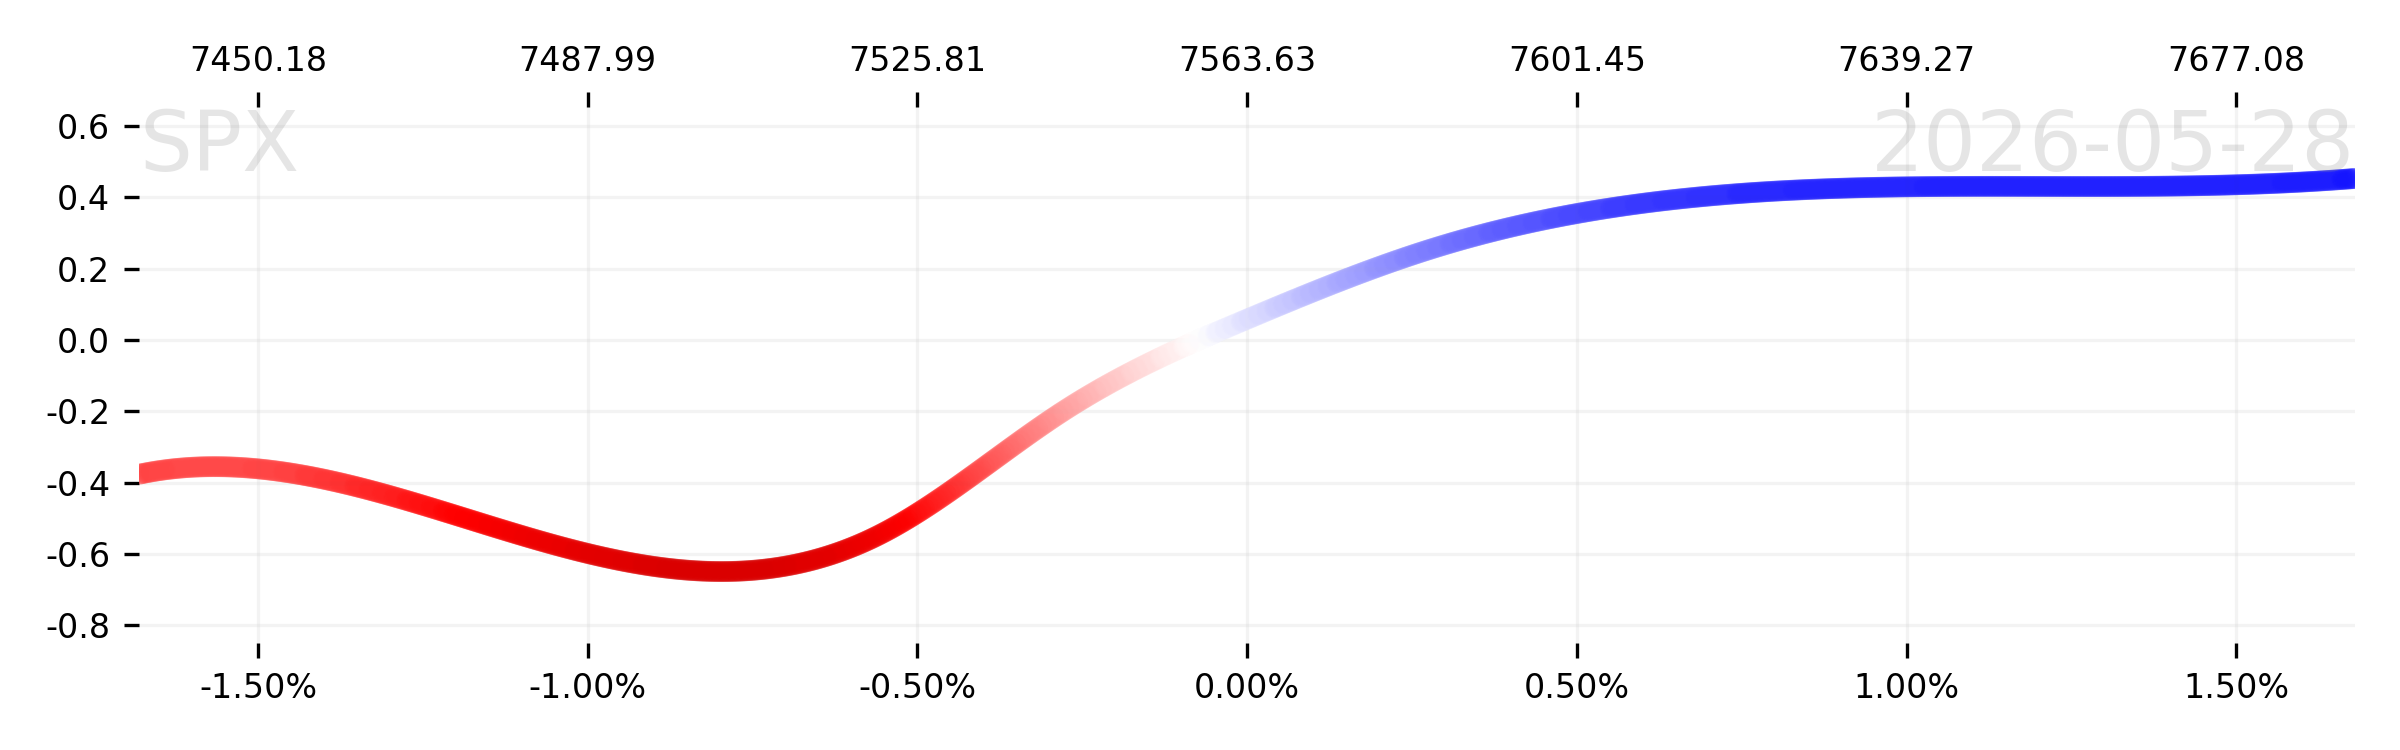
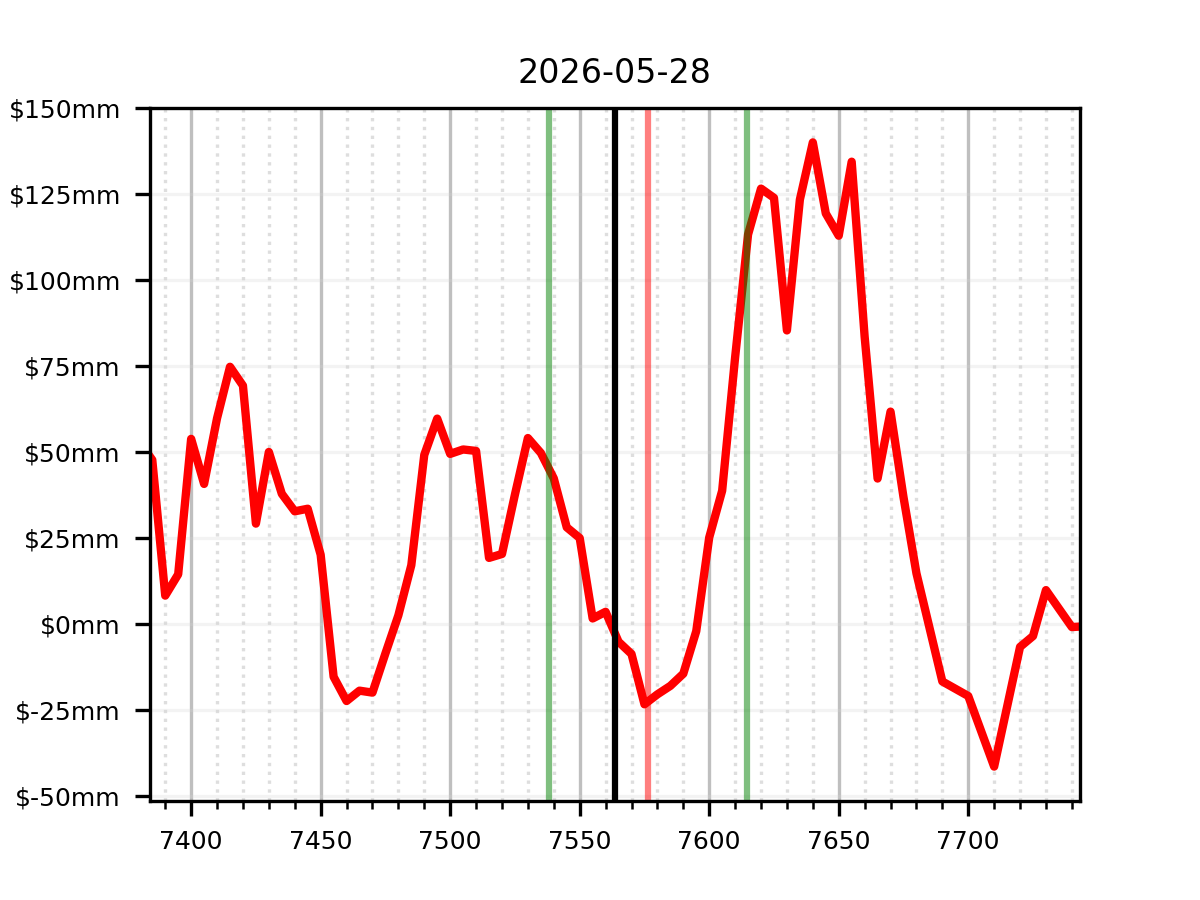
...the step-forward has a clean forecast shift lower as the index falls...
...and interestingly, there was a bunch of put-selling again yesterday, with NPD at +3.12 (highest since late March?).
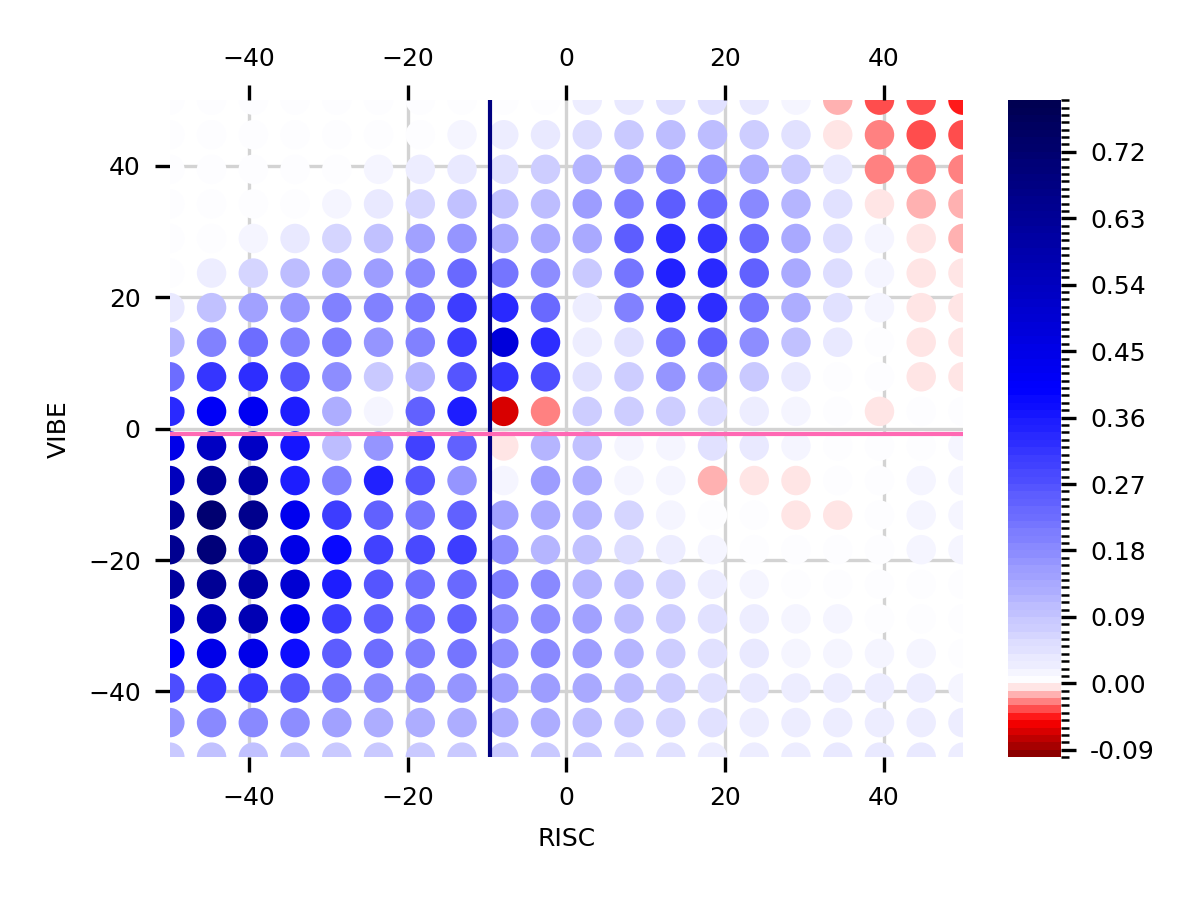
That put-selling bias seems to have had an immediate effect on vol, with VIX retreating to a 15 handle; and it brought the RISC-VIBE heatmap crosshair right into the Red Eye.
Yesterday, we raised the question:
The only other question is if and when to buy an OTM put. Which is something we'll think about.
And since we're gluttons for punishment, we're gonna do it. The focus will be on volga, so we're going far OTM. We want "vega convexity." A cheap punt on VIX rising five, ten, fifteen points.
Same pattern arises in 0DTE dealer re-hedging as we've been seeing all week.
Makes sense to bet on an intraday rally, but only above 7590.
Talk Sunday!
The SqueezeMetrics Team