All the charts and data we refer to can be found on the Yacht Club page.
Hey everyone,
Last week, we were hunting for GEX Prime, the "meta-GEX," the signal that seems like it must arise from a decade of GEX being a dominant force in the market. We didn't find it. So that was disappointing.
But we did find a decent signal, and we thought that maybe it could feature on a new "Dashboard" page. But after thinking about that a bit longer, we don't think that makes sense. So that's disappointing.
This past week, we've been thinking about dispersion. We've been thinking about dispersion because everyone and their mother is thinking about dispersion right now. We'll talk about this below. But it will probably be disappointing.
- Price-consoli-flation
- Defensive-flation
- Gamma-exposure-flation
Price-consoli-flation
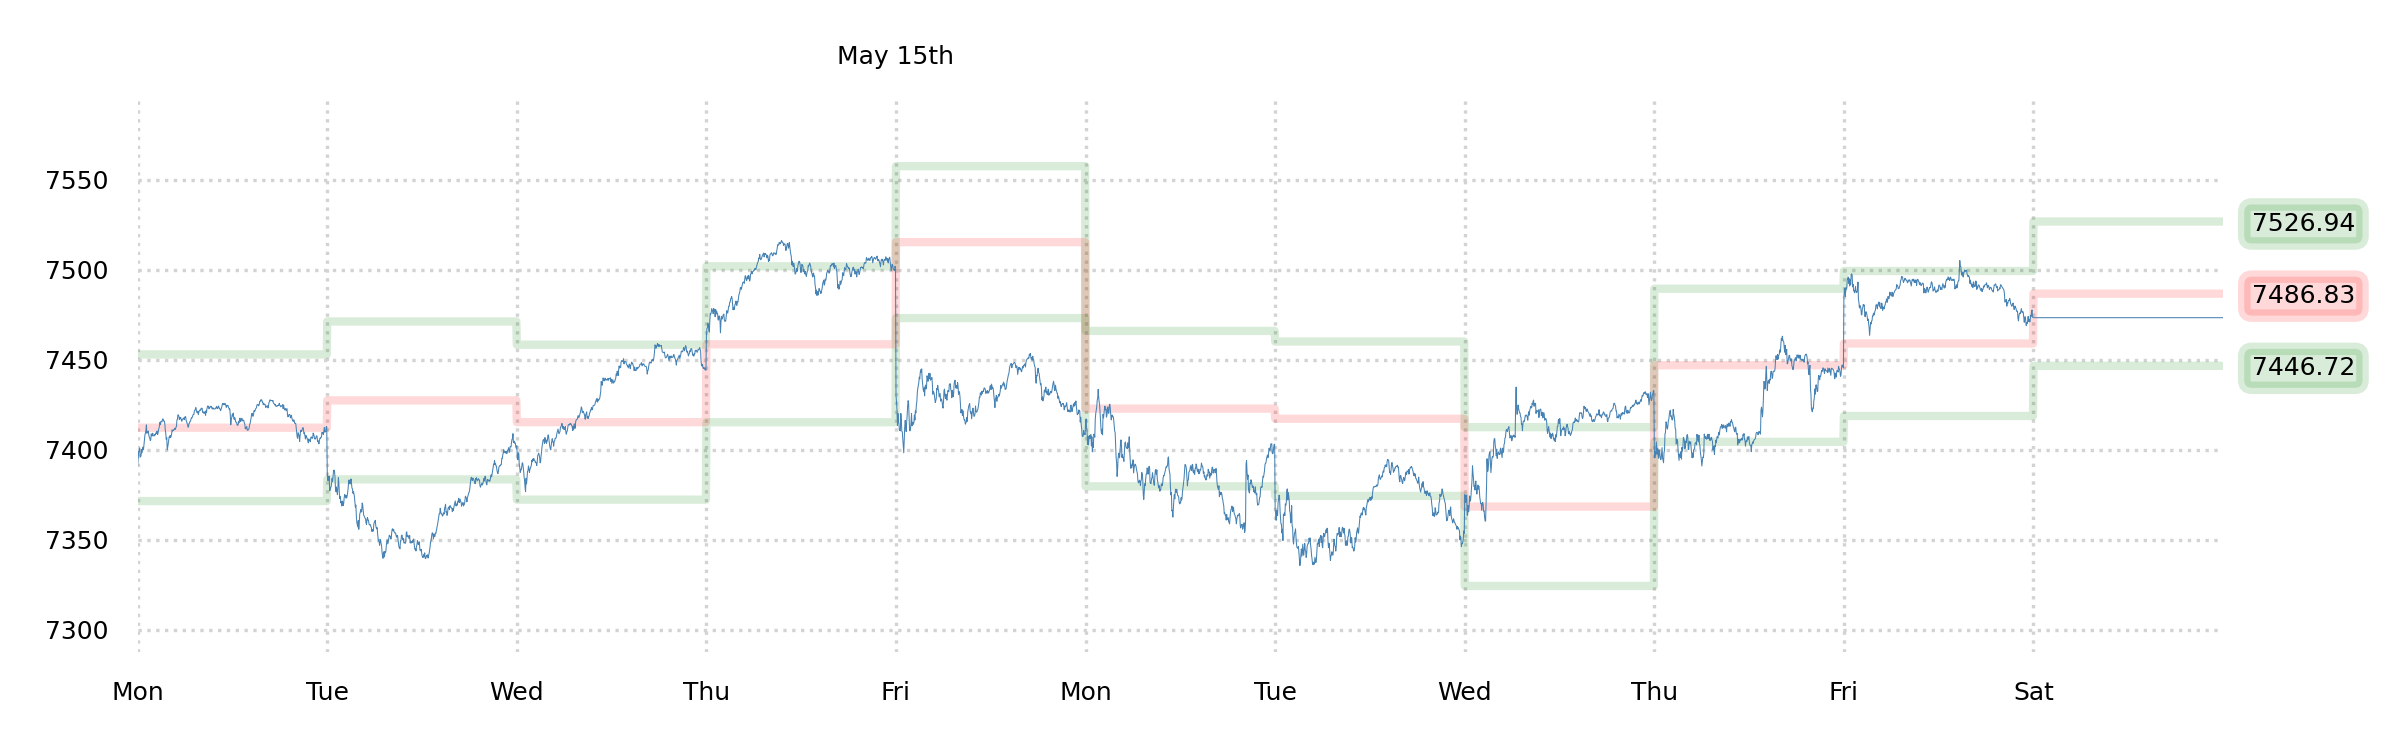
Whether you call it consolidation or stalling or something else depends entirely on your biases. The index is approximately flat on the week.
Before we set out, let's establish that our opinion of the "macro" situation hasn't changed a bit, and that this weird, suspended animation, whereby everyone papers over a gaping hole in the real economy with silicon wafers and their empty beep-boop promises—is stupid.
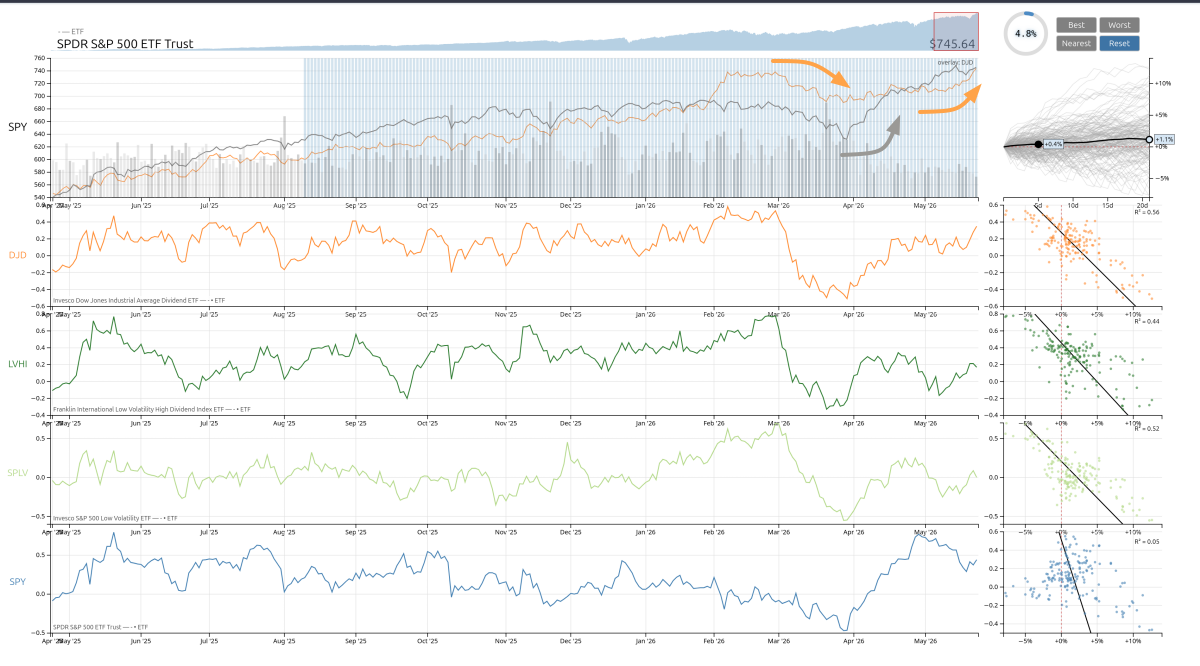
The week featured broadly weaker prints from DIX, suggesting a mellowing sentiment, and at the same time (relevant to our discussions last weekend), some catchup from the laggards. In particular, you can see the pattern whereby the "low-vol" and "high-dividend" stocks, which have been presaging S&P movement, move up before the index moves down. These are rates-adjacent dividend-payers, blue chips, "defensives," etc.
We're probably not yet in the bearish phase of this "catchup" process, but it reiterates the "neutral" outlook.
Defensive-flation
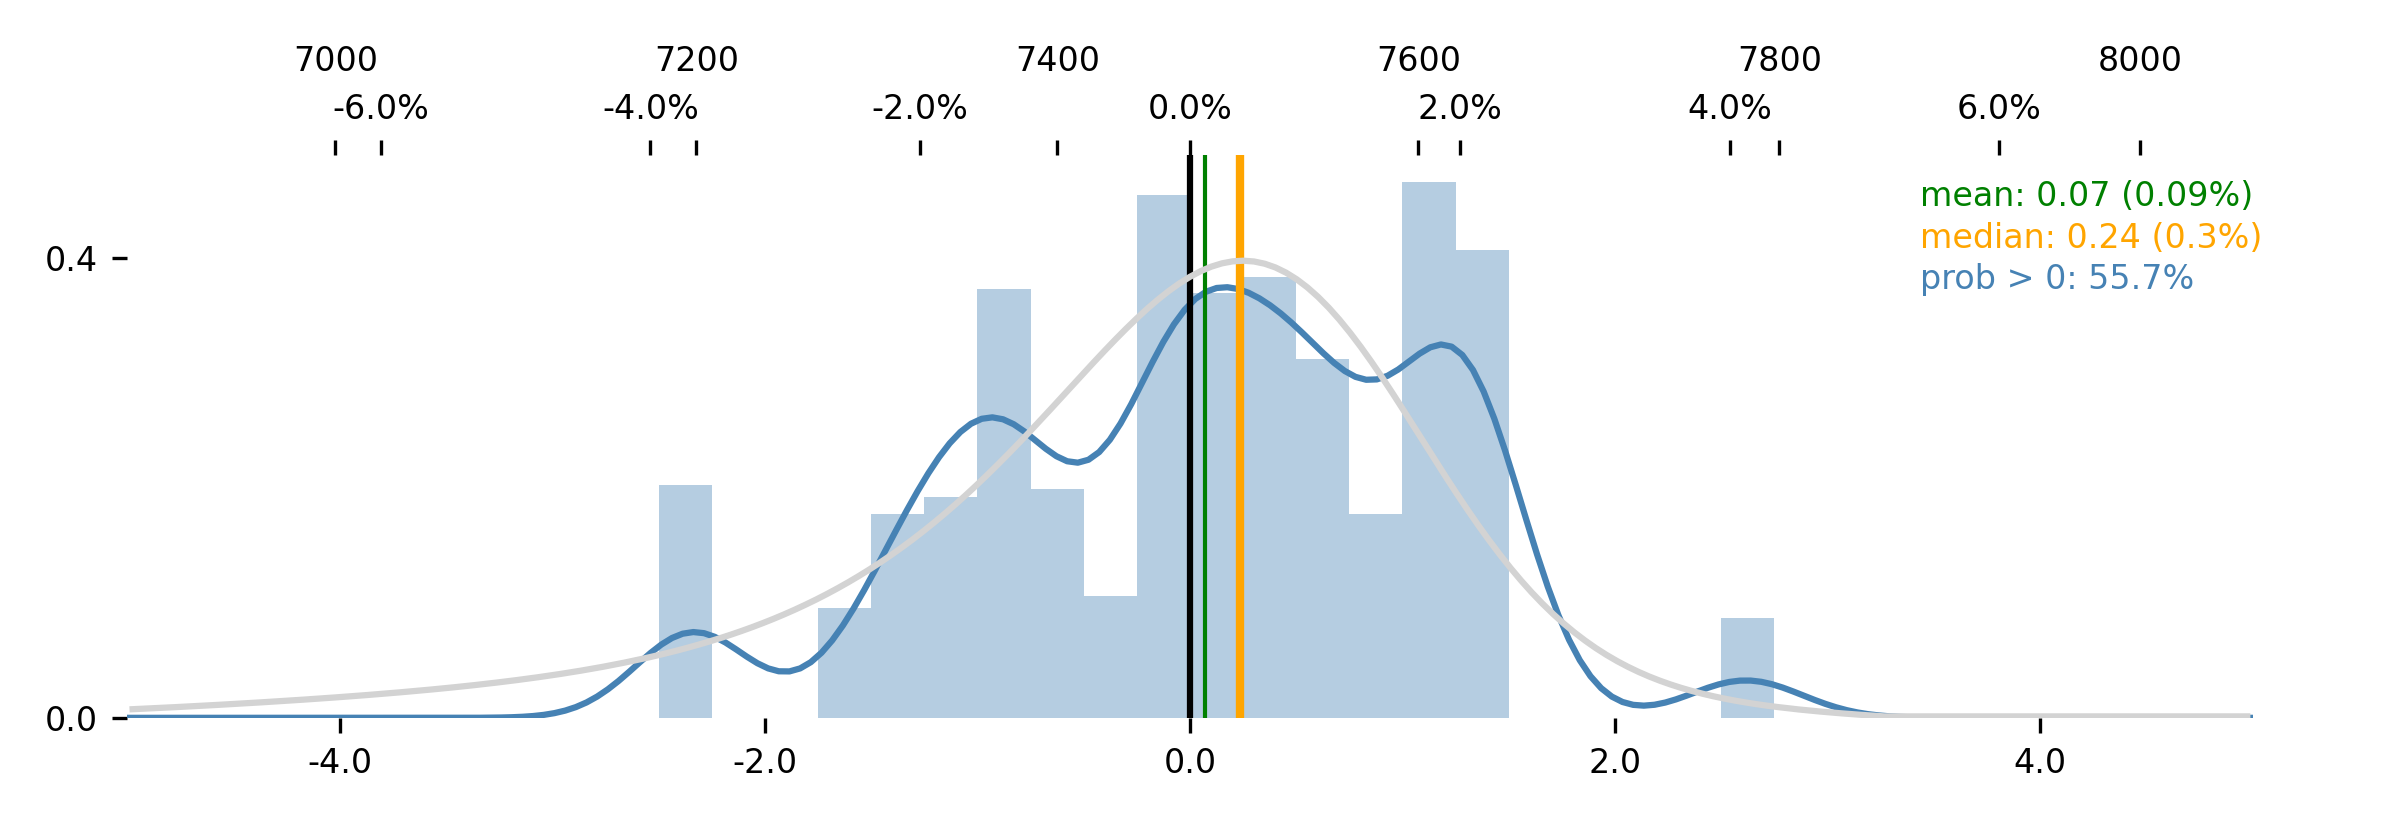
And so does Jim.
A probability of upside of 55.7%. A mean of +0.09% for the week.
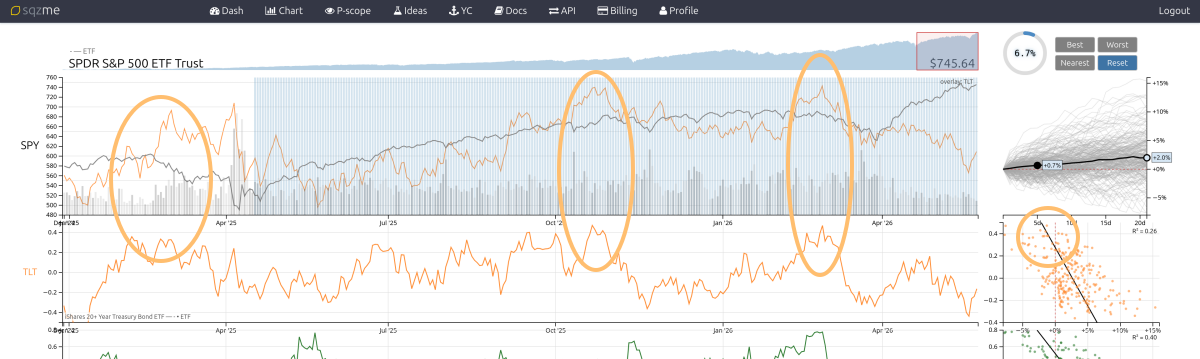
The pattern that we noted above about how boring, low-volatility stocks' gains predict [modest] SPX losses is certainly something that you can read partly into "rates," even if the signal in Treasuries is a bit messier.
(It's still very clear over the last year.)
You can't glean anything bearish from this bond setup at the present moment. TLT
has been selling off, which has been a good thing for stocks. One would assume that this is an inflation-linked phenomenon in the current environment, and that this would be the "reason" for the subsequent bid in stocks. But then if you believe that, you'd probably want to affirm it by looking at inflation breakevens, and then if you do that, you realize that the 10-year breakeven inflation
rate fell by 10bps as bonds were selling this past week. So this last bout of bond selling was ostensibly
not about inflation.
Hmm.
And then, if you're smart, you stop trying to explain what's going on and you just learn to trust Robot Jim.
We are neutral. We will look for more intraday E-mini trades to take (Friday's went well!), and we await eagerly any kind of long-vol signal.
Gamma-exposure-flation
Recap:
Our hunt for the abstraction of GEX did not yield fruit thus far. Our first stab at the idea was to search for evidence of "delta-fudging" in high-option-volume single-name stocks by looking at stretched correlations and whether they had an impact on the index. The theory was that, e.g., a dealer is usually net long a call on SPX (long delta) and frequently net short a call on TSLA (short delta), and would use the correlation between the two to "fudge" the expensive delta-hedge in TSLA stock, and accept some risk to do so.
We found no evidence of that risk, and we ended up going down a [sort of interesting] rabbit hole about how small-caps outperform after boring defensive stuff underperforms. This got us thinking about how it'd be cool to have a birds-eye view of what sorts of things are "driving" different indices or sectors at any given time—but then we realized that this is exactly what the P-scope does, particularly if you use the "context plot" at the top to scroll through different time periods and watch the scatterplots and regression lines change. So, for instance, right now, the major indices are moving strongly opposite to "low-vol" and "high-dividend" baskets, which are strongly rates-adjacent. Basically, it's TLT down, then SPY up; and vice versa. One day, this will change, and we'll be able to watch it as it changes. Because we have the P-scope. Which is already really good at this.
So that has dashed our hopes of making this idea into a new Dashboard. "What's driving the index" is a cool question, but it's mostly one we've already found the answer to, methodologically.
Now, since we are slaves to whatever is in vogue, we started thinking, instead, about whether some sort of "dispersion" panel could feature on a Dashboard, but over the course of several days, we ran into three broad objections:
- It matters a great deal exactly how dispersion is traded in order to assert why, or how, it might matter at all. We're assuming that "dispersion trading" means "getting linear long-vol via straddles (ideally, volswaps, but you're not gonna be able to do that) and then re-striking or hedging in such as way as to optimize costs versus path," which inevitably leads one into holding deltas or hedging constantly, particularly if the intention is to be exposed to "realized" vol. This is not even "easy" for volatility pros. And after a few discussions with practitioners, "dispersion trading" seems mostly executed very deliberately, against carefully chosen single-names, rather than against large baskets. Not a big-picture thing at all.
- Folks deliberately "trading dispersion" aren't going to be the reason for real observed market "dispersion" anyway (semiconductor stocks aren't going up because of sophisticated vol pod bros, but semiconductor stock going up is the reason that "dispersion" indices are wacky right now), so what does this even mean? "Dispersion trading" actually seems like it has very little to do with "dispersion" as commonly measured, in that making relative vol trades based on a "dispersion" index isn't really something that's happening.
- Lastly, the contention that there are banks packaging up exotics to sell long dispersion to customers seems overstated. It's a thing, yeah, but it doesn't "matter" in the grand scheme of index flows at all. It's kind of like how the variance swap market was a "big deal" primarily to those people who traded in it, and nobody else.
So that mostly turned us off from thinking about "dispersion" as a reflexive, causal, trade-and-signal.
And now, after all that, we're staring down a new week, and we're trying to synthesize all of this. There's something about correlations that we feel like we haven't nailed down, and that nobody else has, either, but that must be able to explain our intuition about meta-GEX.
...
Could it be that "GEX Prime" is actually more about correlations per se? Like, think about it from the book level: As a dealer in the index, you're generally being given short skew to the downside and long skew to the upside. And thereby short convexity to the downside; long convexity to the upside. And incidentally, short correlation to the downside; long correlation to the upside.
The big play for the dealer, then, would be to invert the whole thing, all the received index exposure, in single-name space. To accumulate a broad variety of long downside convexity and short upside convexity in single-names.
This must be happening. It cannot not be happening. It is of the utmost importance that this be happening.
Problematically, we're not quite sure how to prove it. You could argue that if index realized skew is getting to be [relatively] lower than implied skew, that could tell you something, but this seems like it would only be an interim step in the process (a profitable one for the dealer, perhaps, but something that would necessarily self-correct over time). Similarly, actually looking at relative movements in single-names or sectors is secondary to the actual effect, and could easily confound (the reason for uncorrelated sectors in a high-GEX environment was always that the dealers' tightening the E-mini book caused sectors to "rotate," not vice versa).
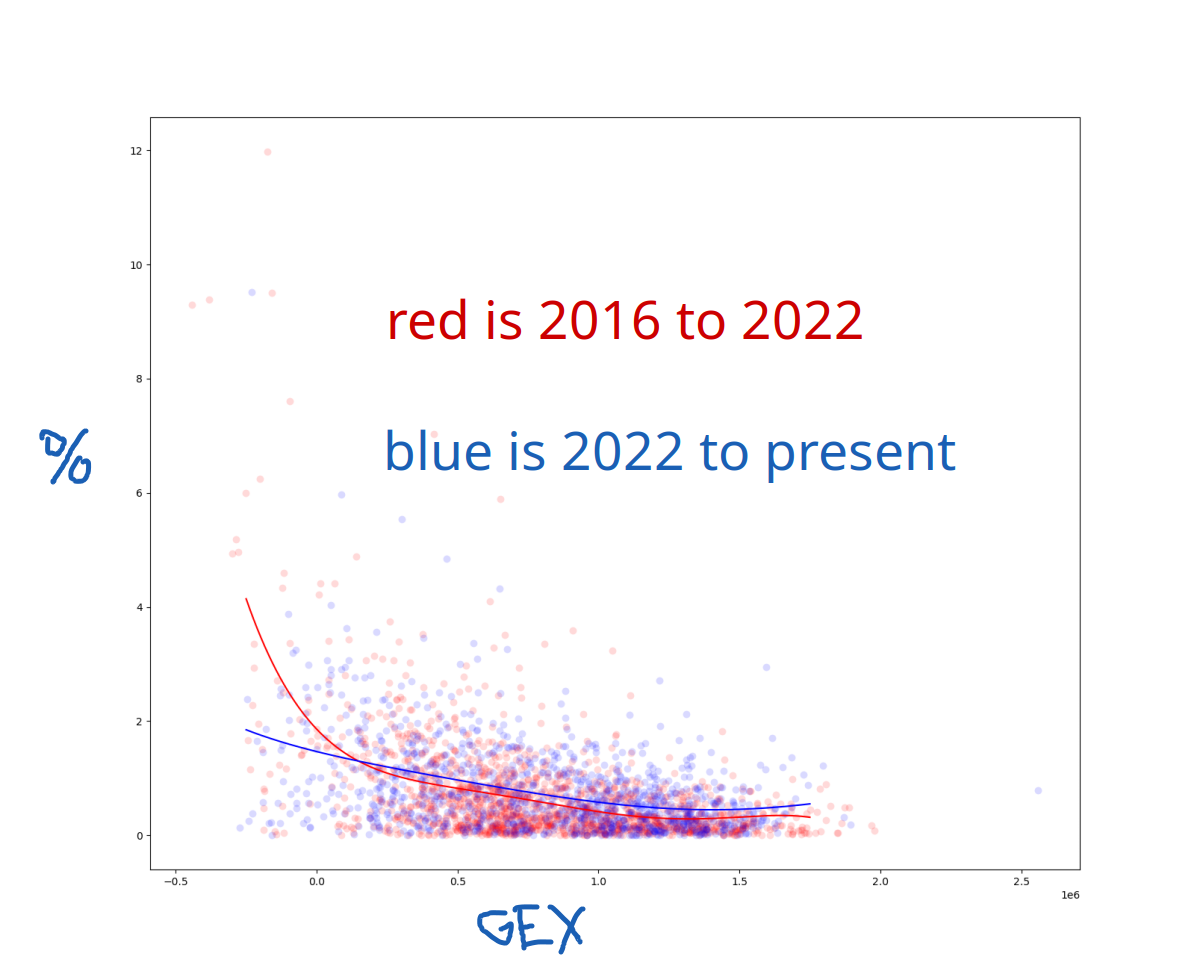
Perhaps the best [first] question to ask to find out if GEX is being displaced by "meta-GEX" is simple. Is GEX(+) getting worse at predicting incremental differences in realized volatility?
Because if so, that would suggest that some delta-hedging, at the index level, is being neglected.
Naturally, we started this inquiry by lazily looking at the interactive
SPX Chart, and selecting older versus newer data, and seeing how that changed the GEX+ (G) scatterplot.
But we thought we should validate by actually plotting something with the GEX+ spreadsheet and some polynomials.
The year 2022 was chosen because of vibes. It felt like centralized option dealers were really starting to dominate by then.
The plot seems to validate our suspicion. The 1-day percent changes (y) are higher for low GEXes and lower for high GEXes in 2016 to 2022. The whole relationship gets flatter post-2022.
Those options were still bought and sold. We're still tracking the directions of the trades, and following option open interest through its whole lifecycle, and inferring dealer positioning. Meanwhile, the 0DTE data still shows us incredibly useful stuff, based on the same method. So it's all still quite valid. And yet, the market impact of the replication of those options seems diminished.
Could this be because those delta-hedges are no longer being made?
Could this be because dealers have started neutralizing their index exposures, broadly, in single-names?
Yeah. Could be.
Now what?
...
Enjoy the week!
The SqueezeMetrics Team