All the charts and data we refer to can be found on the Yacht Club page.
Hey everyone,
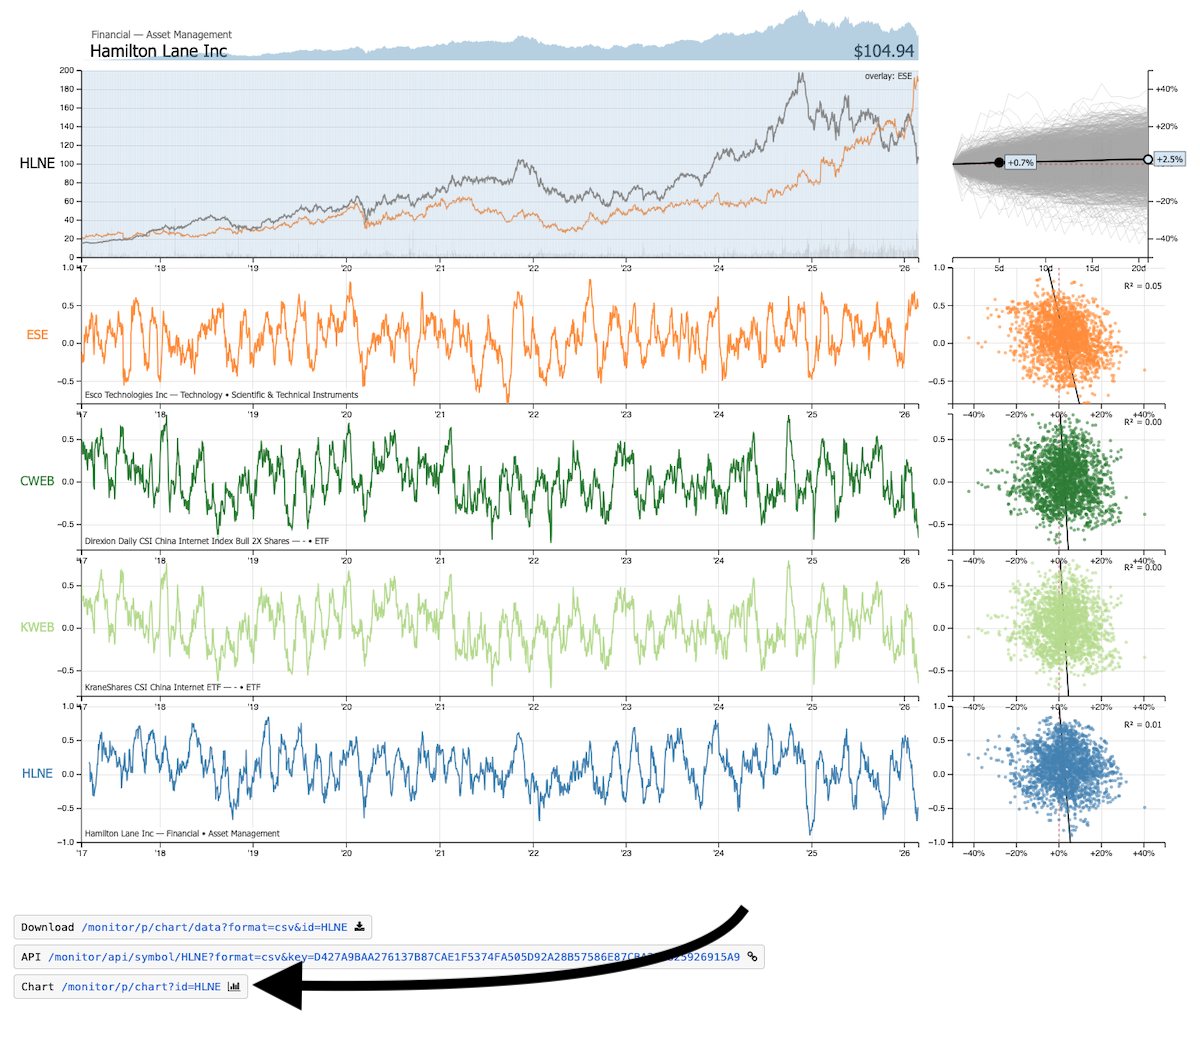
A housekeeping note: There's a new link on the Chart (and P-scope) page, which will take you to the selected ticker's P-scope (or Chart) page—which means that you can flip more easily between the two. Which is something we found ourselves doing a lot.
It's way down at the bottom on the page.
It makes it much more pleasant to find trades that have "agreement" between the "internal" stock data (Chart) and its "external" predictive correlations (P-scope).
(Like with
HLNE, which we mentioned
last weekend, and which [still] has favorable Chart
and P-scope data.)
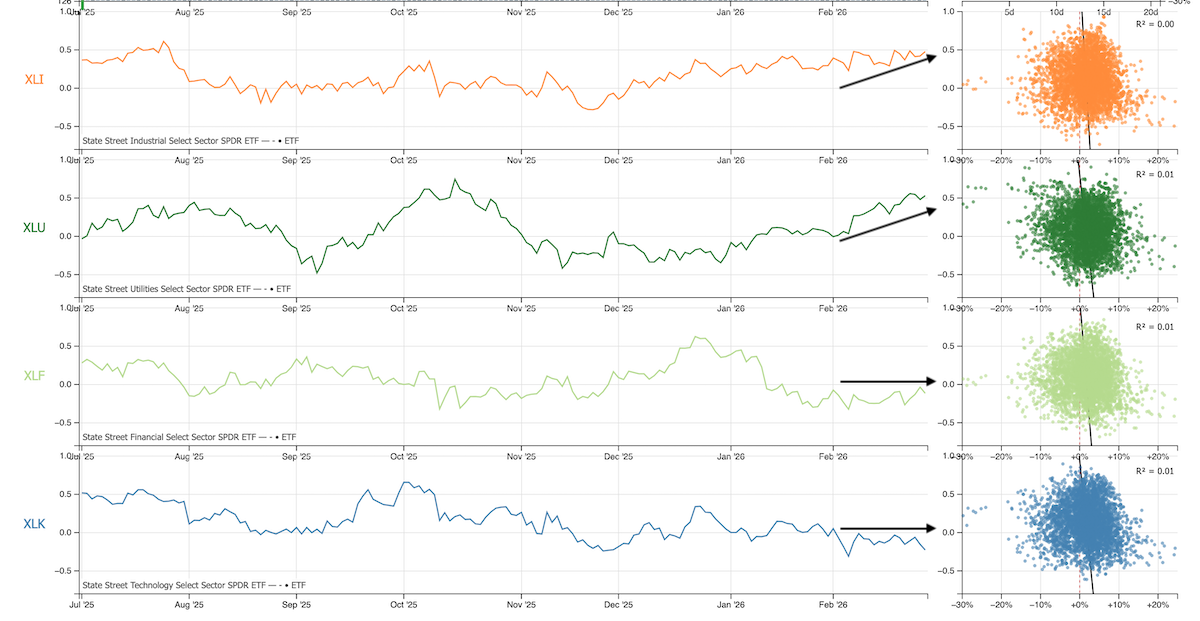
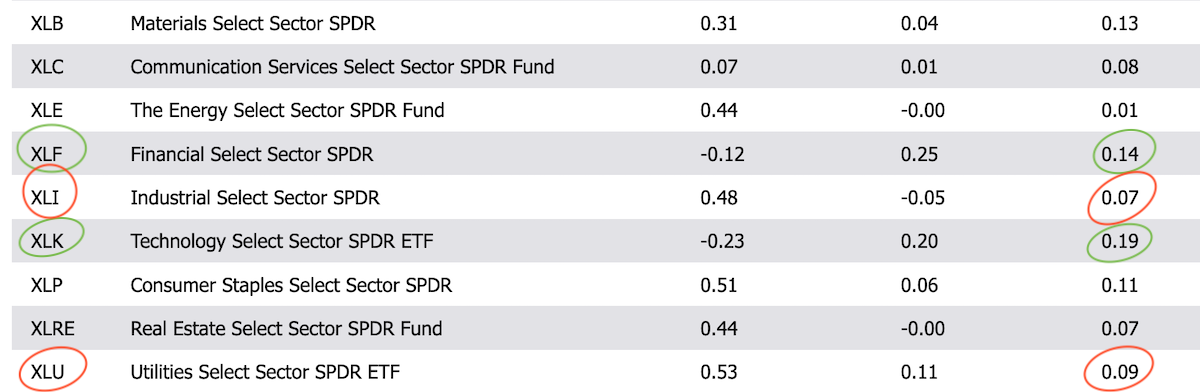
Speaking of which, the divergence between several S&P sectors is pretty interesting right now. Industrials and Utilities have been obviously outperforming, while Financials and Technology lag.
And interestingly, this comes through in the P_NN forecasts, which predict greater returns on XLF and XLK over the next month, and worse returns on XLI and XLU. Historically, this stuff apparently tends to "converge" again.
Do you want to look at what tickers predictively correlate to each of these, and try to poke around at all the interrelationships? Yes you do, because that's how you figure things out. And it helps to be able to flip back and forth between Chart and P-scope.
So we hope this speeds up your single-name research workflow, dear reader.
Now, let's talk about war.
But first...
- Gamma
- Gamma and bombs
- Gamma and bombs and dollars
Gamma
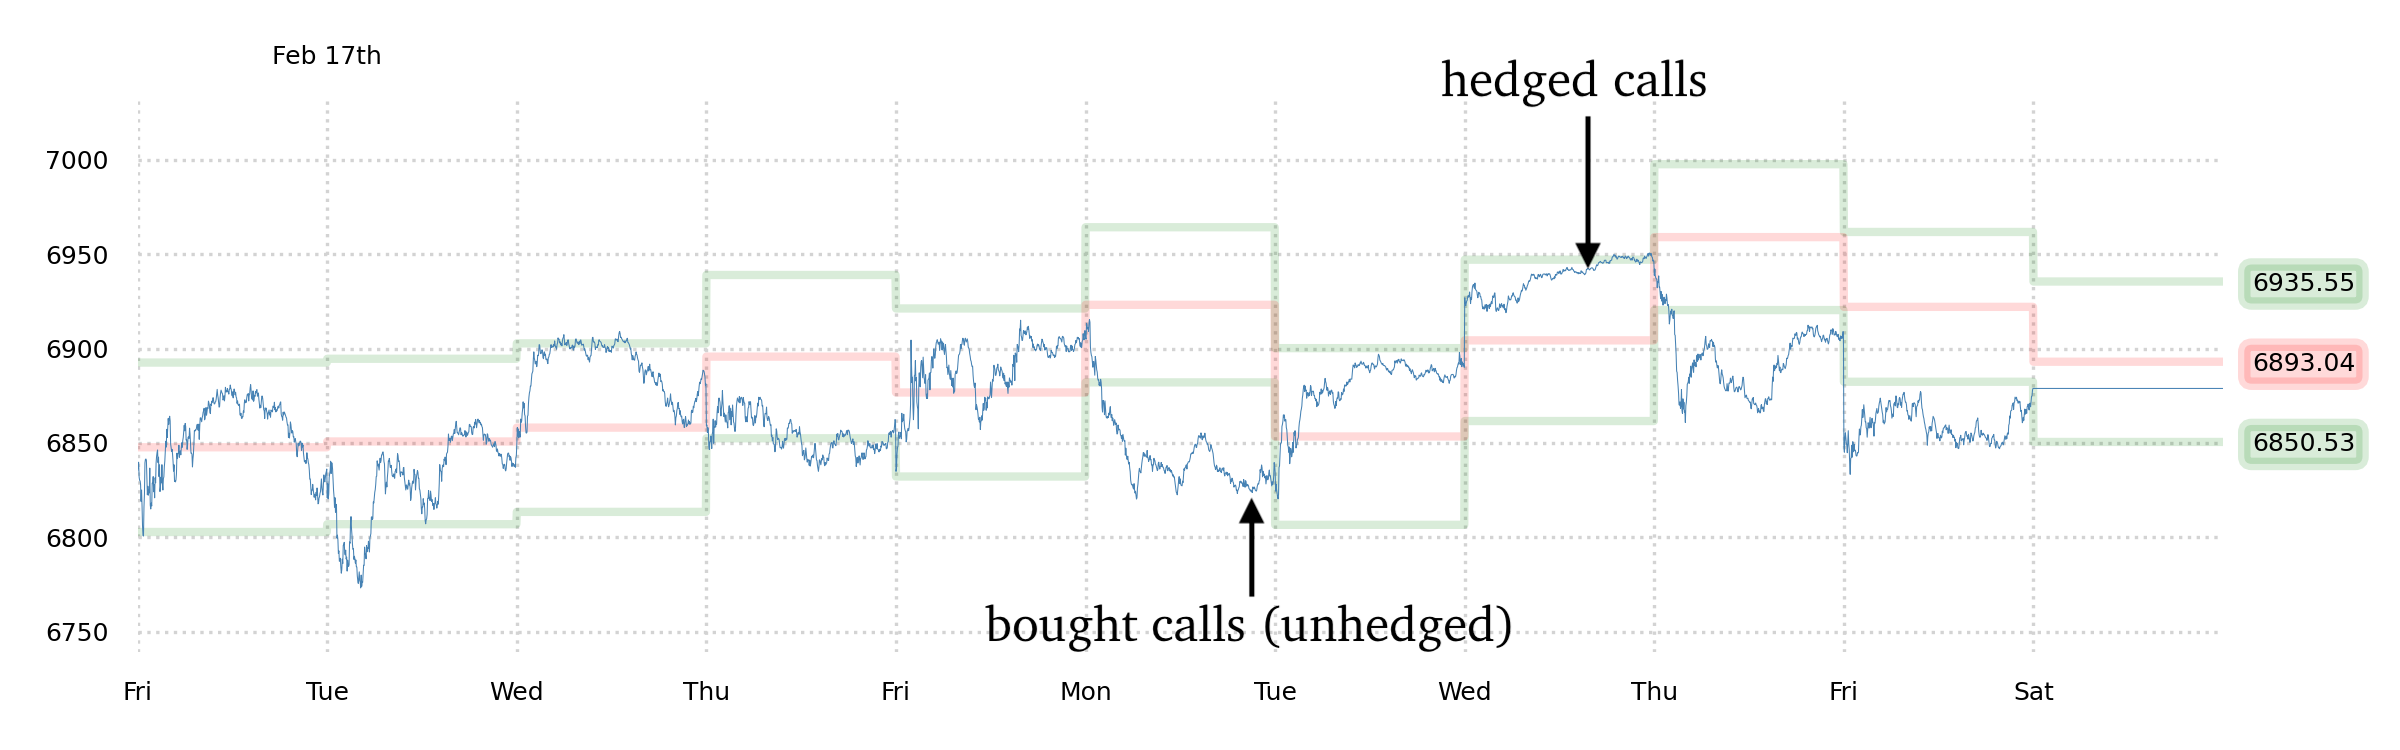
The idea this past week was that we wanted to be long gamma, but hedging our deltas only at the "right time."
The "right time" was a function of what Robot Jim and the 0DTE data were telling us—and it turned out really nicely, as we only made one hedge, and it was indeed well-timed.
However, this means that we're currently long gamma with a delta-hedge having been made way up at 6940. So we will only make money if Monday moves lower and we're able to re-hedge, scalping that gamma.
Will we be able to manage that? A lot has happened this weekend, so we're not quite sure where Monday goes... but we'll wait patiently.
Gamma and bombs
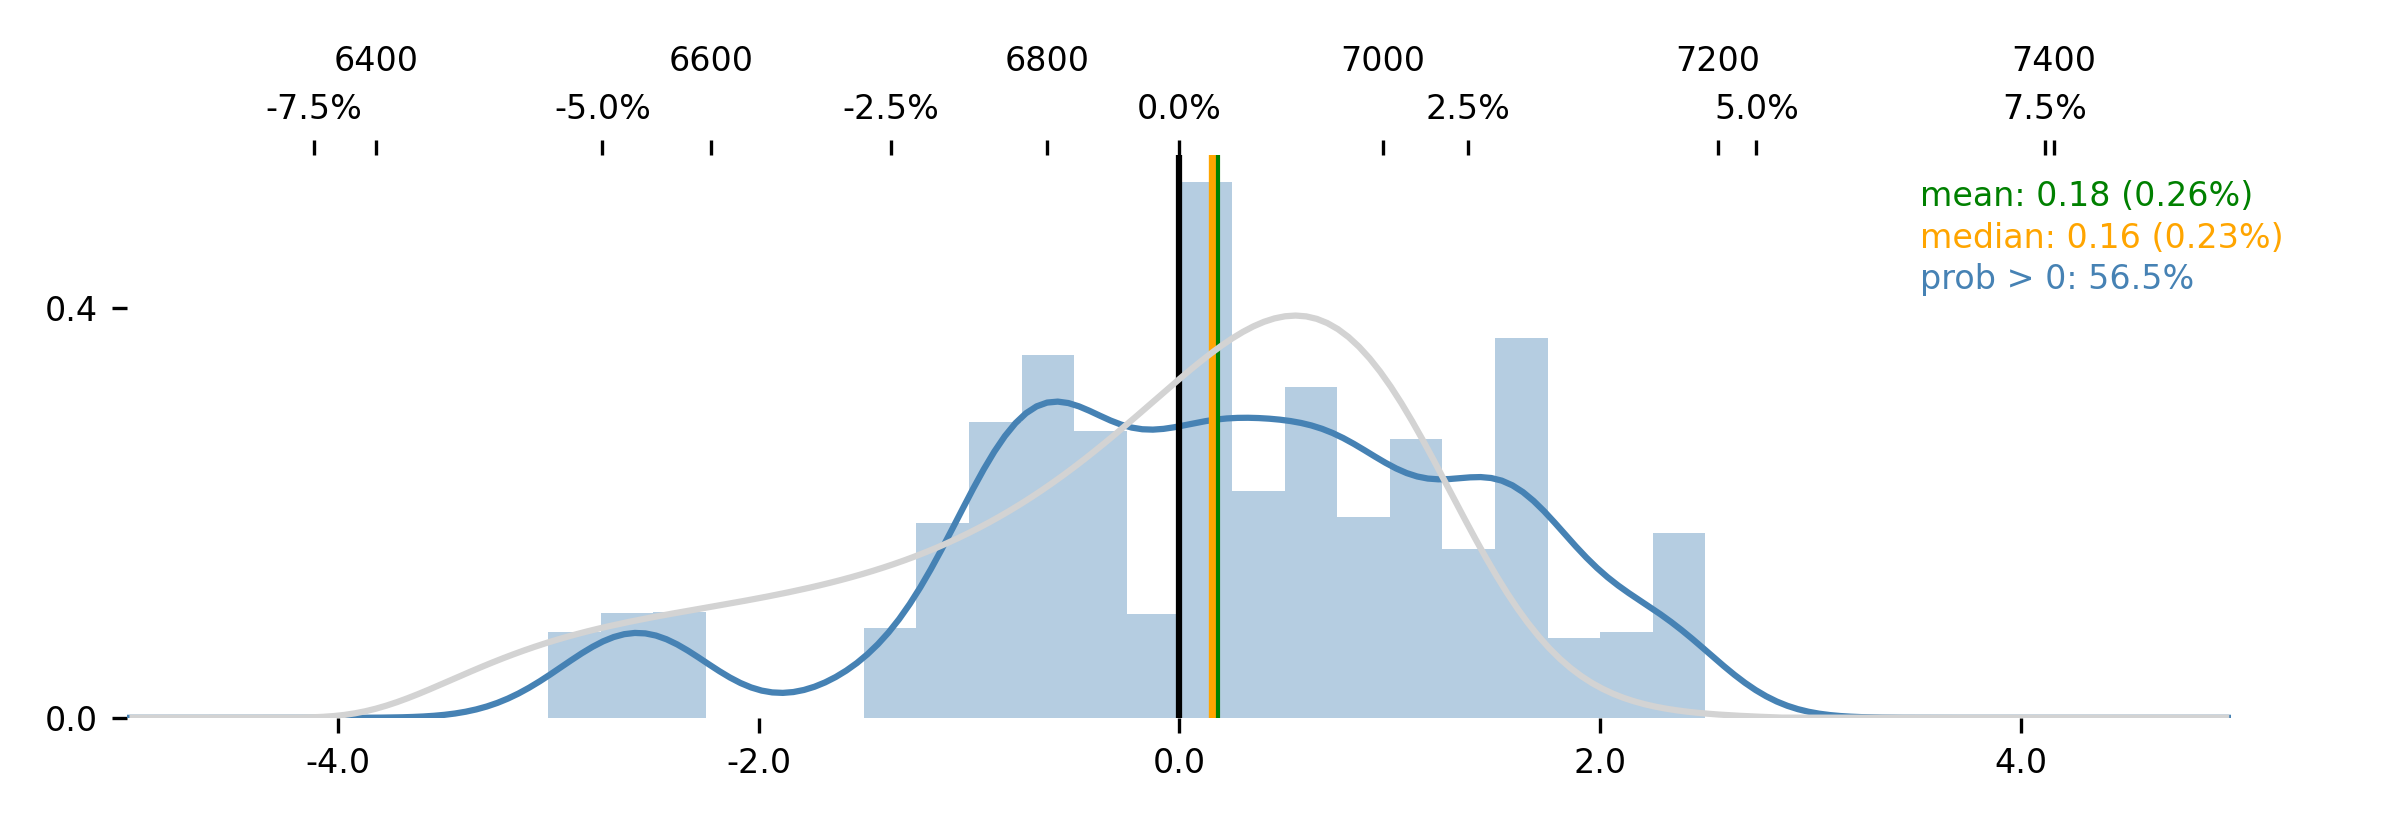
Jim's distribution is at once slightly unusual (odd shape) and yet fairly uninteresting. The underpriced probabilities are allegedly a +2.0 MAD week (2.50%+) or a modest dip to 6800. This is still, strictly speaking, a "long gamma opportunity," but it's not terribly exciting.
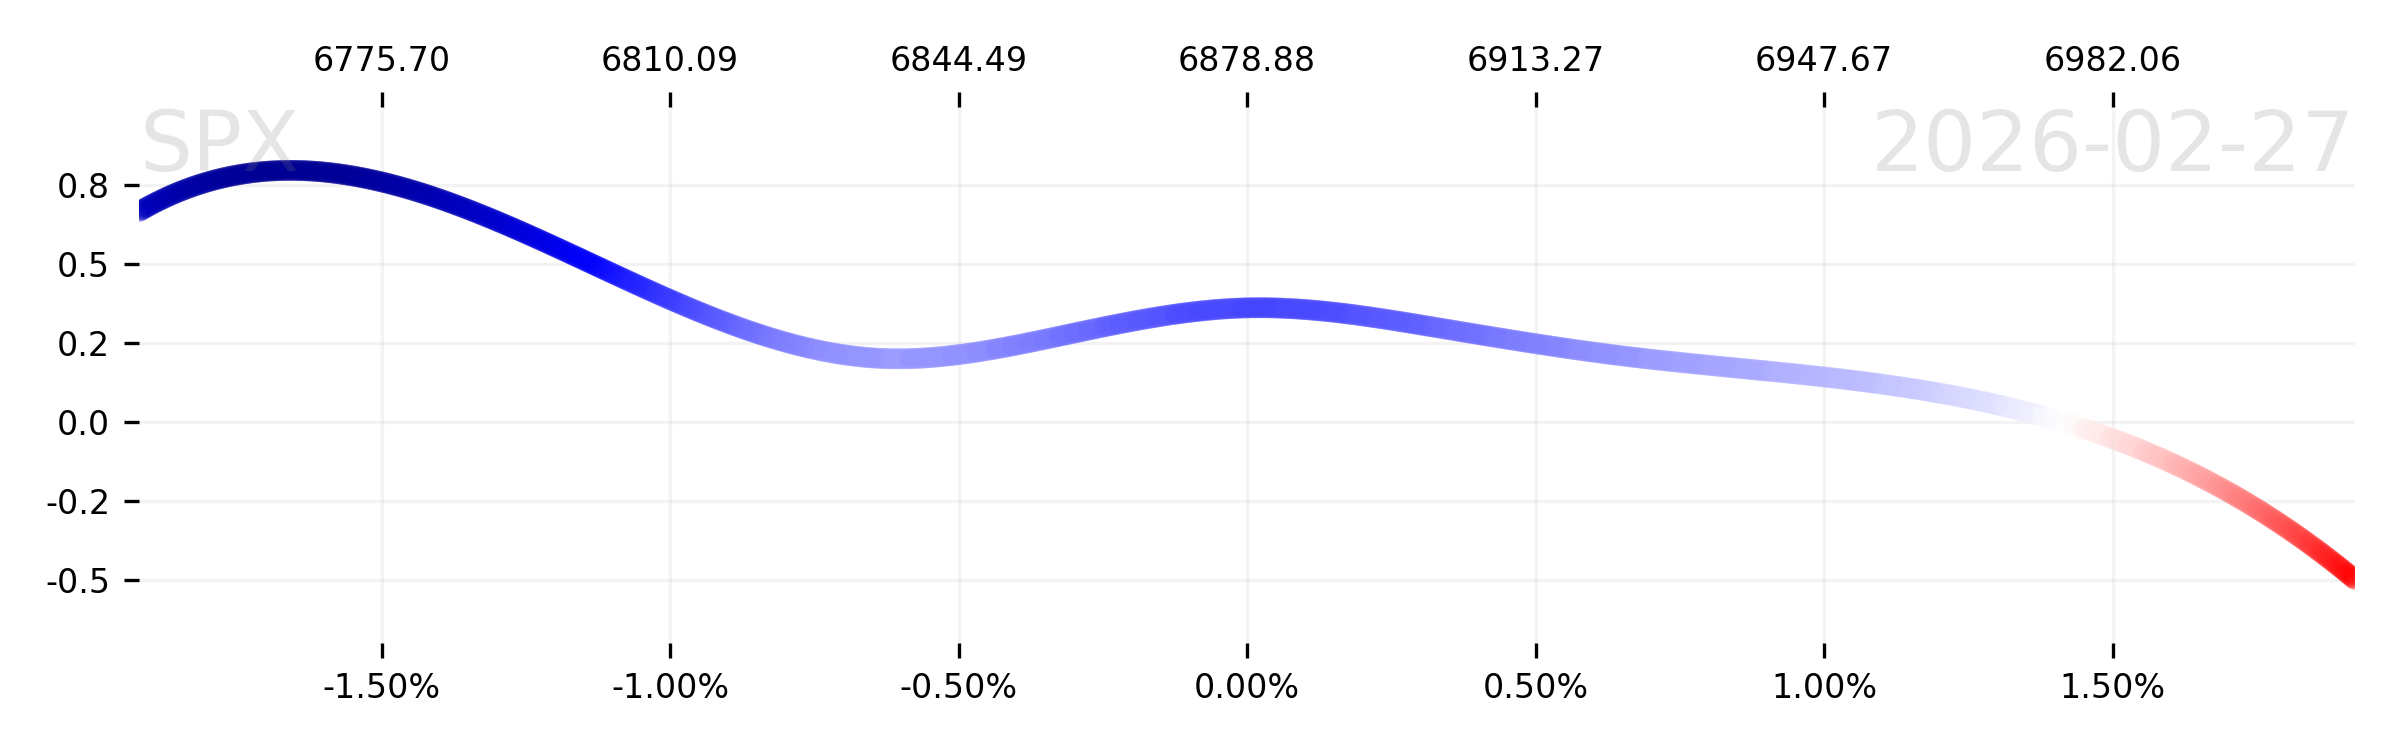
Perhaps more information is to be gleaned from the step-forward, which tells a more coherent story.
This is a modestly bullish situation with a mean-reverting tendency. If we manage to see a 1.50% SPX loss on Monday, you'd probably want to buy it; if we manage a 1.50% SPX gain on Monday, you'd probably want to sell it.
Where does this intersect with "current events?" Well—actually it matches pretty nicely. Generally speaking, markets "buy (sell) the rumor and sell (buy) the news," and we've all been waiting very patiently for an event to transpire in Iran. As long as the worst outcome isn't realized, the market will generally react favorably to that—and nothing resembling a "worst outcome" has materialized (yet).
So for the time being, you should expect some generally bullish vibes, but guardedly so. A rally would sensibly be sold. A dip would sensibly be bought.
Gamma and bombs and dollars
Where these current events get more interesting is that war always has a tangible effect on currencies, and if we were to extrapolate this historical artifact (which tracks through millennia), we would expect two subsequent <1-week regime changes at the whim of the seat of Imperial World Power to have a positive effect on the global currency that financed it.
And although we're not long dollars
per se (we're long bonds, if you recall our macro
prattle from two weeks ago), there's been a lot of dollar-hate in the market lately, which is reflected in positioning, and which may lend itself to a familiar bet.
A few month ago, we
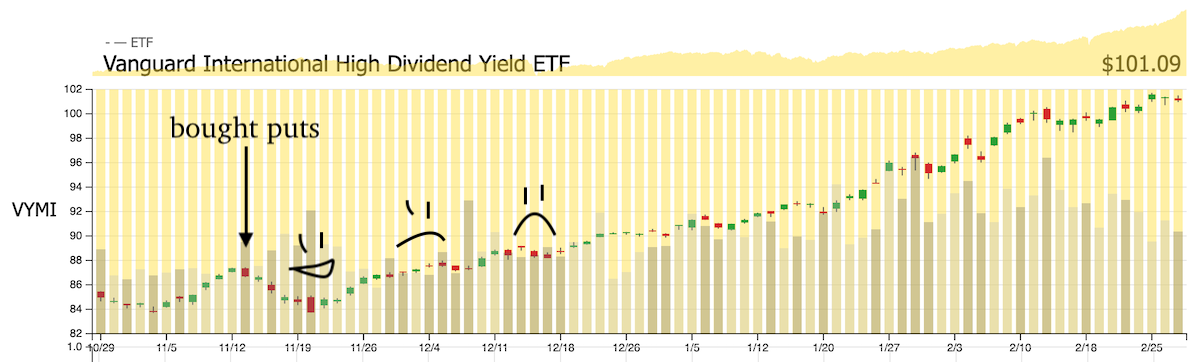
bought puts on VYMI—the Vanguard International High Dividend Yield ETF. You can see on the chart (sad faces) where our puts were vaporized.
This was no great disappointment, as we'd bought OTM, expecting some 20% chance of a payout and letting the chips fall as they may.
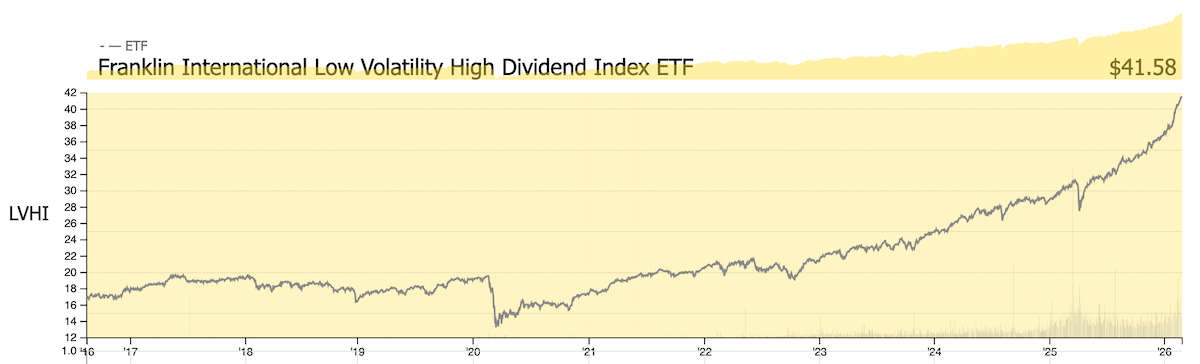
However, while exploring the deep recesses of the P-scope (particularly with regard to the sector ETFs mentioned earlier), we noted that both the XLF (S&P Financials) and XLI (S&P Industrials) ETFs currently have a strong, durable relationship with the Franklin International Low Volatility High Dividend Index ETF (
LVHI).
The only reason for something like this to crop up as an influence is if it's... influential. And it's quite clear that these ETFs are victims of strong, one-sided inflows right now. They're a big deal. This trade is a big deal.
This ETF, in particular, is a lovely three-headed beast:
- Implicitly short dollar (long international non-USD cash flows)
- Implicitly short Treasuries (long dividends)
- Implicitly short vol (long low historical volatility assets)
Each of these is a tenuous position in its own right, and looking at that parabolic chart there, we think it makes sense to take the other side of the bet. "Short vol?" Trouble. "Yield-seeking?" Uh-oh. "Short USD?" Hmm.
In particular, it seems quite possible that the U.S. acquits itself admirably in Iran, and that there's more reason than ever to own the Emperor's coin. Indeed, all of this currency stuff featured prominently in our
annual forecast back in January. So it's nothing new. It's just a new data point—and a trade that we think we can make.
When there's a lot of noise in the market, we usually try to stay quiet so we can listen and focus. So, on that account, we've talked enough already.
Enjoy the week!
The SqueezeMetrics Team