All the charts and data we refer to can be found on the Yacht Club page.
Hey everyone,
- Then
- Now
- New Tickers, Trash, and Privates
Then
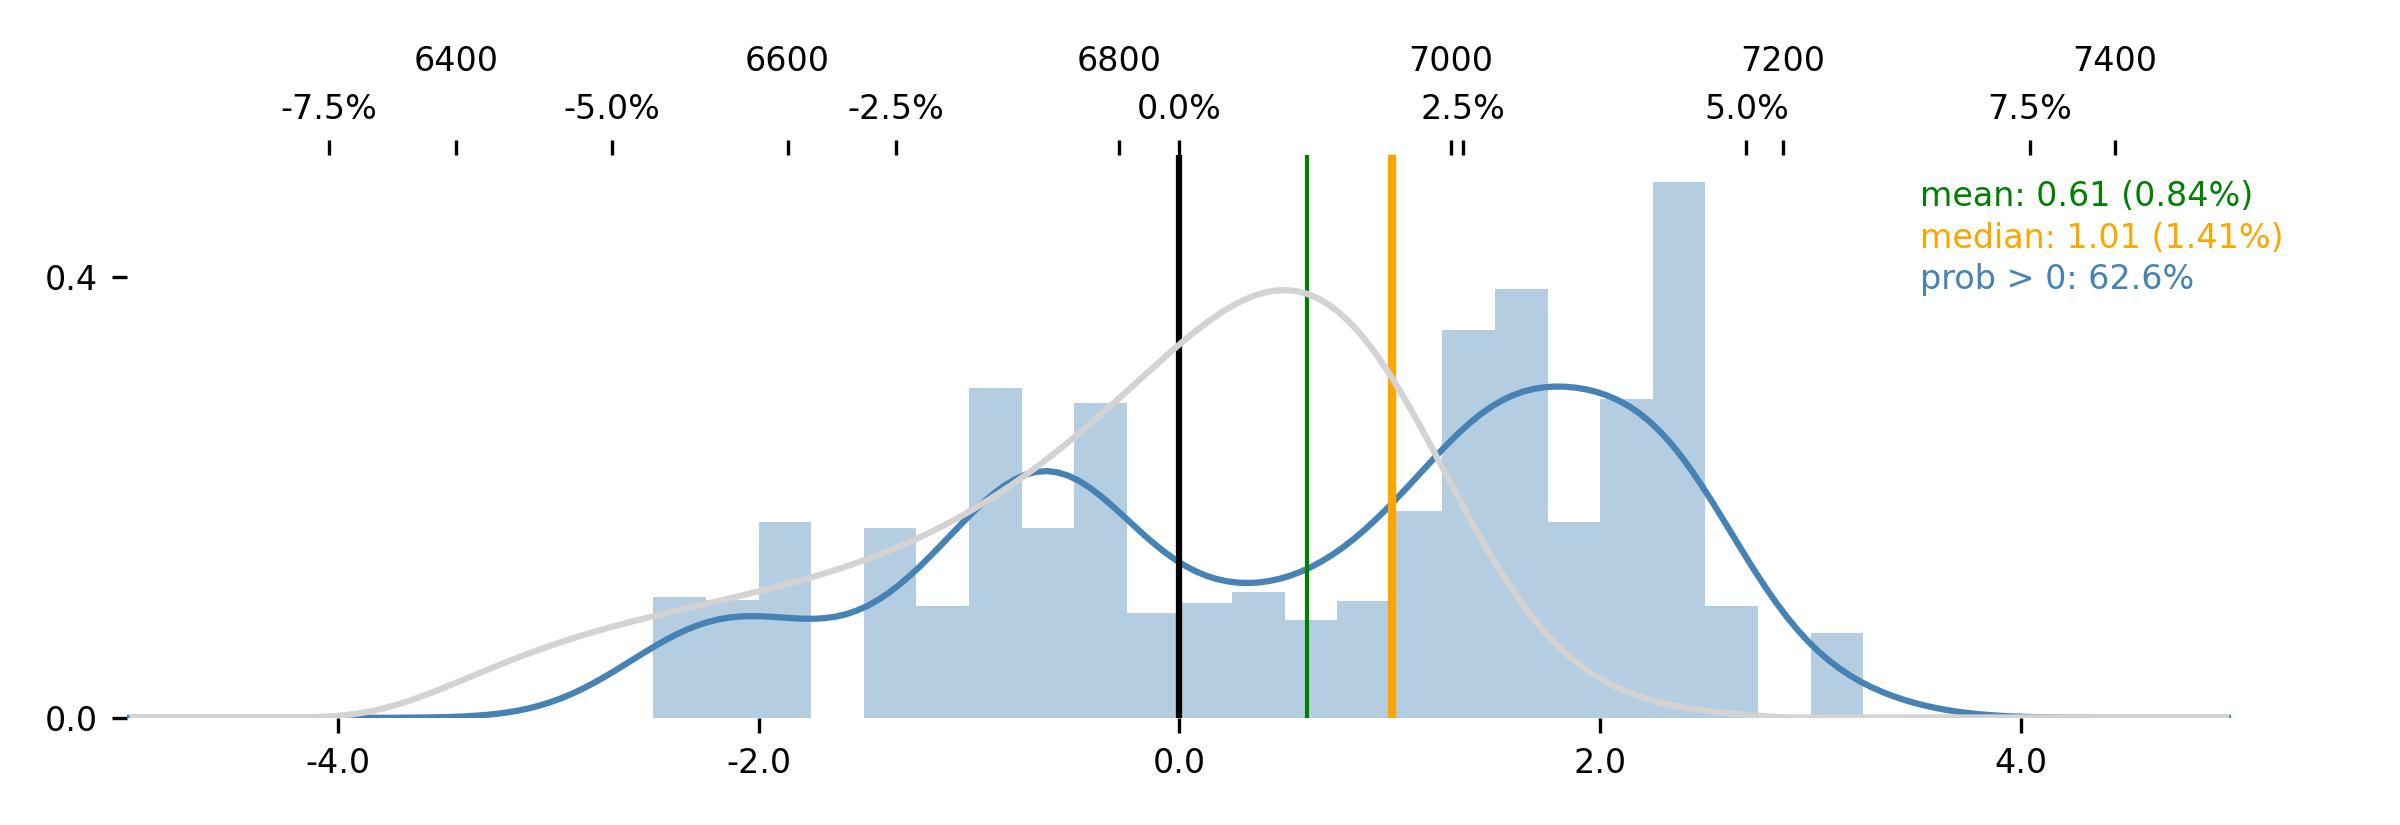
Last weekend, we said it was the right time to be long some calls. It was a cynical trade, since we don't feel "bullish," but it seemed correct, from the perspective of the data. Upside was [much] more likely.
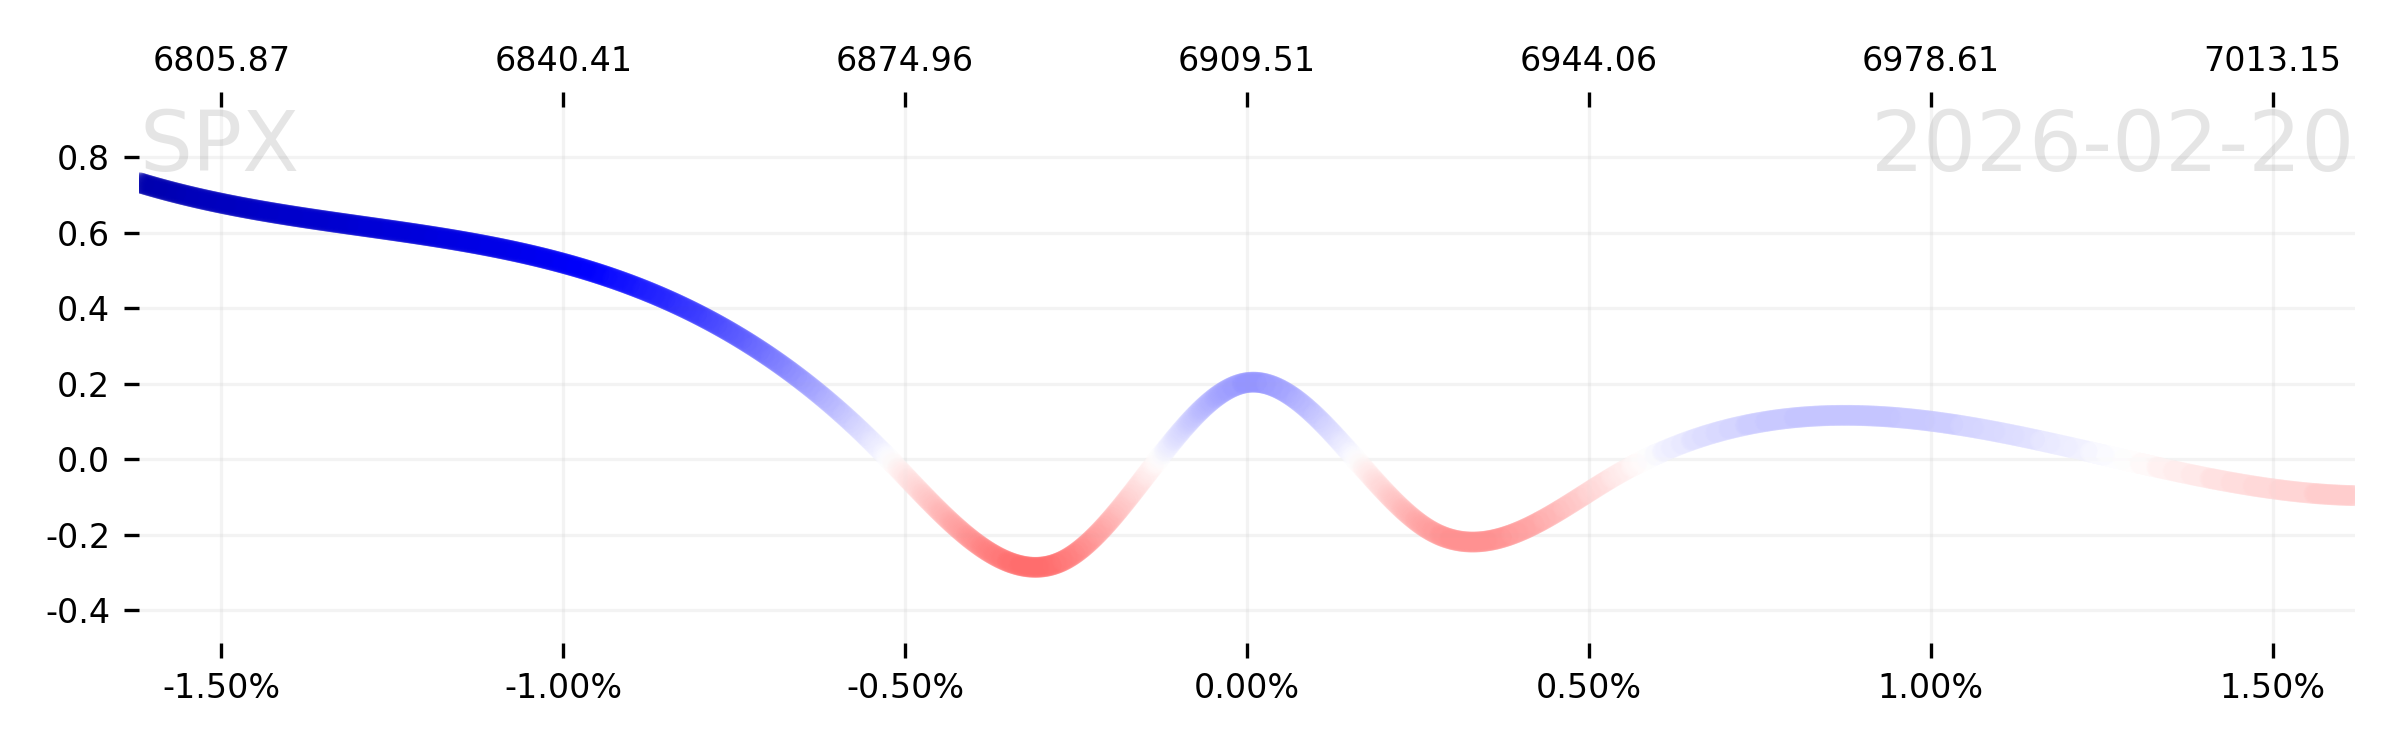
At the same time, however, we noted that any upside in the index was likely to lead to worse subsequent forecasts. Both Robot Jim and the interactive S&P 500 Chart bore this out. So maybe it'd go up—but if it did, it'd tee up a worse forecast.
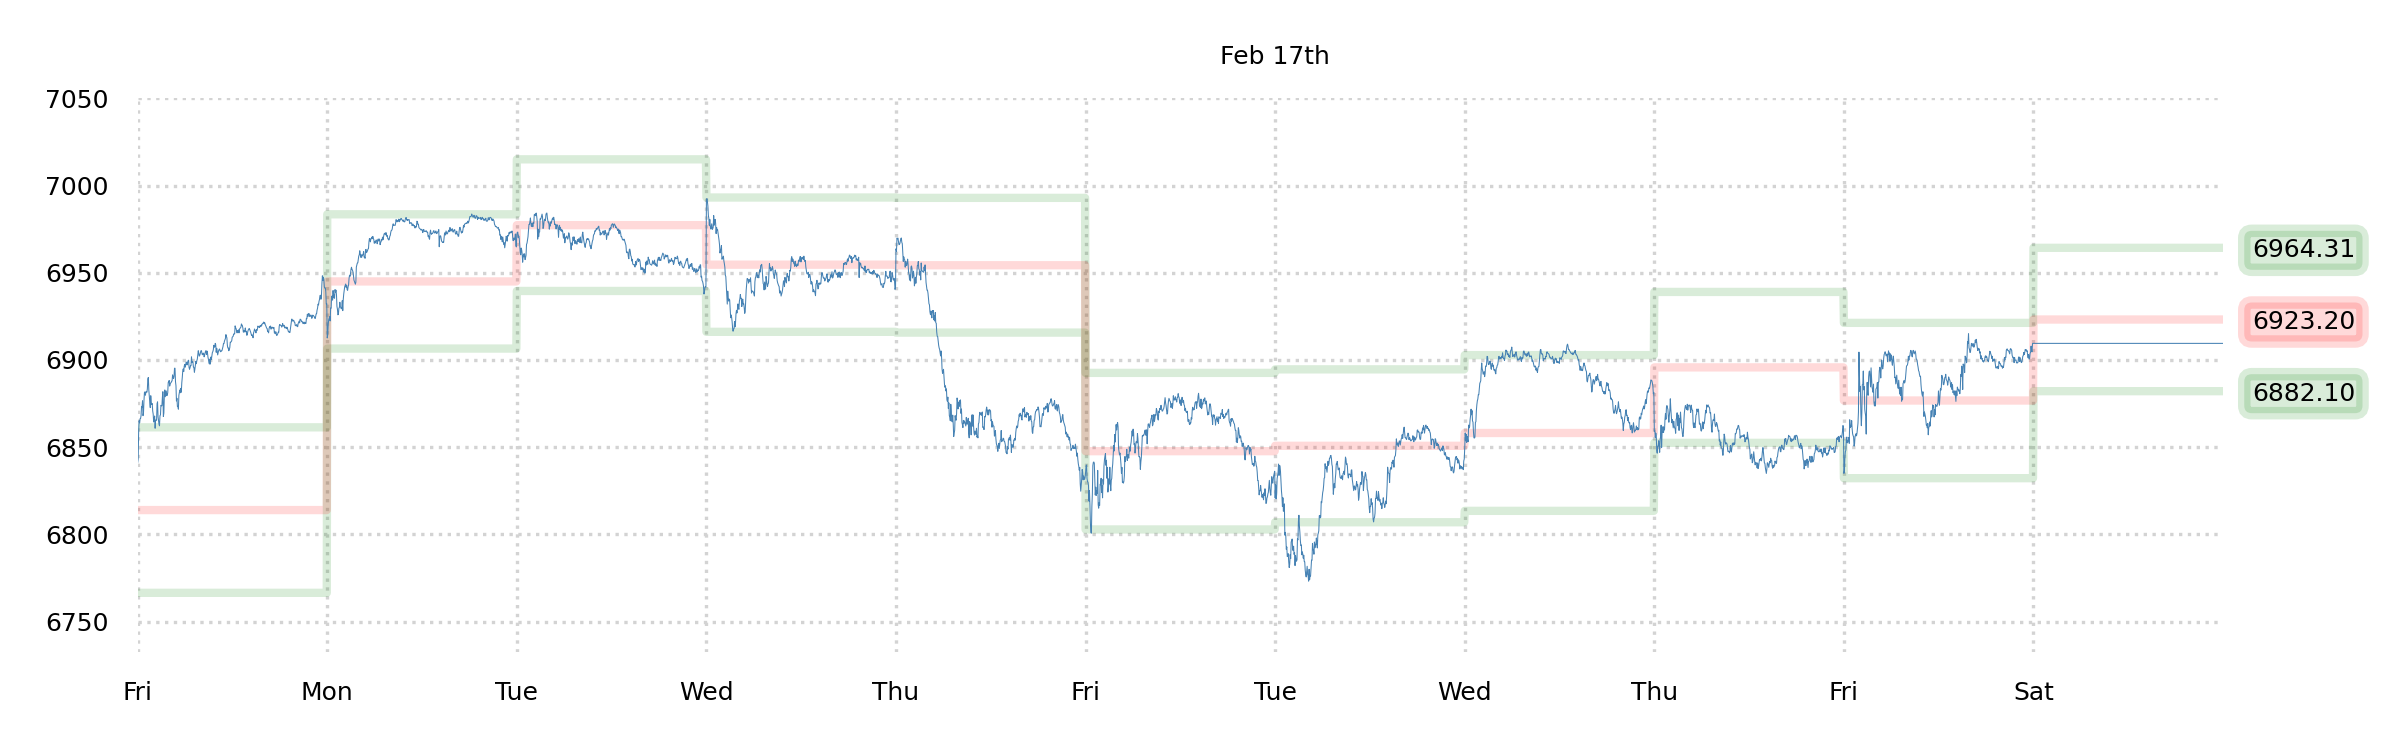
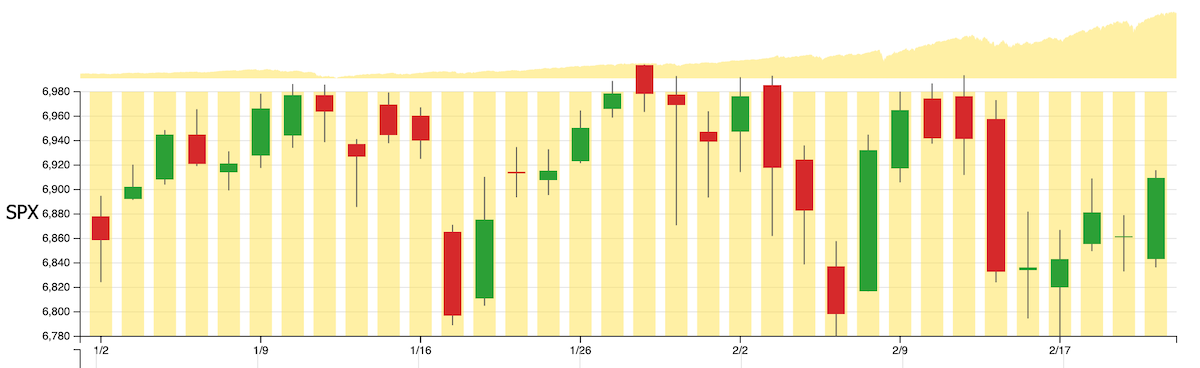
Well—the index went up a bit over 1.00% on the week. Not enough to make the calls pay (a bit better than breakeven right now if you bought Tuesday morning)...
Now
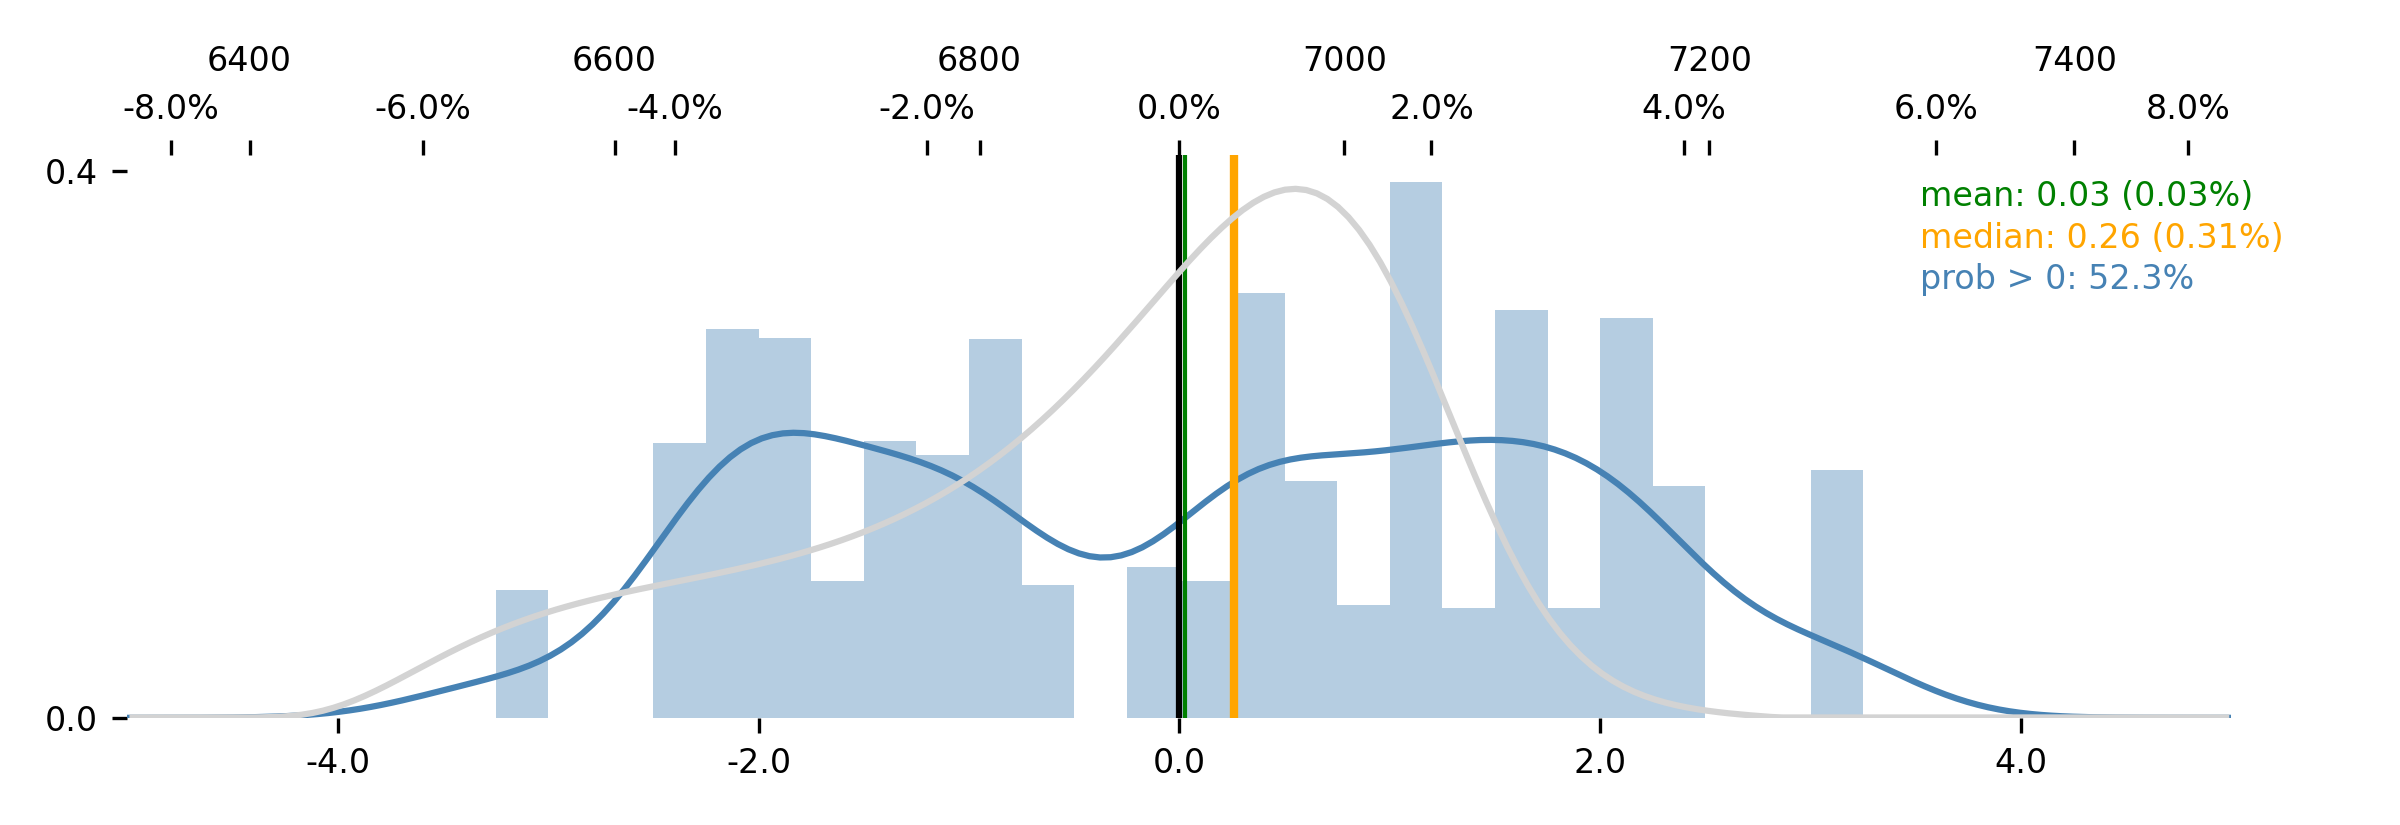
...but it was enough to make the forecast saggy.
Jim samples a 0.03% mean weekly return. Advantages are seen in betting on big, burly shoulders. A ±2.00 MAD outcome is the most underpriced, according to this distribution, which means that "twice the average weekly move of the past month" is basically what we want to be betting on in the coming week. Something like a 3.00% move in either direction.
The question remains of how to bet on this. Do we pick a direction or remain agnostic? Do we get long gamma, get long a strangle, long a call, long a put?
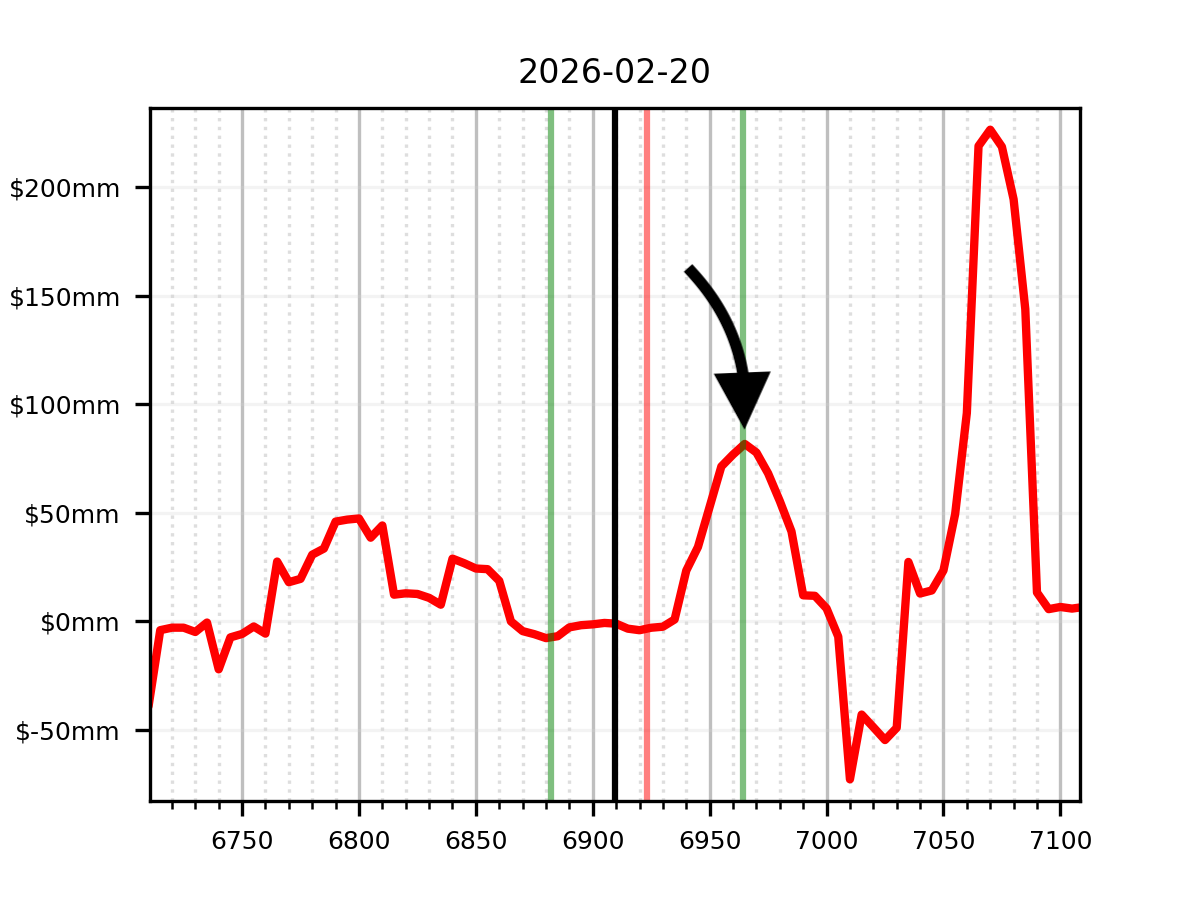
At present, we have slightly OTM SPX calls expiring Wednesday. We've been holding these outright, sitting on our hands. Given the current distribution, it feels quite natural to simply re-imagine this as a long-gamma position, and to begin loosely hedging deltas.
Practically, "loosely hedging deltas" means that we'll try to time E-mini gamma scalps really well, and then get kind of mad if we're wrong. So, for instance, we'd love to see SPX climb to 6965 on Monday, then lock in a biggish short position (maybe a slight over-hedge of the call delta).
This would also broadly be in-line with Jim's step-forward analysis, which stays bearish-neutral on just about any Monday upside.
This big-picture approach—this "Long Gamma with a Twist"—has been most of what we've done in 2026 so far. It's somewhat unsatisfying, but honestly, it's worked really well. The environment has been perfect for it.
Range-bound mechanics, punctuated by 100-point days? A veritable dance of long gamma.
And the data still says that's still the right way to lean.
We shan't argue. Don't fix what ain't broke.
New Tickers, Trash, and Privates
Required minimum history for the 5000+ tickers on the platform is now two months, down from twelve months. That mean's there's more stuff now. Tons of new trash. Mostly it's stuff like: Stocks that went down as soon as they IPO'ed, but haven't been delisted yet. Or ETFs with stupid names like "T-Rex" that sell options or buy total return swaps on Tesla. But... one man's trash is another man's treasure. Particularly true in markets.
Speaking of trash, the private equity/debt market is having a moment, and since we talked about this (and BDCs in particular) at length
back in February, we feel compelled to make note of it. At this juncture, we love the idea of buying some beleaguered ticker that's been caught up in the Blue Owl
drama. What we'd like is some long exposure to something that's been hurt that will bounce on any indication that private markets aren't
all cockroaches right now. How do we do this?
Easy! Go to the
Ideas page, sort by Industry, find "Asset Management," and look for tickers with
terrible price-trend (P) that might be unfairly maligned. Hey—how about Hamilton Lane (HLNE)? It's P is –0.655, which is among the worst in the whole group, and yet, HLNE is more of a "picks-and-shovels-for-alts" kind of company (and a successful one!), so it's probably more responding to sentiment that "private markets aren't growing from now on." And that's exactly the big-picture worry that we want to bet against (in the short term, anyway!).
To boot, when we look at the
Chart and the
P-scope, it looks decent. The stock historically recovers very well from high-volatility dips (high V, low P), and the "Nearest" button shows well above-average returns for the current data setup. Same with the P-scope—nothing worrying, and the "Nearest" data looks decent. In the meantime, IVs are 40–45% (remember you can select IV by clicking on any of the P, V, G, or D axis labels and selecting "IV" from the drop-down), which means the market's "implying" 2.30% average daily moves [45 * sqrt(1/252) * sqrt(2/pi)]. And that's when the stock is down
13% in a couple days!
Feels to us like calls are cheap! Which means we can take a lopsided fixed-risk bet on a reasonably likely "it's-not-actually-that-bad" signal pushing this stock right back up.
So there you go, two minutes of work to dredge up the kind of ticker that responds well to a particular scenario, and with good reason.
Oh, and we're still long bonds for all the same reasons as elucidated last weekend. Holding tight.
Feels like an eventful week coming up. Enjoy!
The SqueezeMetrics Team