All the charts and data we refer to can be found on the Yacht Club page.
Hey everyone,
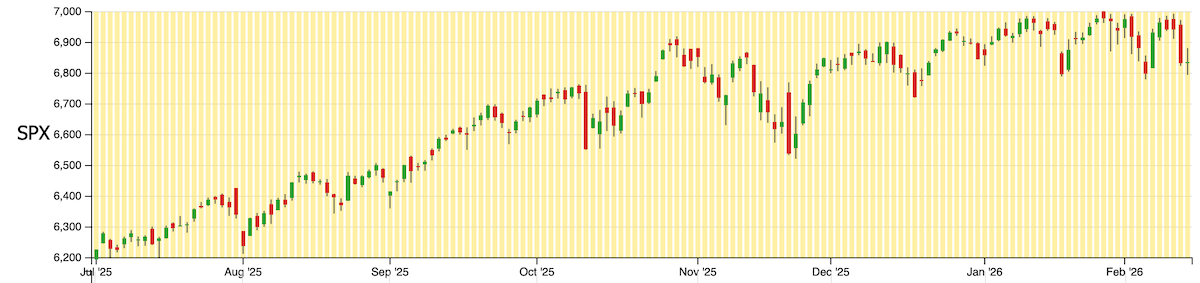
Let's start here: This chart is not particularly inviting. It looks tired.
And that's understandable. We're tired, too.
So let's make this a short note. Besides, it's a short week.
Last weekend, we resolved to buy some deep OTM puts. Robot Jim thought this was a decent trade. The put volga made money this week, but we weren't in it for the quick gain—we actually want exposure to the tail. So we're still holding those puts...
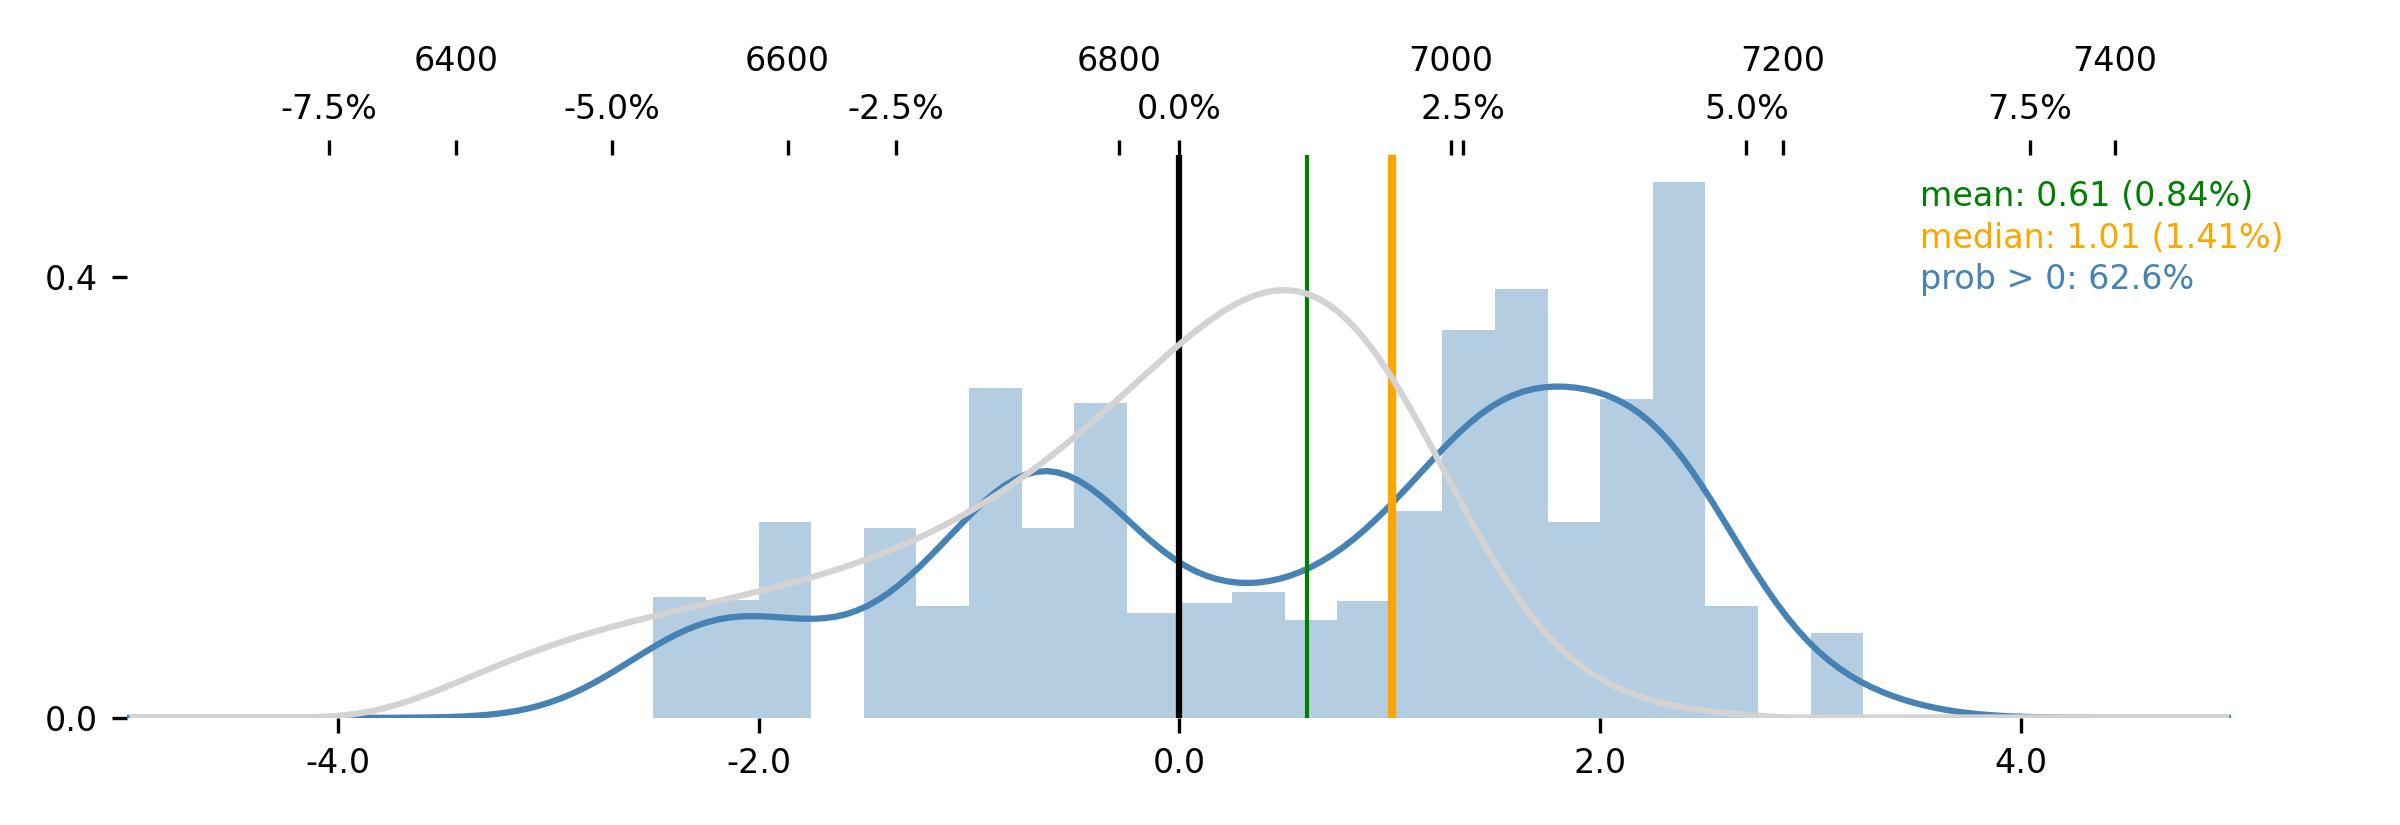
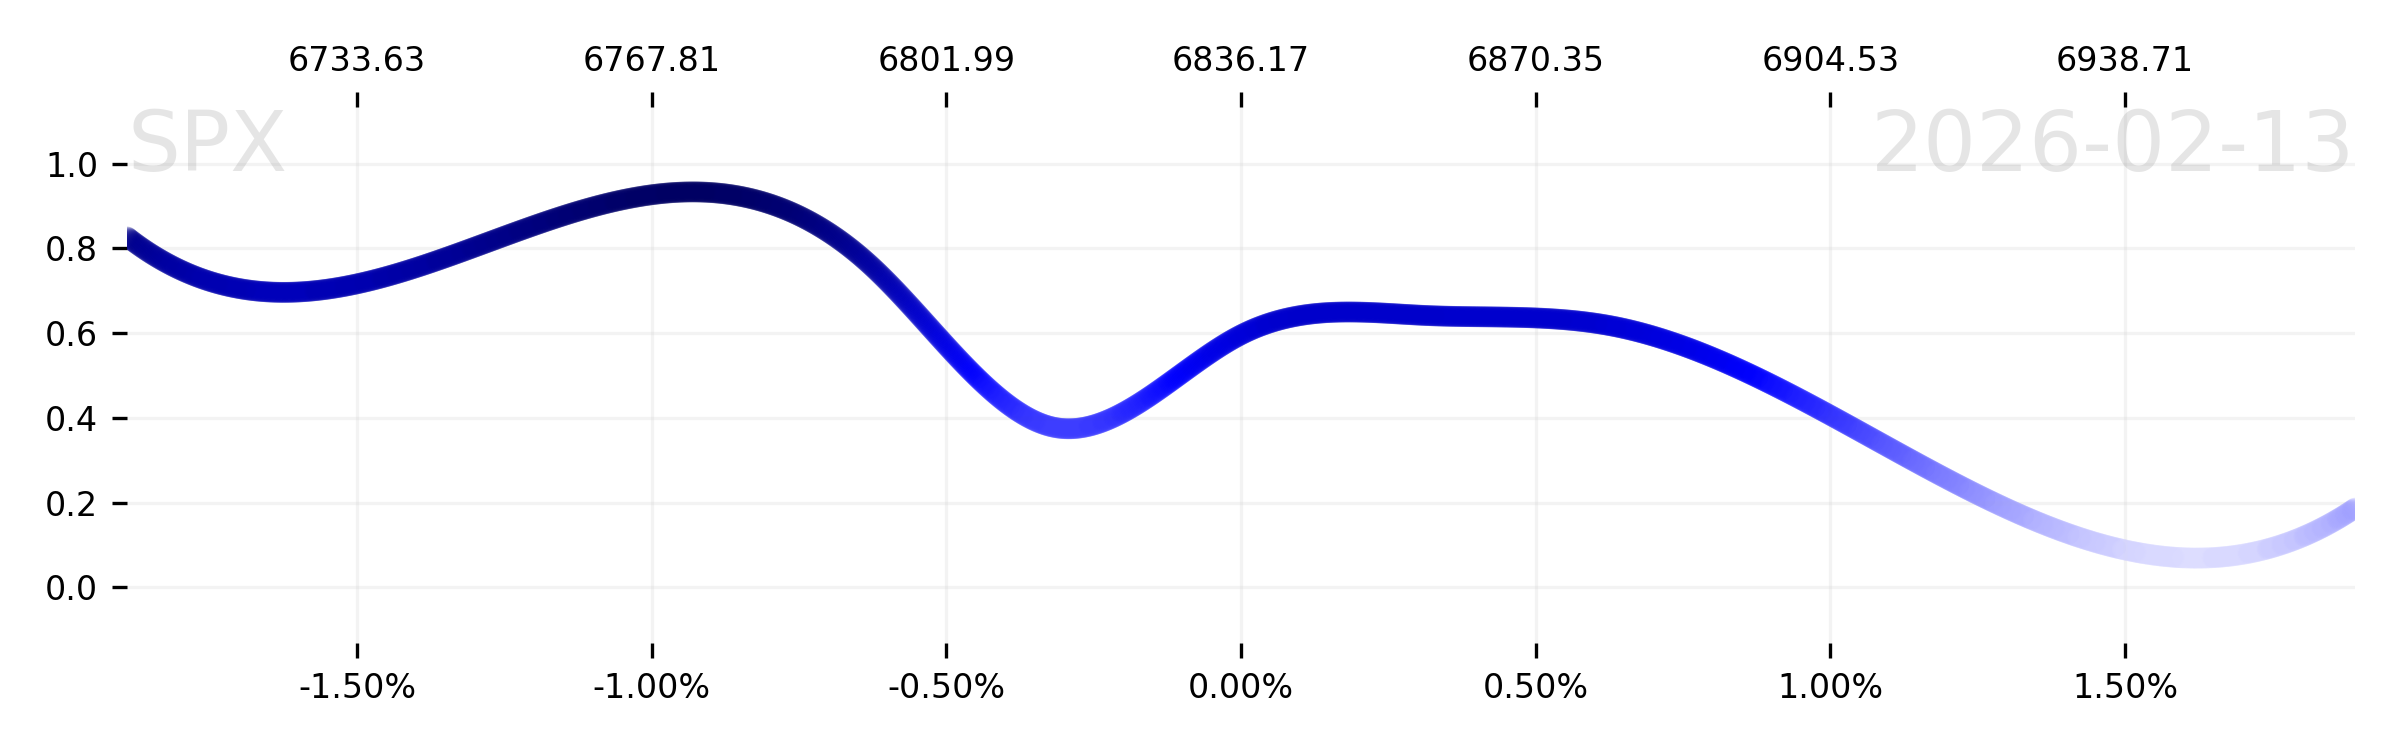
...however, Jim's distribution after Thursday's dip doesn't include a tail.
And so we wonder, how distant are we from a tail? Is the tail just outside of Jim's view? If we move up or down a bit, or if DIX falls by a point, or RISC rises back toward zero, will the tail come back into view?
Regardless of how close we are to sampling a tail, the distribution looks like it has a bullish median return. A 1-week gain of 1.41% is pretty significant. So it seems like you wouldn't be wrong to buy a call.
But should we buy a call and hold our doom puts?
Let's stop wondering and let's poke at the data ourselves—because as of last weekend, we can quite confidently sample the data using a nearest-neighbor algorithm
on our own.
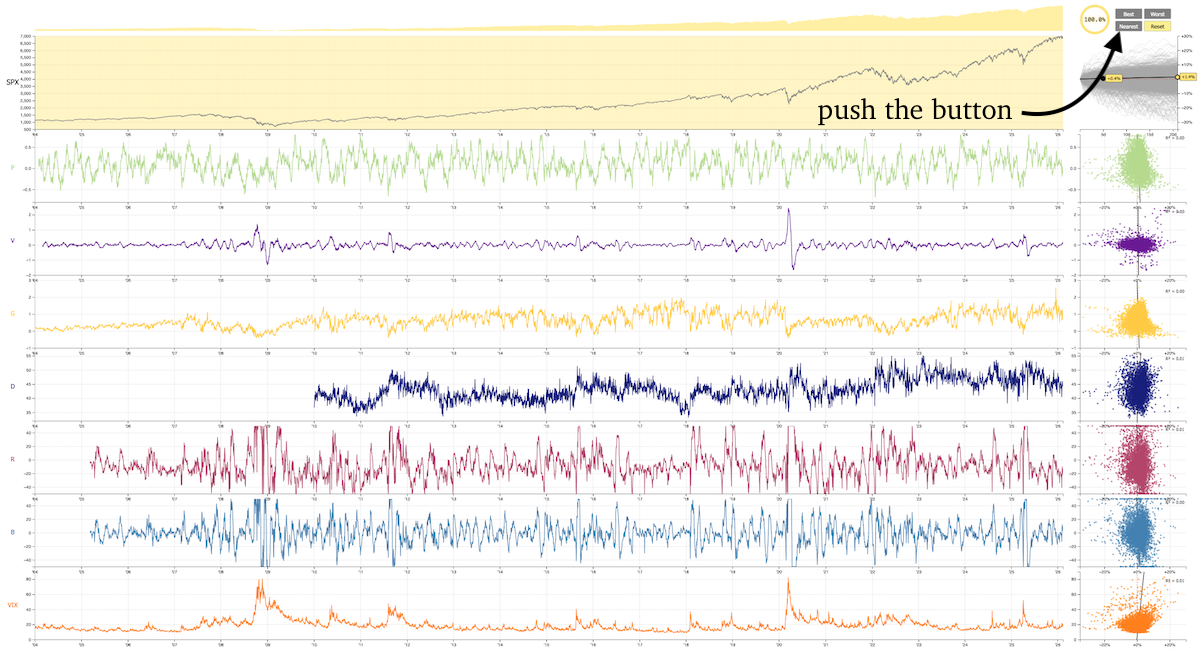
Just gotta push the button.
So let's do that.
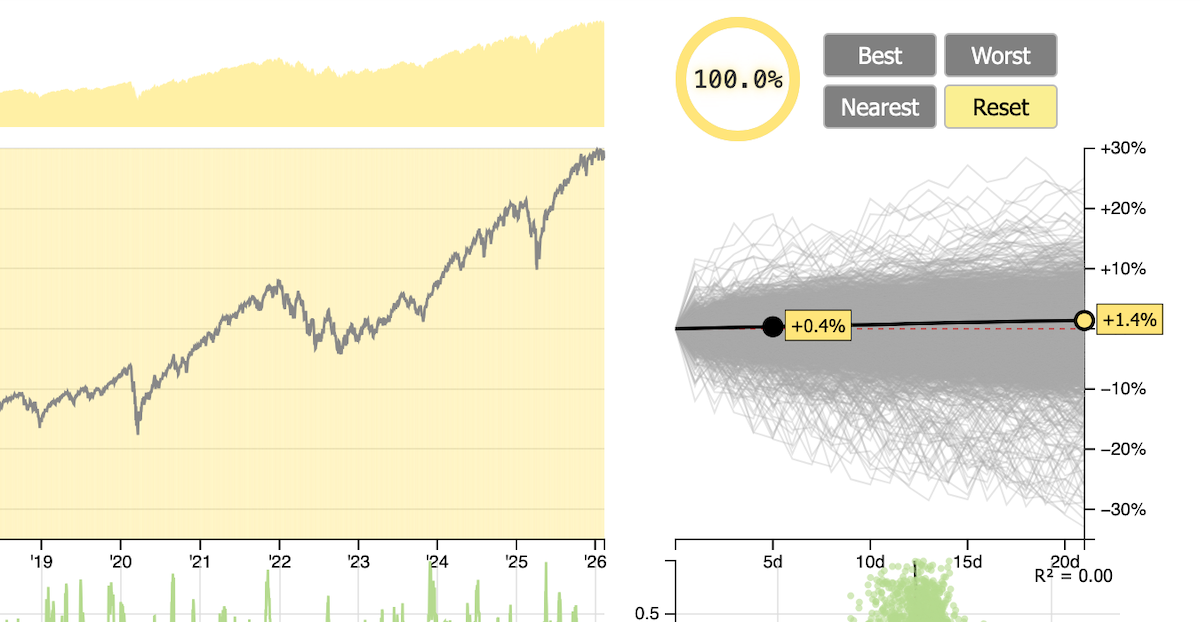
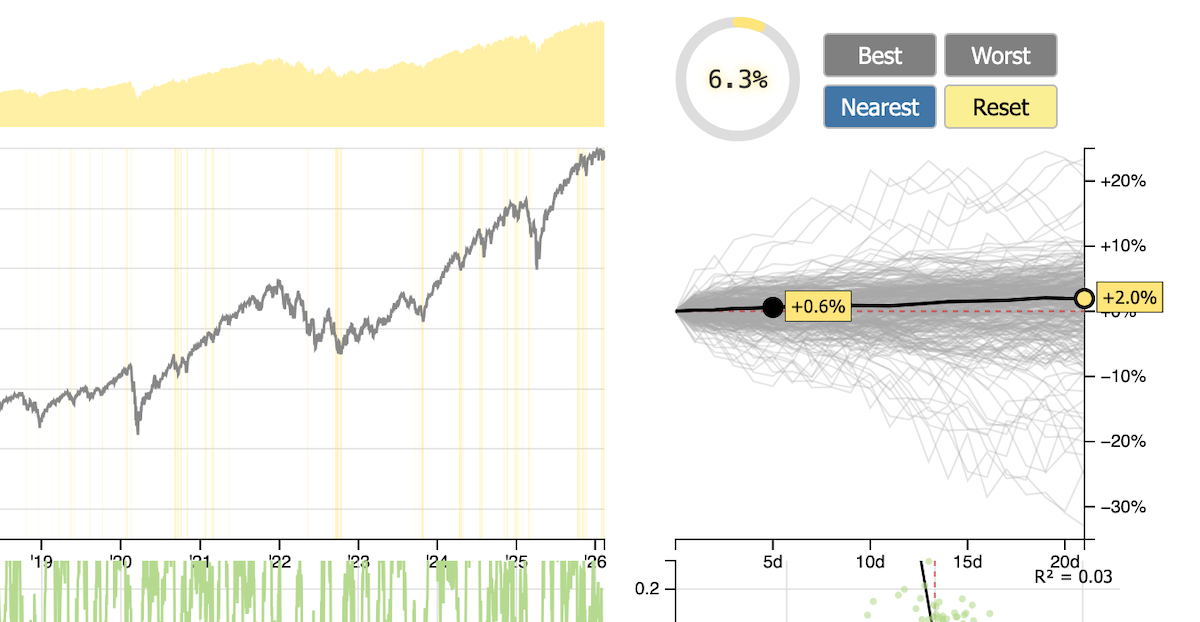
We start with a median 1-week return of +0.4%, and a median 1-month return of +1.4%.
When we click the Nearest button four times—cutting down the data to the nearest 6.3% of all history—we get a median 1-week return of +0.6% and a median 1-month return of +2.0%.
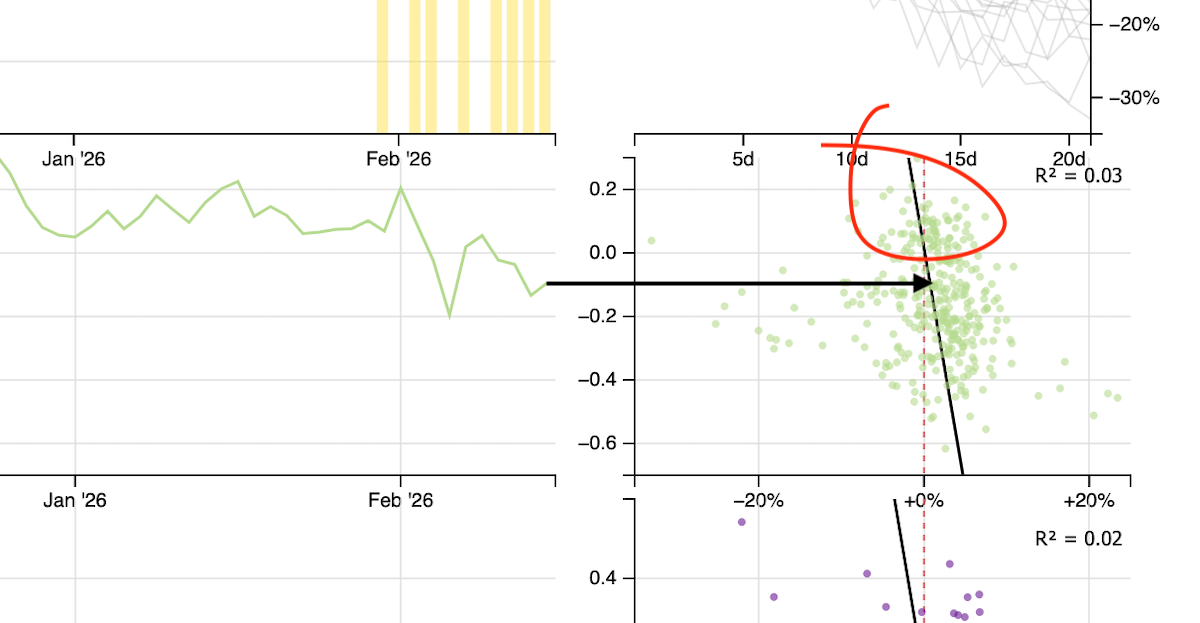
This is very clearly a bullish subset of the data, which is what Robot Jim was already telling us, and it appears that the strongest effect, currently, is price-trend (P) itself.
Note that, if P rises from here, forward returns will worsen. In fact, if you click-and-drag on that [red-circled] sub-section of the scatterplot, you'll see that the 1-month median drops from 2.0% to 1.4%.
And you know what? This matches exactly with what Jim's step-forward tells us.
As price rises, the forecast clearly worsens (and vice versa).
All very sensible.
(Bear in mind that it is not always the case that rising price results in worse forward returns. Indeed, if you wish to test out one obvious case, try selecting by "high G" on the Chart, which will isolate only historical situations where GEX+ is high. See what happens to the scatterplot of P when you do that? Yeah, the r-squared association flips. Meaning that when GEX+ is high, rising price is actually more bullish, and falling price is more bearish. The opposite of the current situation.)
However, we're supposed to be answering a particular question:
But should we buy a call and hold our doom puts?
And the answer is yes. In fact, nearly any long-option strategy sounds good right now. You could be long a strangle, a straddle, a delta-hedged call (long gamma), or you could just be long some calls or puts, depending on your mood, and you'd probably be in a positive-expected-value trade. For our part, we're going to trust Robot Jim's leanings and the simple output of the Nearest button and we're going to buy some calls. Keeping it simple.
There. That's it. Net bullish. Long gamma. Play with the S&P 500 Chart.
That's all we intend to communicate this week.
* * *
Although if you'd like to keep reading...
...because you're genuinely bored and you want to consume more words, and brain-damaging macro chatter doesn't deter you...
...the cross-currents that are converging on bonds right now are pretty fascinating. The chatter is
loud. Commodities, which have a solid
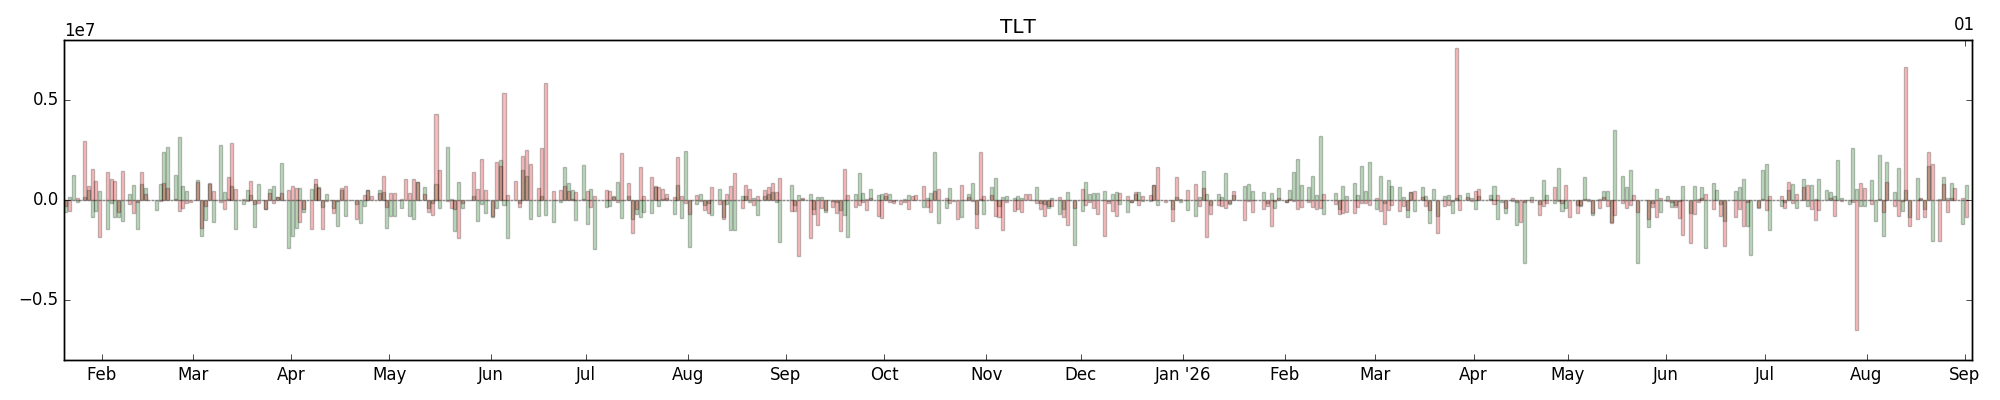
inverse predictive relationship with bonds, have had a nice little crash, and bonds responded immediately. The chart is also appealing from an intuitive "TA" perspective (and since the people who trade bonds are monkeys, this means something); and momentum is building (and momentum is a demonstrable effect in bonds); and TLT options are become extremely
long-delta, particularly long calls slapping the ask in the last ~7 trading days (which is bearish if momentum lags [which is most situations] but bullish if the long calls can gain deltas faster than they lose time-value, which they have been so far); and momentum has failed in other darling asset classes (BTC, GLD, SLV) and folks are looking for a new hype target; and the dollar has been unfairly maligned as "smart" allocators continually seek out non-USD-denominated cash-flows (even while U.S. military might continues to cow the globe, which was always the underlying justification for being long dollars in the first place); and then we see a cool-ish CPI print while the inevitability of our robo-future (and attending [deflationary] impacts on the labor market) dawns on everyone.
And if that weren't enough, it's been almost 18 months since the first Fed cut, and the last thing we said about this Fed cutting cycle was that the same ironic stuff that made the hikes unlikely to really "brake" the economy (i.e., no required reserves [post-2020] + IORB [post-2008]), save through a lagged "wealth effect" from bond principal losses, would instead make inflation stickier—these work the same way on the downside, whereby cuts seem likely to be ineffectual, or to even
spur deflation.
With this interpretation, you could perhaps understand why inflation has, so far, been very sticky. You may also understand why a bet on higher rates of inflation isn't crazy. But what we're not quite sure we understand is what happens in the event that the Fed actually cuts rates (like the market is predicting). Wouldn't that actually be... deflationary?
We took a stab at the long bond trade in March/April of 2025, with many of the above justifications. If we were right at all, we were certainly early. (We gave up and just got long robots instead, which has fared quite well.) Now, though—now feels fairly ripe.
So yeah, we're positioned for an "ugly rally" in bonds.
Enjoy the week!
The SqueezeMetrics Team