All the charts and data we refer to can be found on the Yacht Club page.
Hey everyone,
Apologies if you were unable to log into the platform at any point today—we've been sparring with droves of fairly motivated Internet-burglar-robots, and their small, electronic bodies have been piling up in the atrium, impeding the flow of bits. This is not the first time we've been attacked, and it certainly won't be the last. But, more to the point, you might find that the following prose makes less sense [than usual], as we've been distracted. Sorry.
***
Two weeks
ago, we got
"long a few wingy puts for the vega convexity," since it was the first time in forever that Robot Jim actually thought buying a put made sense.
We sat on that for a bit while spot fell and vol rose, and ended up selling it back on
Thursday morning. Not bad.
The reason to ditch the puts was that (a) Jim switched to a positive mean 1-week return, (b) DIX printed a bit higher, (c) RISC fell past -30, and (d) the 0DTE intraday hedging data indicated that Thusday's positioning didn't have customers caught offsides short a bunch of ITM puts anymore.
This is all to say—we actually tried to listen to the data for the past couple weeks.
And that was a good idea.
(Should do it more often.)
Anyway...
- One
- Two
- Three
One
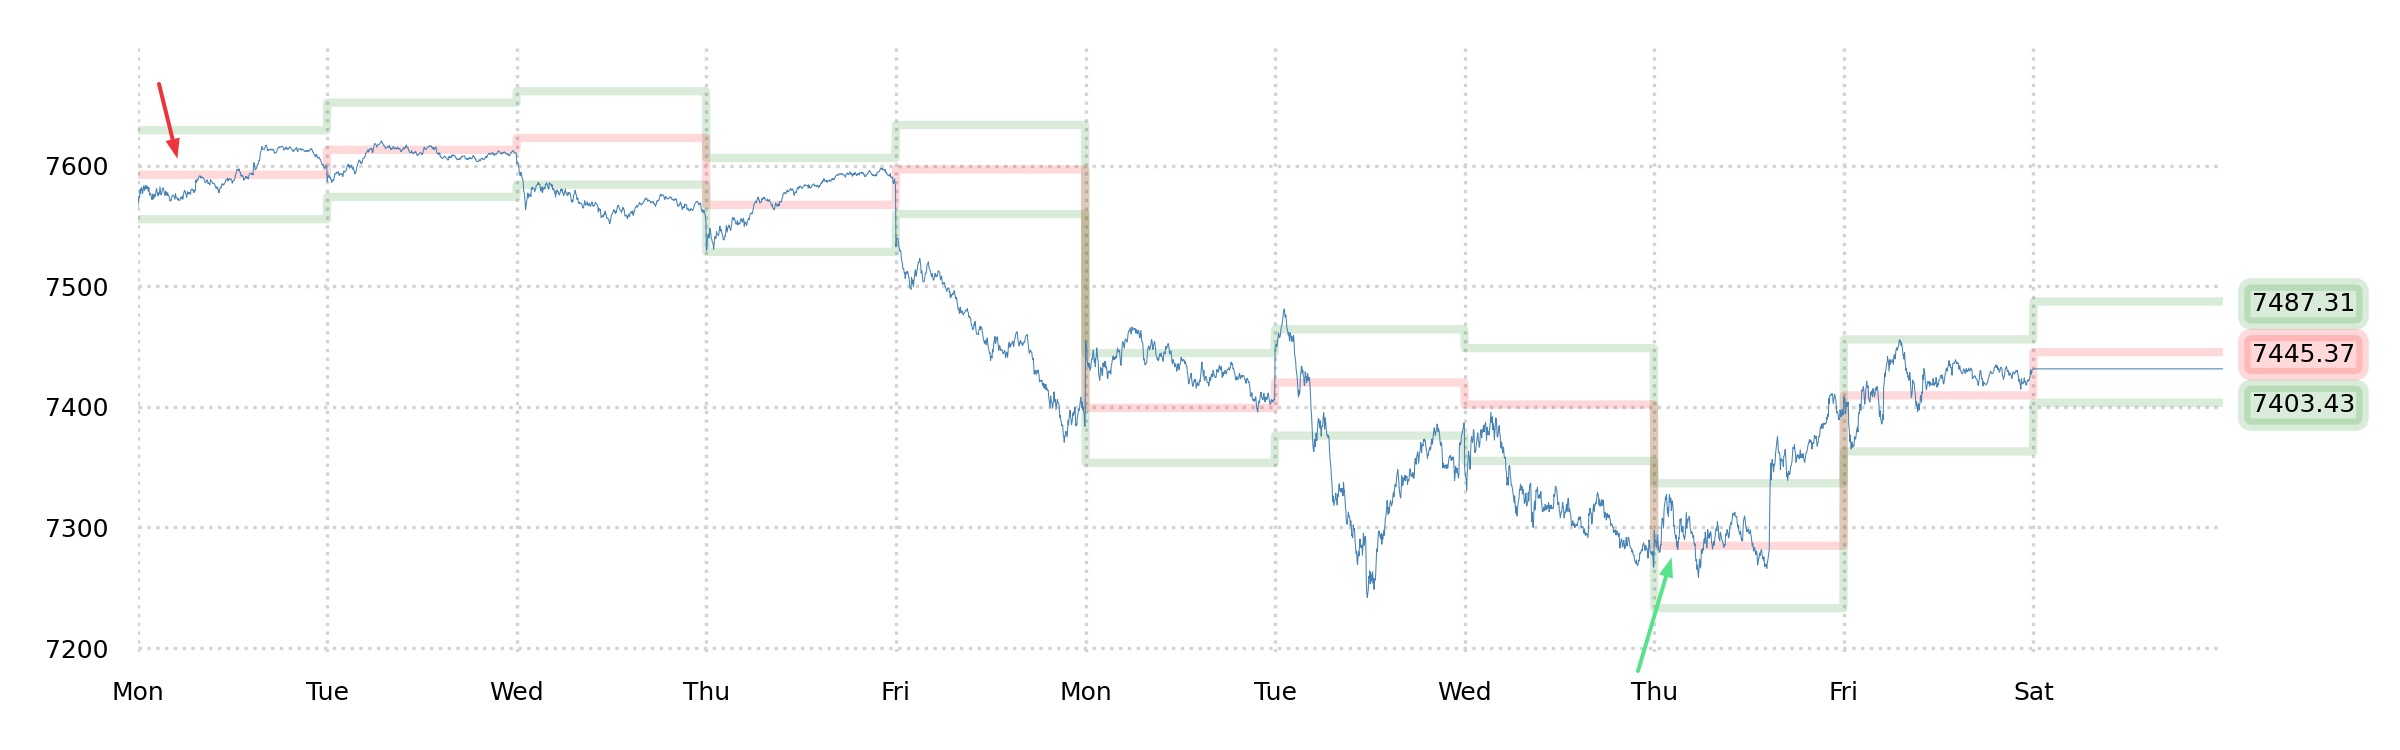
We'd say that the defining feature of the past week was the way the market handled the SPX puts that got left in-the-money as the index dropped a couple hundred points. We tried to monitor this pretty closely (and watch for new short put flows), because this is what determined whether, and how much, SPX dealers were buying or selling on any given day's ups-and-downs.
Part of what had us giving up on our long puts on Thursday morning was that the put-sellers had gotten a bit quieter (after being quite persistent!). We're not suggesting that anyone got "carried out" by the week's volatility—only that the pattern of put-selling that started a couple weeks ago finally met a bump in the road, and this week was that bump.
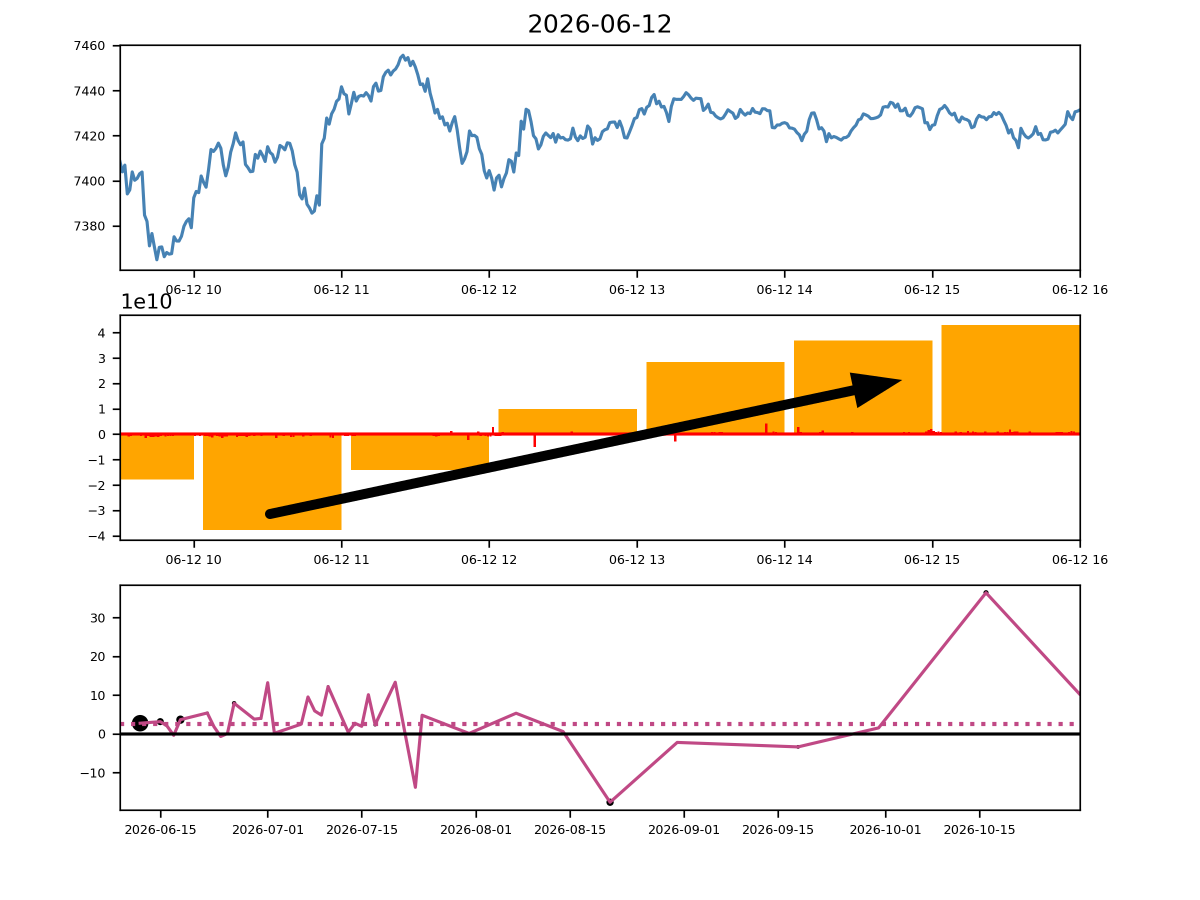
Of course, that all being the case, we have to mention that Friday ended in a crescendo of put-selling, and that NPD printed +2.27.
So we were left with the impression that "the coast is clear!" is still the prevailing impulse, and that there's still going to be a case for long vol.
Two
The "case for long vol" is definitely still on Robot Jim's mind as well.
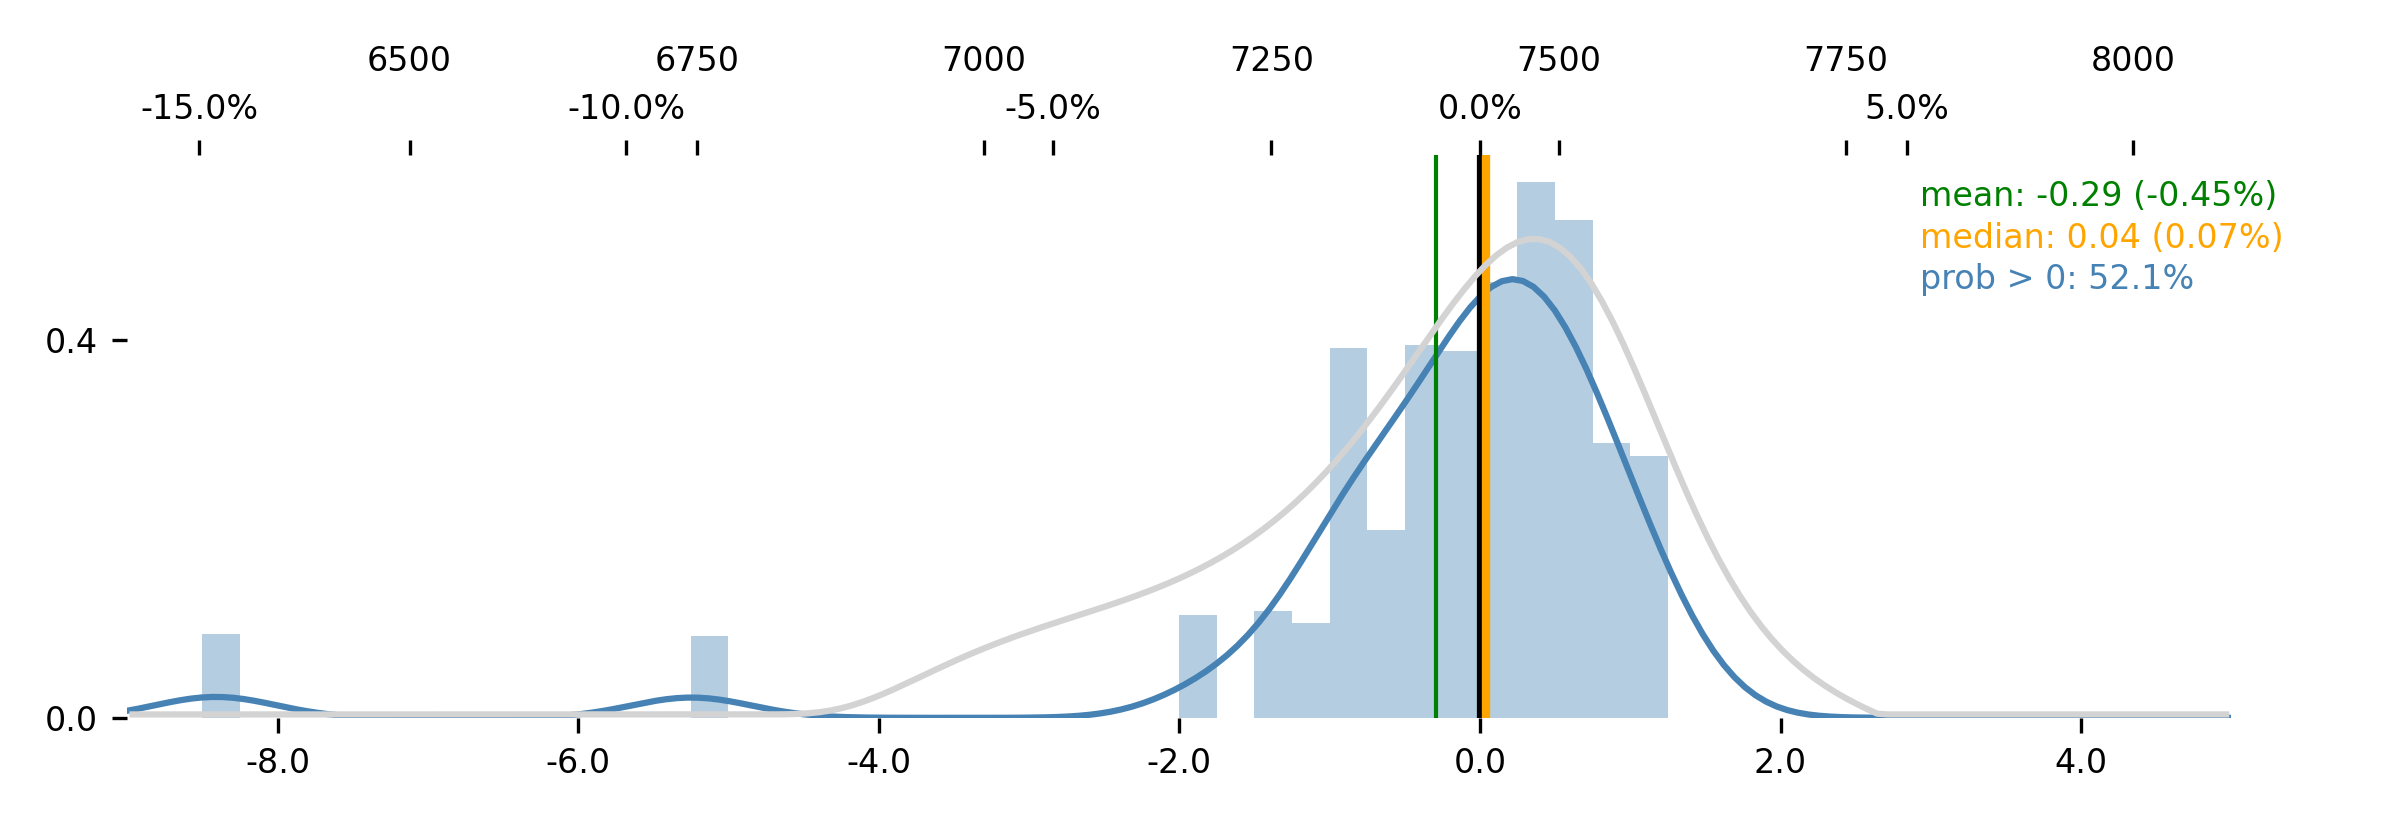
That tail is fat.
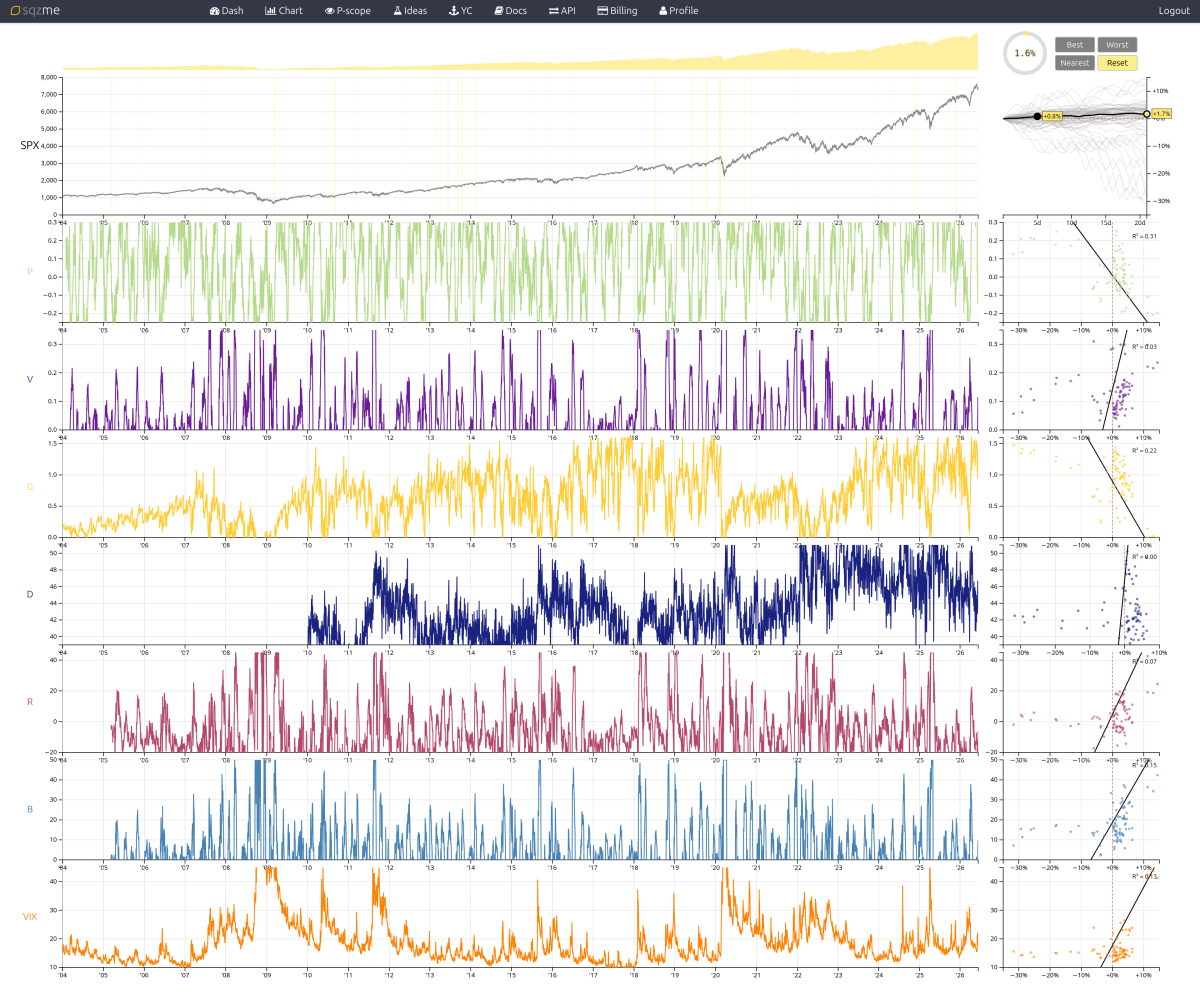
Jim sees strong similarities between now and historical periods when SPX returned -15% in a week. Recall that Jim has a small sample size, so tails can come and go from day to day; but recall also that we can validate this ourselves by referring to the
SPX Chart in the Yacht Club, with which we can interactively ponder the meaning of the data.
You'll note that even the nearest 0.2% of the data strongly features a huge left tail. So there's definitely something to be said for the current market exhibiting "left tail patterns."
It is tempting to buy back into an OTM put position here. Y'know, crash puts. Wingy dingies. Cheapies. Teenies. Whatchamacallits.
We're probably going to do it.
But let's refrain from commenting further, and let's see where the week takes us.
Three
A word on our current research item: "delta-fudging."
Two weeks
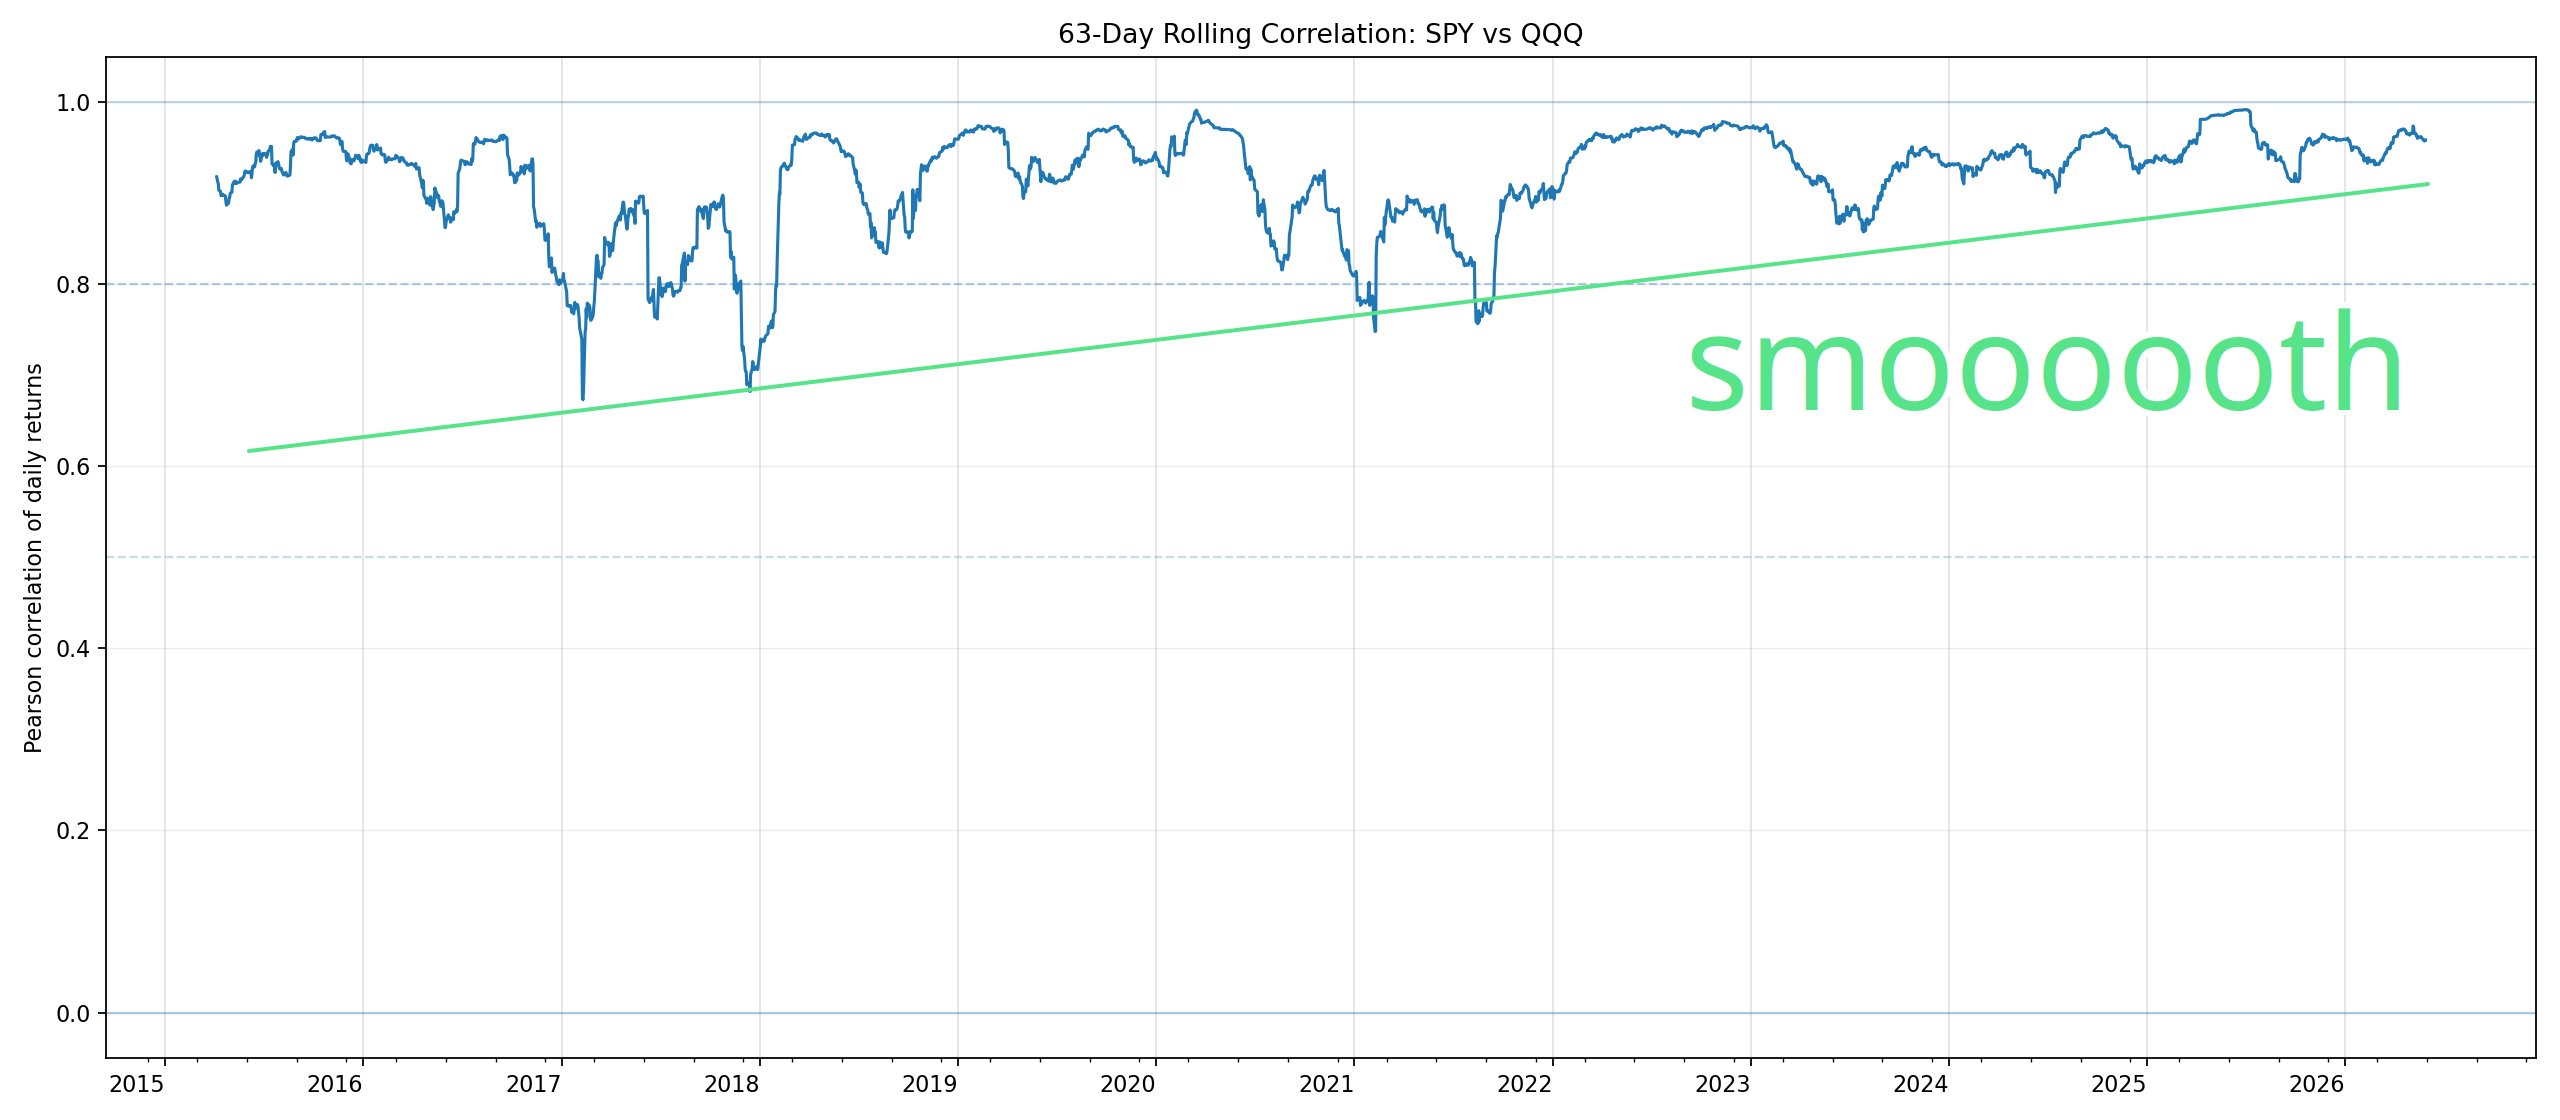
ago, we noted that the correlation between SPY and QQQ became more stable between 2015 and the present. This made sense because high GEX+ has historically driven "rotation" in S&P component sectors, and if high GEX+ now has less meaning due to "delta-fudging," we should expect less anti-correlated rotation behavior.
We declared, once again, that "delta-fudging is real," because this matches our impression of the causal levers at play.
This is a bit disturbing, of course, because it means GEX+ is becoming less useful. But then, we're used to things becoming less useful (recall that we removed NPD and VGR from Robot Jim's inputs not long ago).
This week: One more quick test.
If we're correct about all of this stuff, it seems like correlations between SPY and QQQ should become more stable through time when GEX+ is high (in an up market), but that it should be about the same through time when GEX+ is low (in a down market). The reason for this is that we see evidence of large call-buying in QQQ components, but we do not see evidence of similarly large put-selling in QQQ components. So SPX dealers are able to lay off their SPX long call gamma against their component short call gamma; but they are not able to lay off their short SPX put gamma against a component long put gamma.
I.e., correlations should be high and stable from 2015 to present whenever GEX+ is low. There should be no change over time.
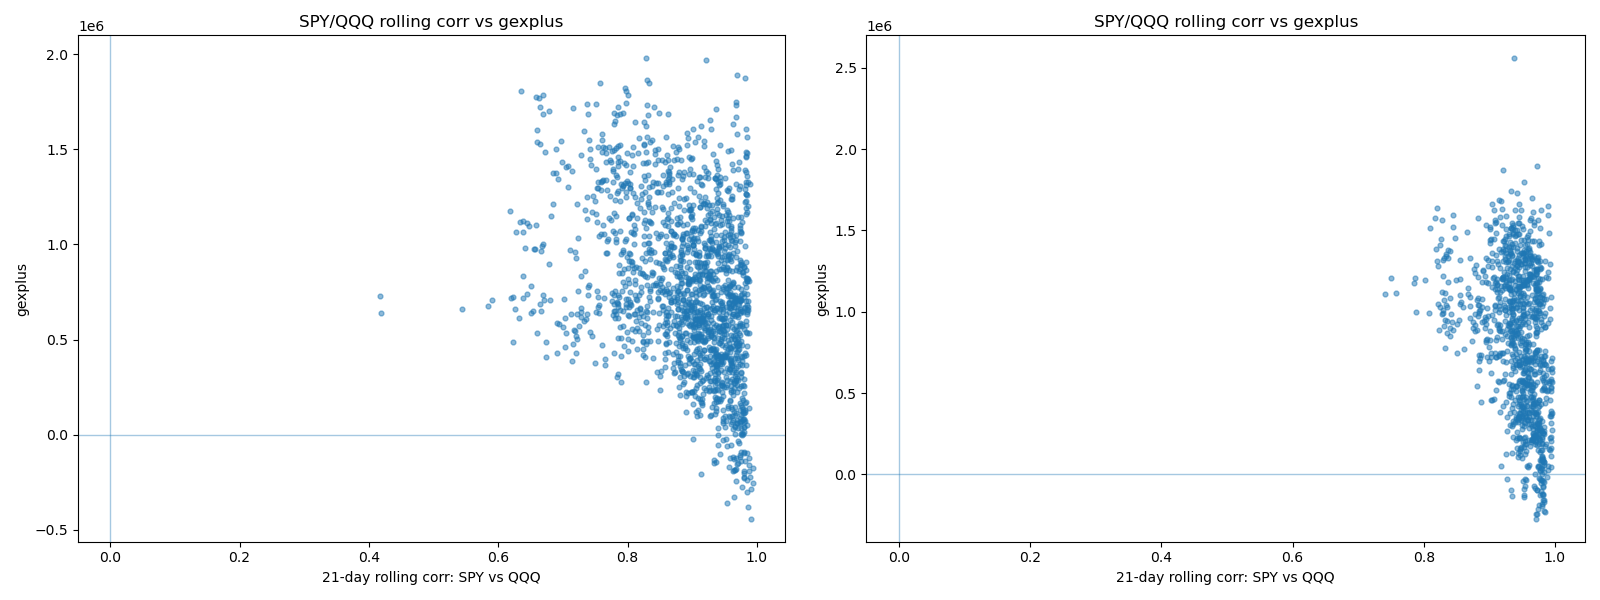
Let's plot it out.
Yep.
Lots of heteroskedasticity in 2015 to 2022 (first pane). Correlations highly variable when GEX+ is high, but super tight when it's near zero.
In 2022 to present (right pane), the variability in high-GEX+ markets all but disappears; but when GEX+ is near zero, it's still just as tight.
This suggests that, indeed, delta-fudging is a big deal for S&P 500 components due to customer call-buying; but customers aren't selling puts in enough size to impact the SPX put market and low-GEX scenarios.
These three tests in the last couple weeks...
- GEX+ losing some ability to predict SPX vol
- SPY-QQQ correlations becoming gradually more stable
- correlation stabilization happening only in high-GEX+ markets
...pretty much validate exactly what we were thinking about delta-fudging. Dealers are definitely using QQQ-adjacent short call options as a dynamic hedge for their SPX long call options. This means there's less delta-hedging going on in SPX itself, even in options that are obviously held by dealers.
What do we do with this?
Well...
Our first tests from
a month ago were focused on the possibility that the Big Tech names, which are the chief recipients of call-buying flows, would be at the center of the delta-fudging phenomenon; and as a result, we would be able to see
something happen when the correlations between index and component were breaking. In particular, it seems likely that, if a dealer is short a bunch of BigTech calls and those BigTech names become uncorrelated to the upside (i.e., they rally at a greater rate than the index), that this should hurt the dealer, who must lose money in such a situation.
But it didn't seem to mean much.
Why?
Possibilities:
- The dealer is willing to lose money in such circumstances. He'll make it back.
- The dealer quotes higher and wider on the offending stock as it rallies, making particularly certain that a "gamma squeeze" can't happen, which is the only real risk.
- There are ebbs and flows in component call-buying. We're trying to paint with too broad a brush by assuming all BigTech stocks are always short call gamma to the dealer.
- Flows are highly variable, increasingly short-term in nature, and thereby, "positioning" changes substantially from day-to-day in unpredictable ways. A BigTech rally that could hurt a dealer on Tuesday could be a profit center by Wednesday.
It's not crazy to believe that shorter-term stuff matters more now, and that the difference between "positioning" and "flows" is less than ever. This variability is not at odds with the overall picture of dealer SPX long gamma getting drowned out by component short gamma, in aggregate (in fact, it dovetails, because more, shorter-term option volume means more gamma, and a little bit of gamma at the right moment can go a long way toward superseding the delta impacts of longer-term positioning).
But the upshot of all of this seems to be that we need to do some digging.
Frankly, it feels like we need to do a fairly large-scale "aggressor-side" analysis on... everything. All optionable NMS securities. Which means we need trade-level data (quote-and-trade) on everything out there, and to try to figure out who's buying or selling what and when, and what happens when they do that.
This is a huge task.
Let's talk more about it next weekend.
Enjoy the week!
The SqueezeMetrics Team