| All the charts and data we refer to can be found on the Yacht Club page. Trouble loading pictures? View web version. |
|
|
| Hey everyone, When you don't have any good trade ideas, you're supposed to sit on your hands. Does the same logic apply to writing? Because we're not sure we're about to write anything worth reading. ... In any case, it's a good day to go off-script. Let's ramble. It was a challenging week for us, operationally. Lots of little things broke and demanded attention: Both data systems and trading systems. It was a lot like bailing out a small, leaky boat, adrift on the sea, in inclement weather. But then perhaps this is always what trading is like: We possess a boat, but it leaks. We possess an astrolabe, but it's too cloudy to use it. Everything is tenuous, and despite nominally having good navigational tools, we still don't know where we're going. We are always adrift... on a sea of irony. We came into the week "long gamma." We added quotation marks to that because "long gamma" is less a position than an attitude: Where and how it's hedged make all the difference in whether it's profitable or not. Frankly (and to toot our own horn), we usually do better than what the subsequent vol differential implies; but this week, we did not. 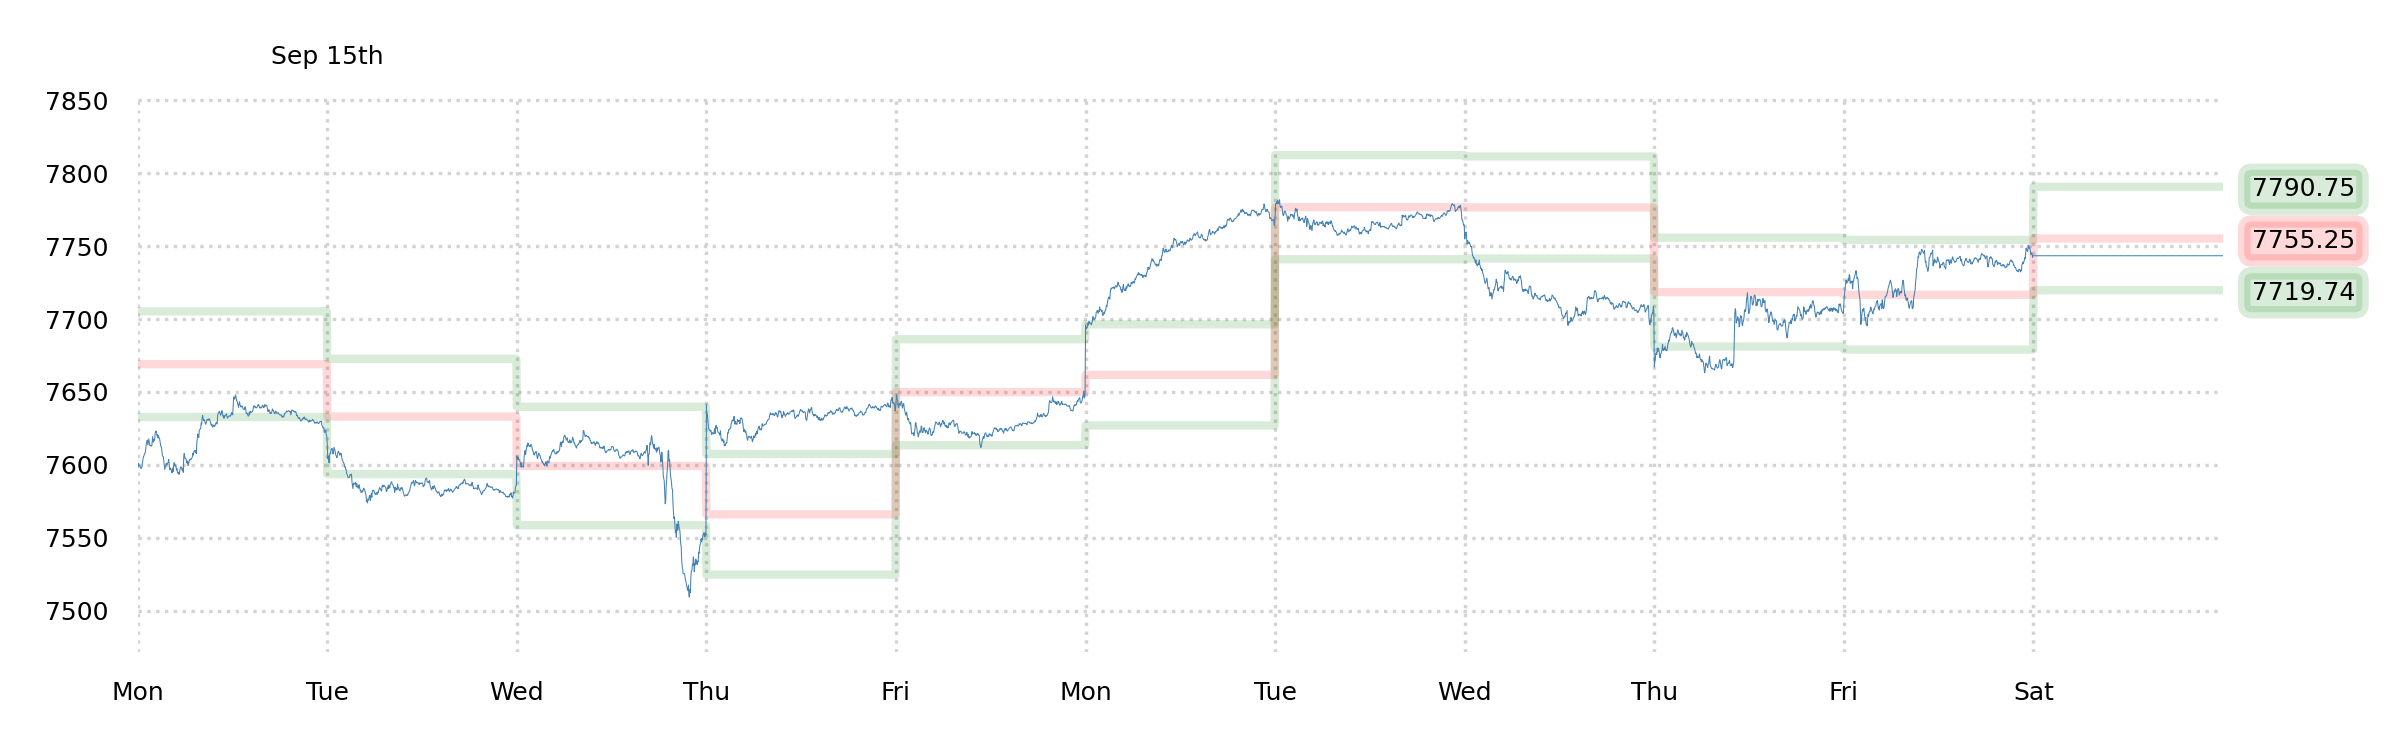 Last Friday's 1-week ATM IV was something like 9.9%. The subsequent week realized an average of 0.56% per day, or 11-12%. To be sure, "long gamma" was nominally "correct," but we didn't benefit from that (recall that we bought an OTM 0DTE put on Tuesday that didn't produce, and then sold a 0DTE spread on Wednesday that hit a max-loss). Sometimes it just doesn't work out. Continuing with the disappointments: We left off last weekend talking about how we wanted to apply some kind of storytelling method to the new SPX Chart to make it easier to dig into. What little time we spent trying to figure this out this week just didn't go anywhere. Another frustration: We'd like to casually link you to a plot of TLT flows this week, dear reader, because net option flows in TLT are something you'd want to consult after rates plowed even higher (20-year rate has got be comparable to the early '00s now!). But we can't link you to a chart of TLT flows, because we retired the old accounting system and haven't yet added the option flow data to the stock charts. The data is in limbo. Still, we're very curious about whether people were net buying or selling TLT deltas, and whether they were trading calls or puts. It's a particularly fascinating time to look at this data, so let's manually query the database, pull it up, parse it, and chart it. Aaaaand... 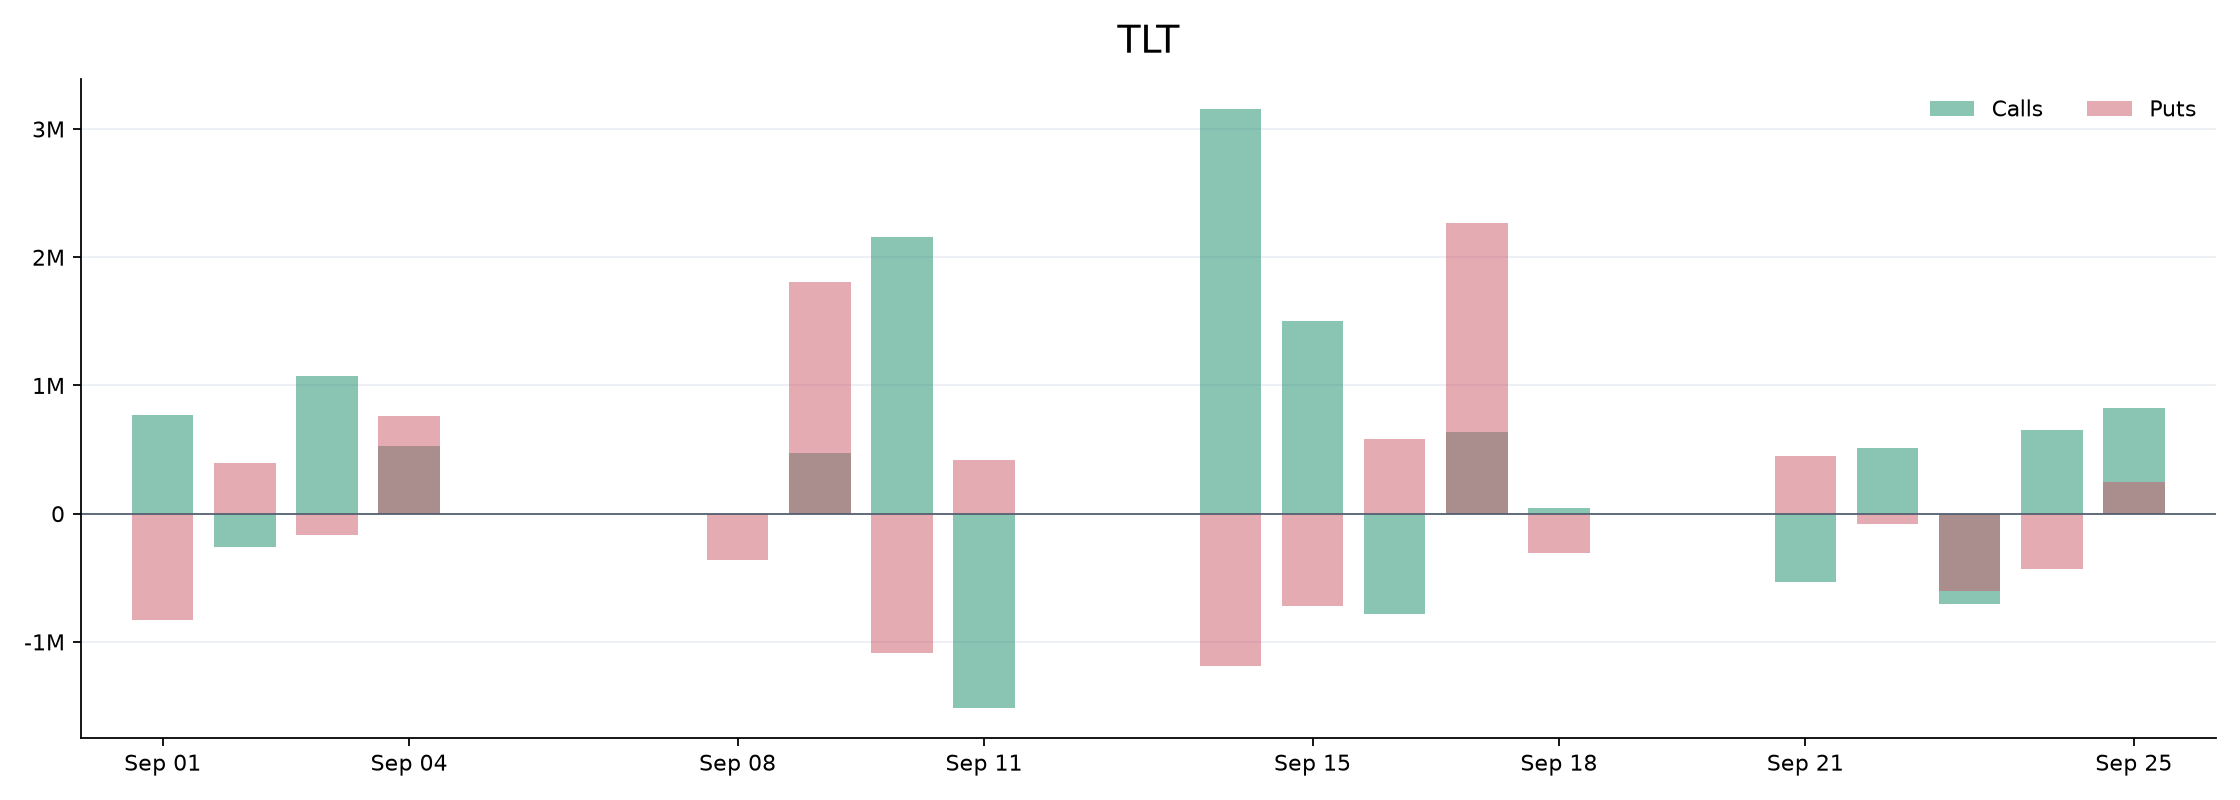 Utterly boring. Net positive deltas lately certainly haven't helped anything (particularly during the week of Sept. 14th). We usually interpret that as bearish. But this past week in particular didn't have much unique character at all. Since we're otherwise inclined to bottom-fish bonds (this is a disease of ours), we'd love to justify a long entry, but given that we think this flow data is important, we can't justify it (yet). Even the P, V, G, D, and IV data (see the Chart) agrees that lower is more likely. We'll check back in later. What else? What other disappointments can we dredge up? Well, let's take a look at Robot Jim's forecast for this coming week. 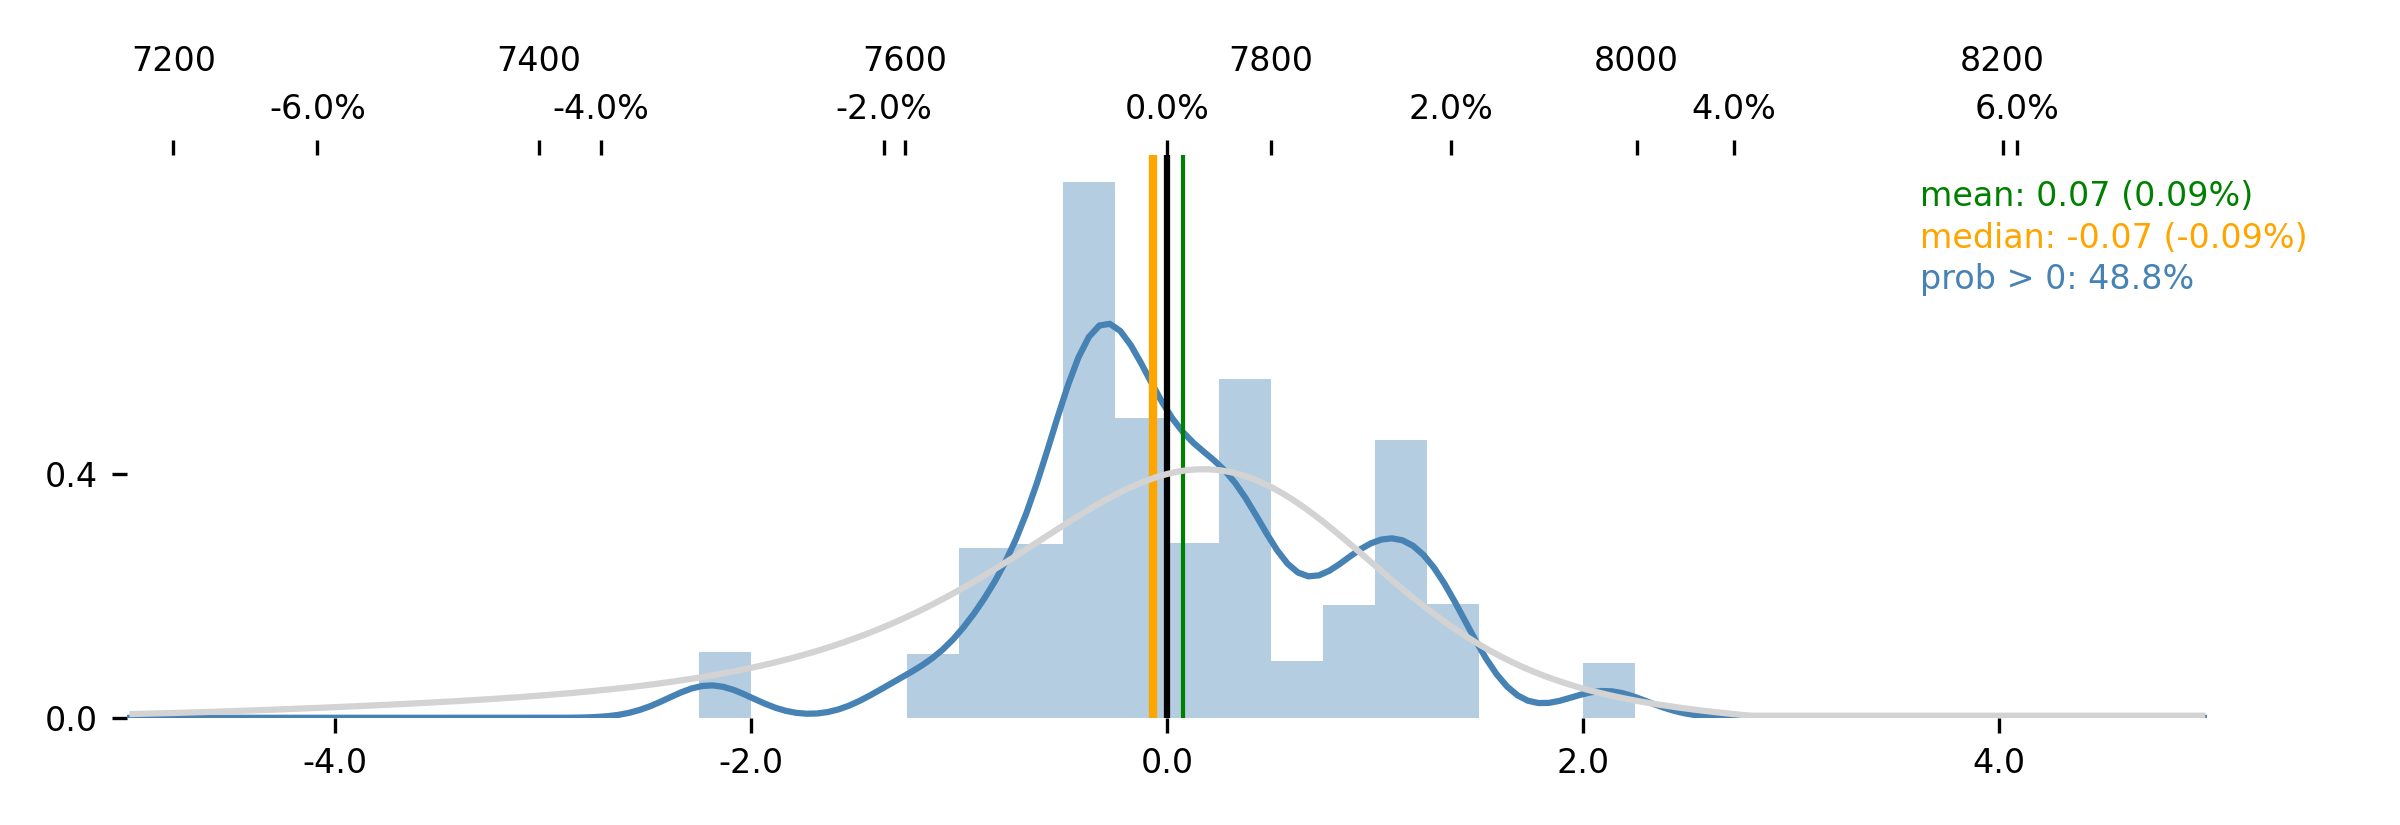 Probability of upside of 48.8%. Mean and median hovering around zero. To be sure, it's not the usual bullish-stable readout from Jim, but it may be the most boring possible alternative. Jim apparently likes the idea of a gentle move lower over the course of the week. Upon reviewing all of the PDFs and the SPX Chart, we... have no counter-argument. A "neutral" outlook seems the most appropriate, given the slew of positioning and flow data. The situation with oil, and in particular diesel, is "interesting." The situation with rates is "interesting." But it doesn't coalesce into a trade. Actually, as long as we're thinking about it (and have the database connection open), let's do the same option-flow-chart for crude oil (USO). We have no idea what to expect in these flows, so let's not even guess. Chart incoming... 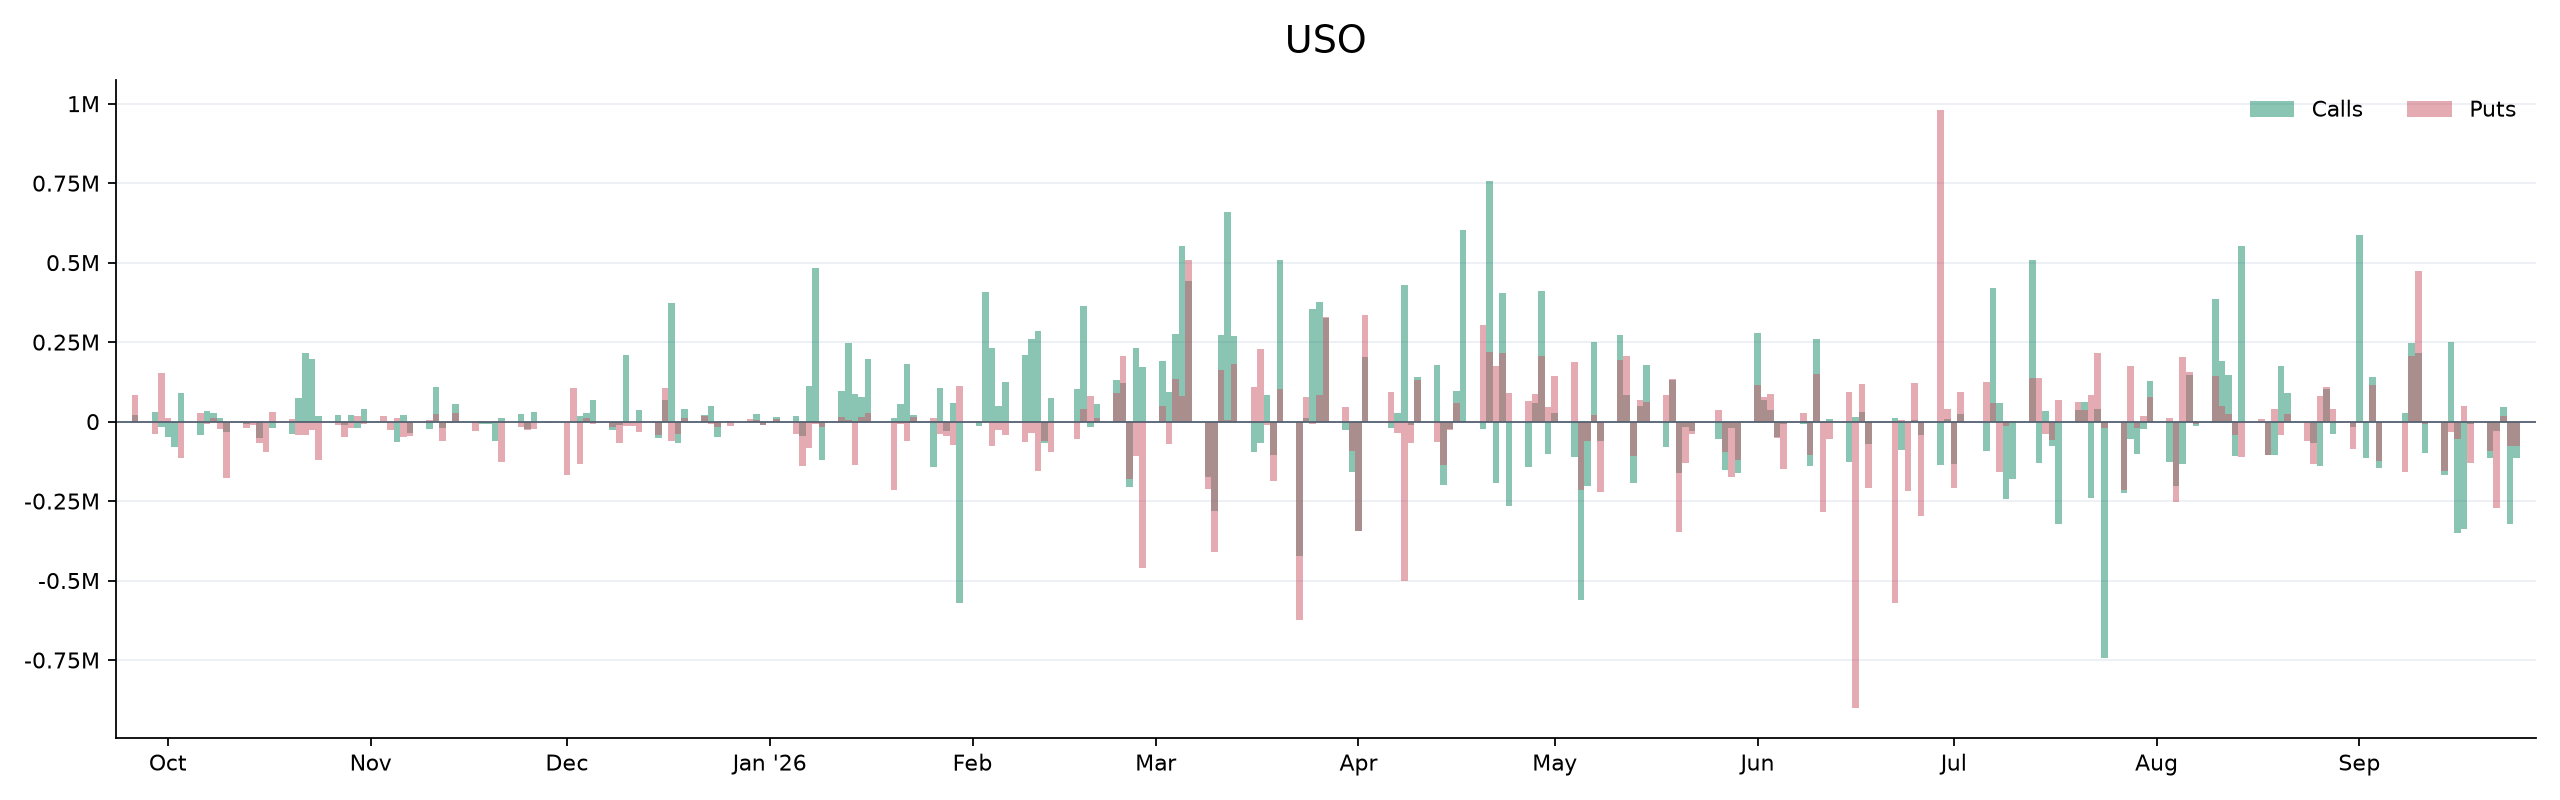 This one is kind of fun, actually. The overwhelming flow as of late is negative. Folks are selling calls and buying puts on oil. This is, conventionally, a stabilizing or bullish thing, since the average decay of these positions, or the effect of their closure, is positive delta to the market. So if there's a signal in here, it's bullish oil (and that's particularly interesting because it's not the norm for USO to be flowing -delta). We'd like to continue to refer to these option flow numbers, this directional stuff, because you can't convince us there isn't value in here (even though our earlier research was muddy). In the same way that the SPX Chart just got a whole bunch more stuff (the "dispersion triangles") injected, we plan on giving the normal stock Charts a similar facelift (by literally lifting the new code from the SPX Chart and plugging in these numbers). Consider, e.g., the idea of sorting and segmenting a stock/ETF history by "high IV, strong call-buying" versus "low IV, strong put-selling," etc. Tantalizing. And so whenever we get a moment to stop bailing out our boat, when the weather settles for a moment—know that we'll be working on integrating this stuff, bit by bit. We now have no index-level position. (You're supposed to sit on your hands when you don't have a good trade idea, right?) Enjoy the week. The SqueezeMetrics Team |