All the charts and data we refer to can be found on the Yacht Club page.
Hey everyone,
Many of you have asked what you should be thinking while using the k-scope. How do you use it? What's the logic?
Since we're very skilled in the art of stream-of-consciousness word-dumping, let's try to explain one way to approach it—but this time, in video format. Sound fun? Yes, fun. Video!
Let's begin our line of reasoning with a cynical reduction that we always have in the back of our minds, and yet which we have never shared before:
Prices respond only to fear.
We mean this quite literally. It could be a "fear" of some negative circumstances related to the asset in question, like wars or bad weather, or bad earnings or bad management; or it could be a fear of the price decline or volatility of the asset in question, regardless of other circumstances. Or it could be a fear of personal circumstances and liquidity, owing to correllated assets' performance. These things cause people to sell stuff, pushing prices down.
But fear also makes prices go up! A fear of "missing out" on a hot new stock. A fear of losing money to inflation by not being fully invested. A fear of not having enough income/yield for retirement. A fear of being overinvested in conventional things, and needing alternatives. A fear of client complaints, or redemptions, if you're not exposed to enough risk while the market is rising. A fear of losing your job or your house or your wife or your dog if you're not taking enough risk to maximizing your payout or at least break even.
Fear, thus, drives buying and selling decisions, and even when you get all technical, it's fear that bumps the vol surface in all those funky ways, adding strike-wise skew where there wasn't before, or adding a premium on the time axis. Fear informs every edge and premium that can be exploited or harvested in the market.
Is this an oversimplification? Yeah, maybe.
But let's work with it for now, because it may have enough explanatory power to be useful.
Now let's do a two-minute walkthrough of a fun example of "fear" in the market that we just ran across.
But first...
- T–5
- T+5
- SHOO
T–5
Last weekend, our thoughts were that...
- it looks like Trump is winning the game of Chicken with the market
- it looks like PMs are going to hold on to their butts and hope the S&P goes up before selling
- it looks like we can bet on upside, and maybe we can do something cute like buy Industrials.
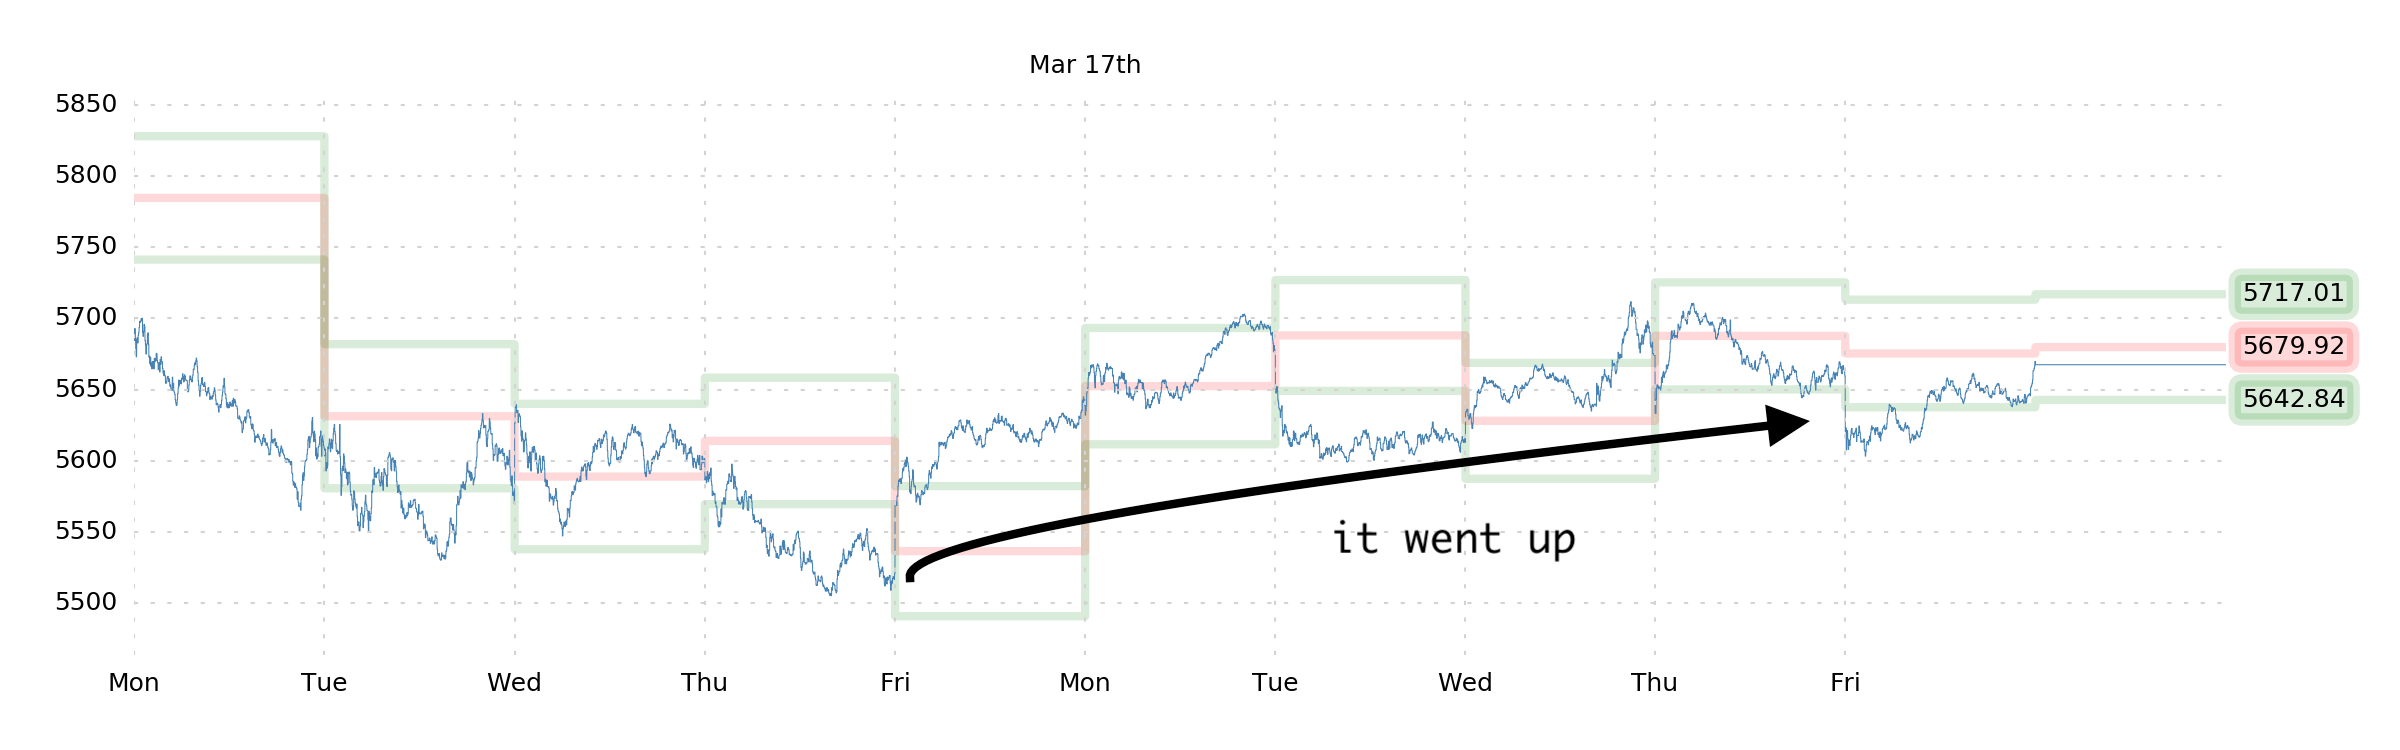
Over the past week, the market's up a touch, and so are bonds. Since we've been long both stocks and bonds, that's nice. This tracks with our understanding that Trump is not blinking, and the market is responding favorably to that—though we'd expect a bit more rallying than what we got. This also tracks with our understanding that a lot of portfolio managers are anxiously waiting for a rally before selling. So that's nice, too.
The right sector to buy for the week, though, was Energy. We missed that completely. (Industrials did fine—better than most sectors—but nothing exciting.)
In any case...
...the S&P went up like we were hoping. And being right was a nice change of pace after two consecutive weeks of red PnL.
We left off on Friday like this:
With our long SPX exposure now swapped out for a few OTM calls, our positioning is now "long SPX gamma, long bonds."
We own OTM calls, ATM calls (delta-hedged), and bond futures.
Is this still the right position?
T+5
Yeah, we think so.
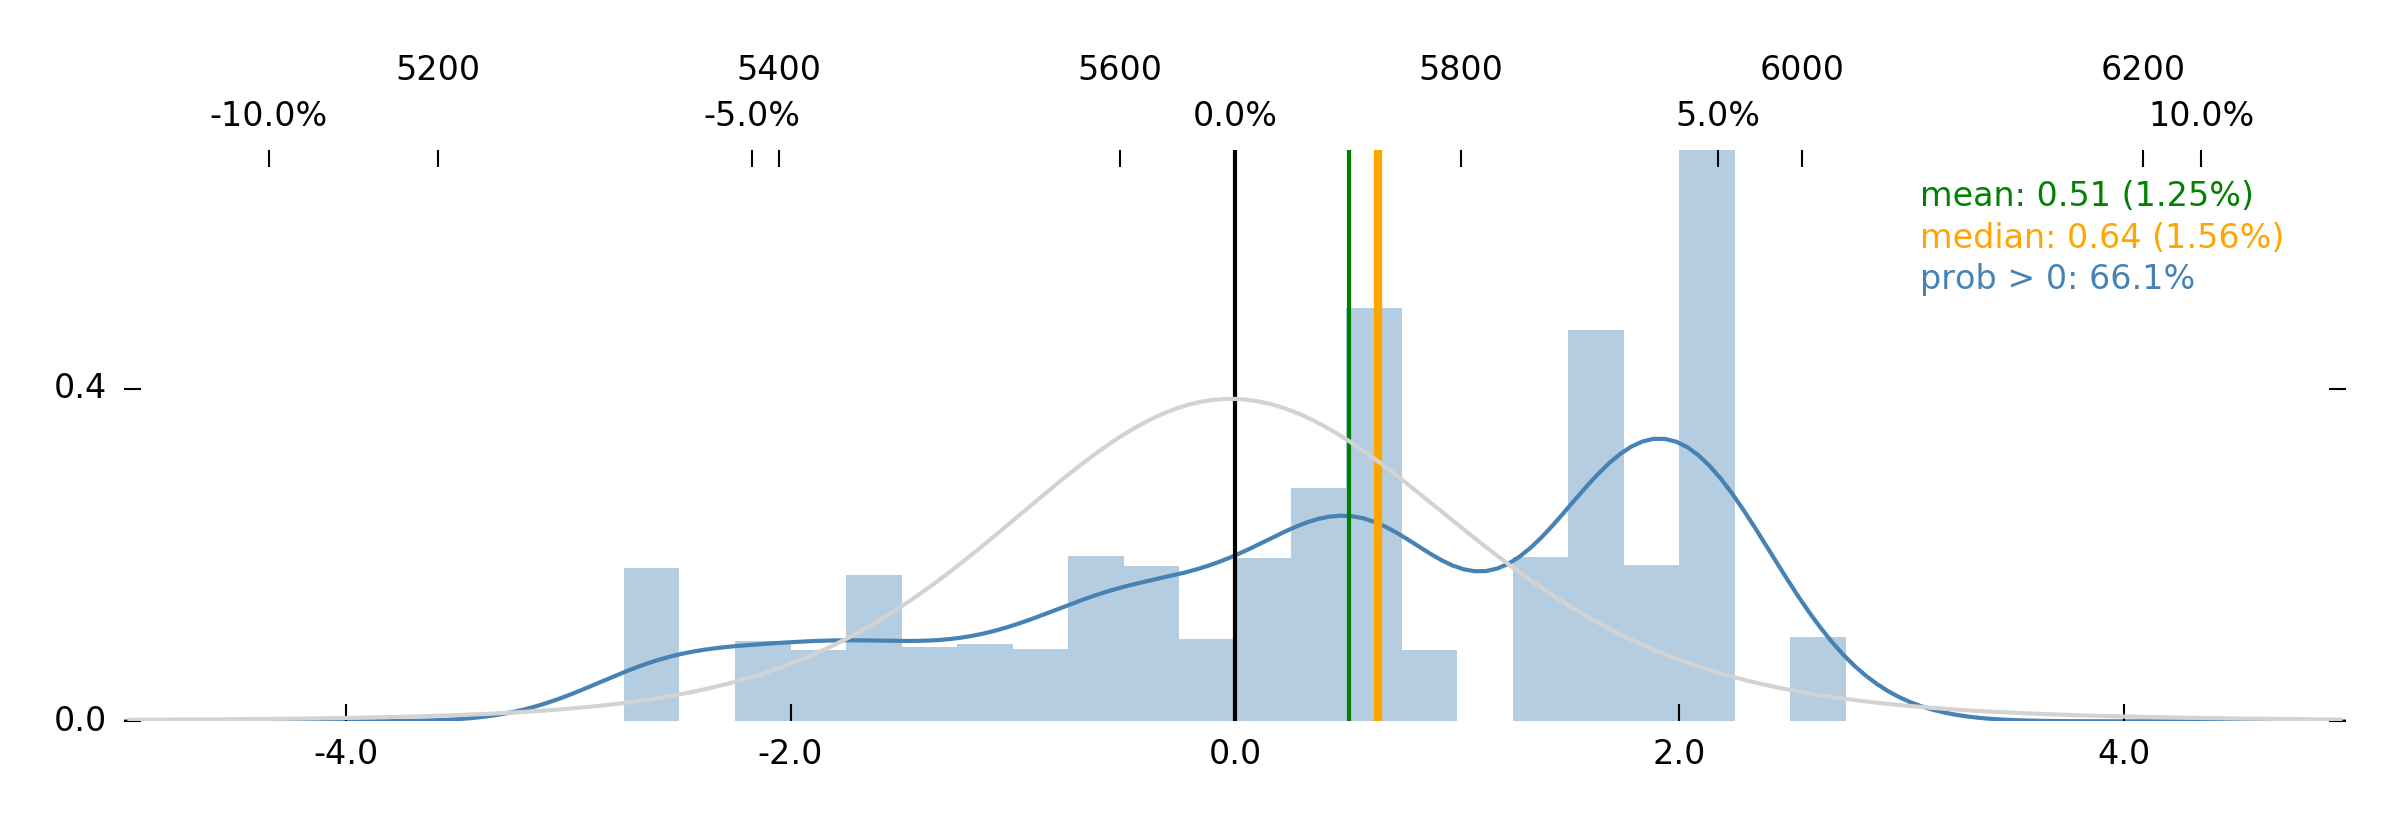
Jim strongly encourages a long OTM call position, with a striking bubble of probability up there at +2.0 MAD. Yet, at the same time that Jim thinks the 5.00% weekly gain is underpriced, he also thinks the 5.00% loss is underpriced. That means he thinks we should be long gamma and long delta.
We're already there with our calls, so we're chuffed to see this distribution. Nor do we have any counterpoints. Certainly, we believe that any rally is likely to revert over the next two or three weeks (because of the delayed impact of low VIX on the last selloff)—but we also believe that a rally is the natural thing to happen right now. The path of least resistance.
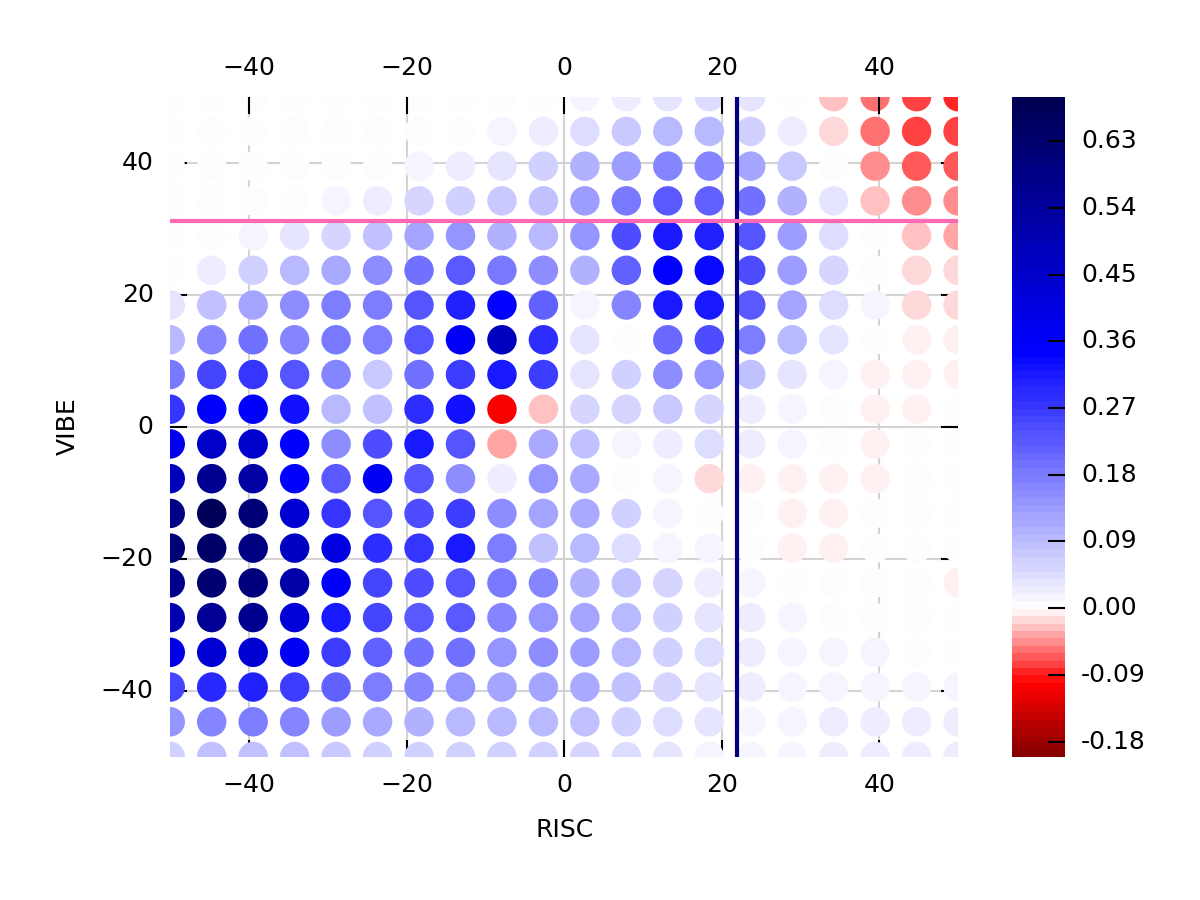
We find no meaningful counterpoint to this in the data, broadly speaking. But it is worth bringing up this particular heatmap again, as an illustration of one of those points.
As RISC, the "Realized-Implied Spread Calc," continues to rise, we get closer to the red zone in the top-right, which predicts iffy 1-month returns. We expect that, if SPX keeps rising, we'll get there soon—and the more volatile the upside, the faster it'll happen.
This is relevant because those aforementioned portfolio managers, who feel betrayed by a 10% S&P correction that only pushed VIX above 25 momentarily, are going to respond to upside volatility more strongly than simply upside (since trailing realized vol stats will rise more and faster if there's fast upside, and that will more quickly trigger more sell signals).
So if we're right this week that the best bet is upside volatility, we're going to have an anxious couple of days where we wonder if we ought to be taking profit. On the other hand, if we're wrong and the market just stays flat or something, then we will calmly sit here and lose money. There's no way to "calmly" make money this week.
Actually, speaking of calmly sitting here and losing money, our long bond position is, right now, down a couple of basis points. The
new data from CFTC has 153,000 "dealer intermediary short" positions in Ultras, up from 135,000. This serves only to bolster our long thesis.
Long SPX calls, long bonds.
SHOO
Prices respond to fear. Fear drives things. Our job, then, is to identify what "fear" looks like in any given asset, and then to try to really understand what that means about the type of people who are active in that asset, and the type of trade we should be trying to make—because it's our job to profit from fear.
In something like the S&P 500, we already have an idea of what "fear" looks like, and how to exploit it. Since the S&P is a pretty sophisticated asset class, the market for insurance on S&P is where you're going to find "fear" (e.g., in option prices, or in the spread between realized and implied). In a simpler stock with a less-complex volatility ecosystem, you'll often find fear in simply "falling prices" or "rising realized volatility," both of which can frequently be exploited by simply buying into that fear.
But since it's less intuitive, we're more interested in looking at that variety of fear that drives people not to sell things, but rather to buy stuff in a frenzy. Certainly, we understand already the Warren-Buffett–ism to be "greedy when others are fearful," suggesting that it's clever to buy stuff that's getting sold by the weak and scared and margin-called—but it's less intuitive to see "fear" in the FOMO stock buying, or call-buying. Heck, we even think it's "fear" that motivates people to sell puts and calls for income (the fear of a PnL that doesn't show regular "progress"). Most people would call this stuff greed, but we're soft-hearted enough to think that most "greedy" stuff is borne out of fear. Human anxiety and such.
Anyway... during this recent downturn in Consumer Cyclical stocks (it's been a bad month for them!), the stock price of
Steve Madden Ltd (SHOO) caught our attention. Why? Well, because it went down quite a lot, but also, because whenever we see SHOO, we think of that masterful
scene from
The Wolf of Wall Street where "Donnie Azoff" is drunk and loaded on
Quaaludes and struggling to form the words "Steve Madden." Later in the film, they're IPO'ing and pumping the SHOO penny stock.
It's funny that SHOO still trades today. It's even funnier that it's still, somehow, a case study in FOMO.
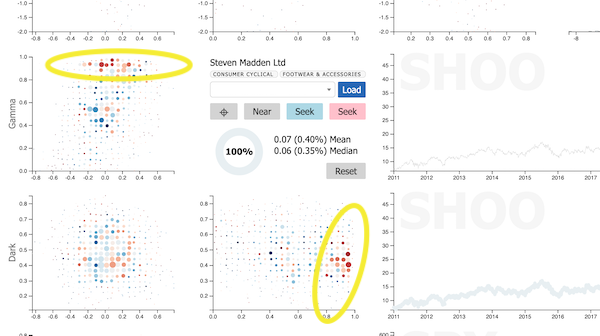
Here's a video that walks you through why SHOO is such a good example of how "fear of missing out" manifests itself in the data, and what it means about returns.
Unfortunately, it doesn't look like SHOO is a good trade right now (because call gamma is actually too high), but as connoisseurs of catching falling knives, it's on our watchlist.
Regardless, what's important is that there's a very distinctive pattern in the data here: That too-eager buyers are always arriving from every direction to buy SHOO, ostensibly due to a fear of missing out, and they're always getting rug-pulled when they do it.
The lesson translates beyond Steve Madden. Fear concisely explains just about every pattern-forming tendency in the data, and understanding things this way allows us to empathize with the traders and investors who are responding to these stimuli. And empathy is how you make money. Golly that sounds cynical—but it's true.
So try thinking and clicking on some data with the "fear explains everything" mindset. It's... useful.
Enjoy the week!
The SqueezeMetrics Team