All the charts and data we refer to can be found on the Yacht Club page.
Hey everyone,
Depending on who you ask, summer is over. We don't think summer is over. We would rather adhere to the autumnal equinox as our demarcation. And everyone who is already thinking about Pumpkin Spice Lattes and Halloween can get bent.
But despite the fact that we believe in eternal summer, we're still short the S&P 500. Let's talk about that. Specifically, let's try to back up our thesis from last weekend (where we decided to get short) with some numbers—if we can.
But first...
- T–5
- T+4
- Some Numbers (If We Can)
T–5
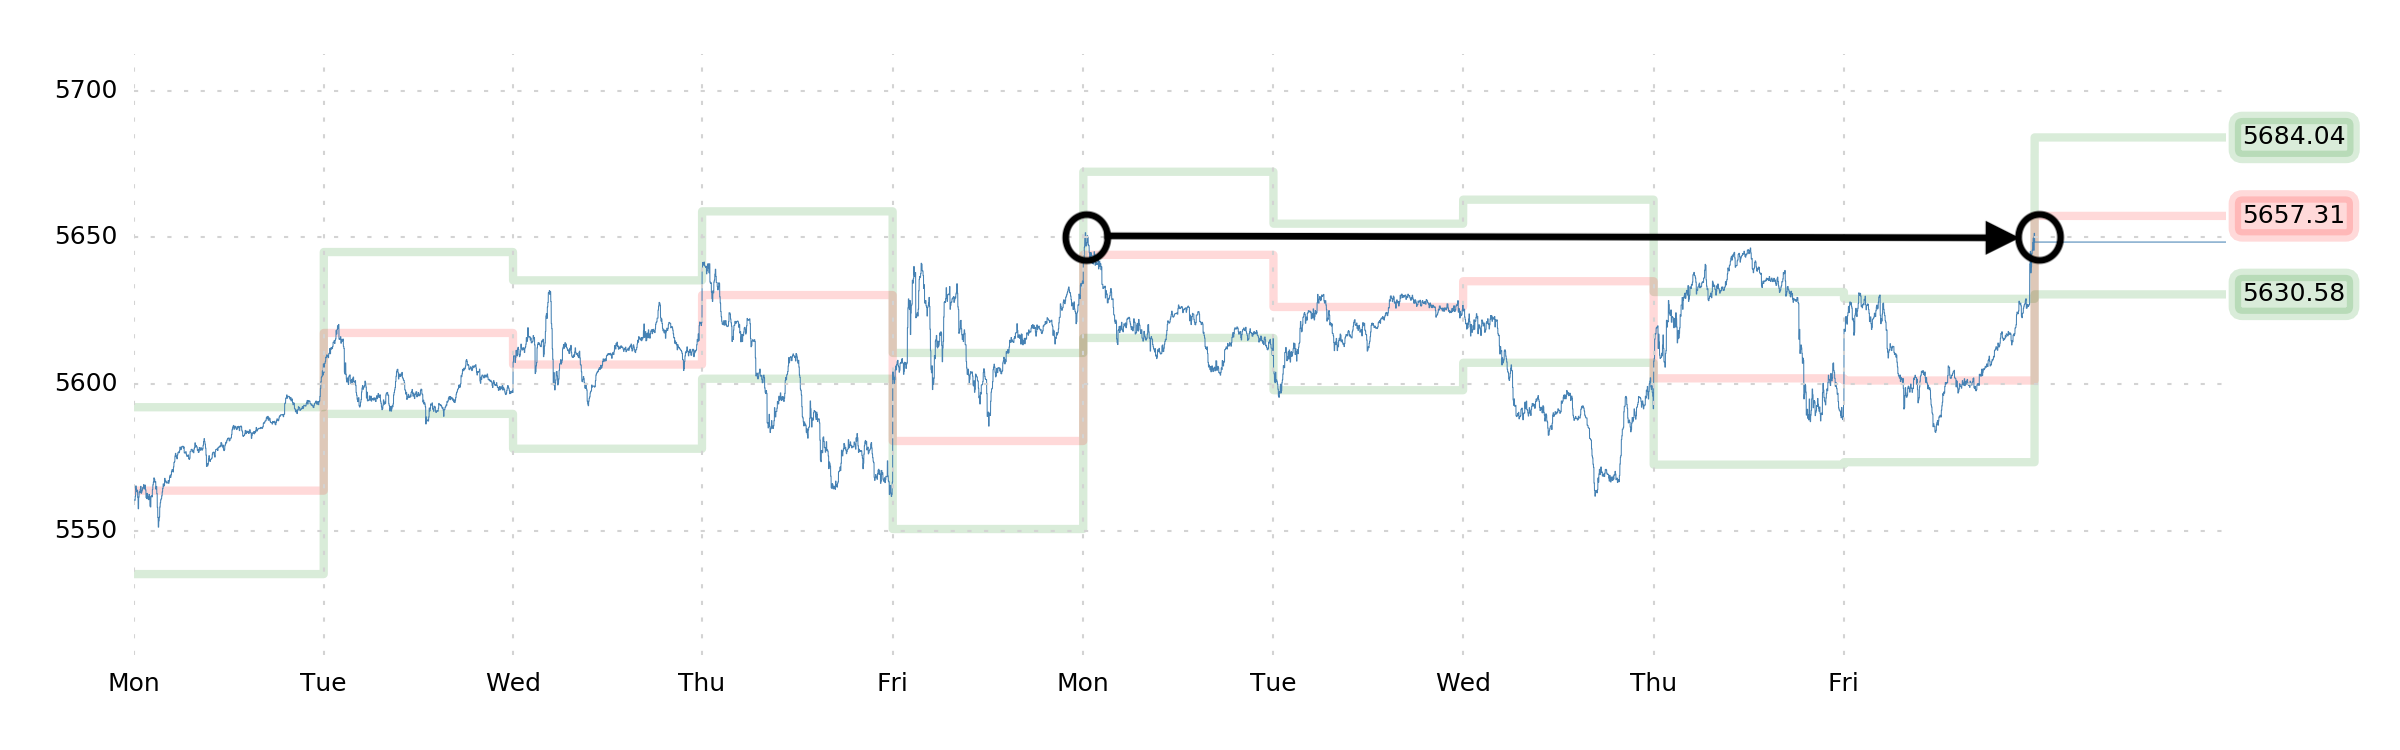
Our thesis for the week was that we wanted to be short. It was that simple. So imagine our disappointment when the week ended right where it started.
That means our puts lost a week of time-value and that's about it. We're not sure anything that actually transpired during the week is worth recounting—so let's continue.
T+4
It's Labor Day. Ostensibly, this is some kind of concession to the communists—a picnic day for the proletariat. But in the grand, cosmic tug-of-war between Labor and Capital, this missive and its bourgeois sensibilities cannot persuasively claim to be on the side of the working class and their struggles. And so we are obliged to sneer and tut at the occasion for the short week ahead.
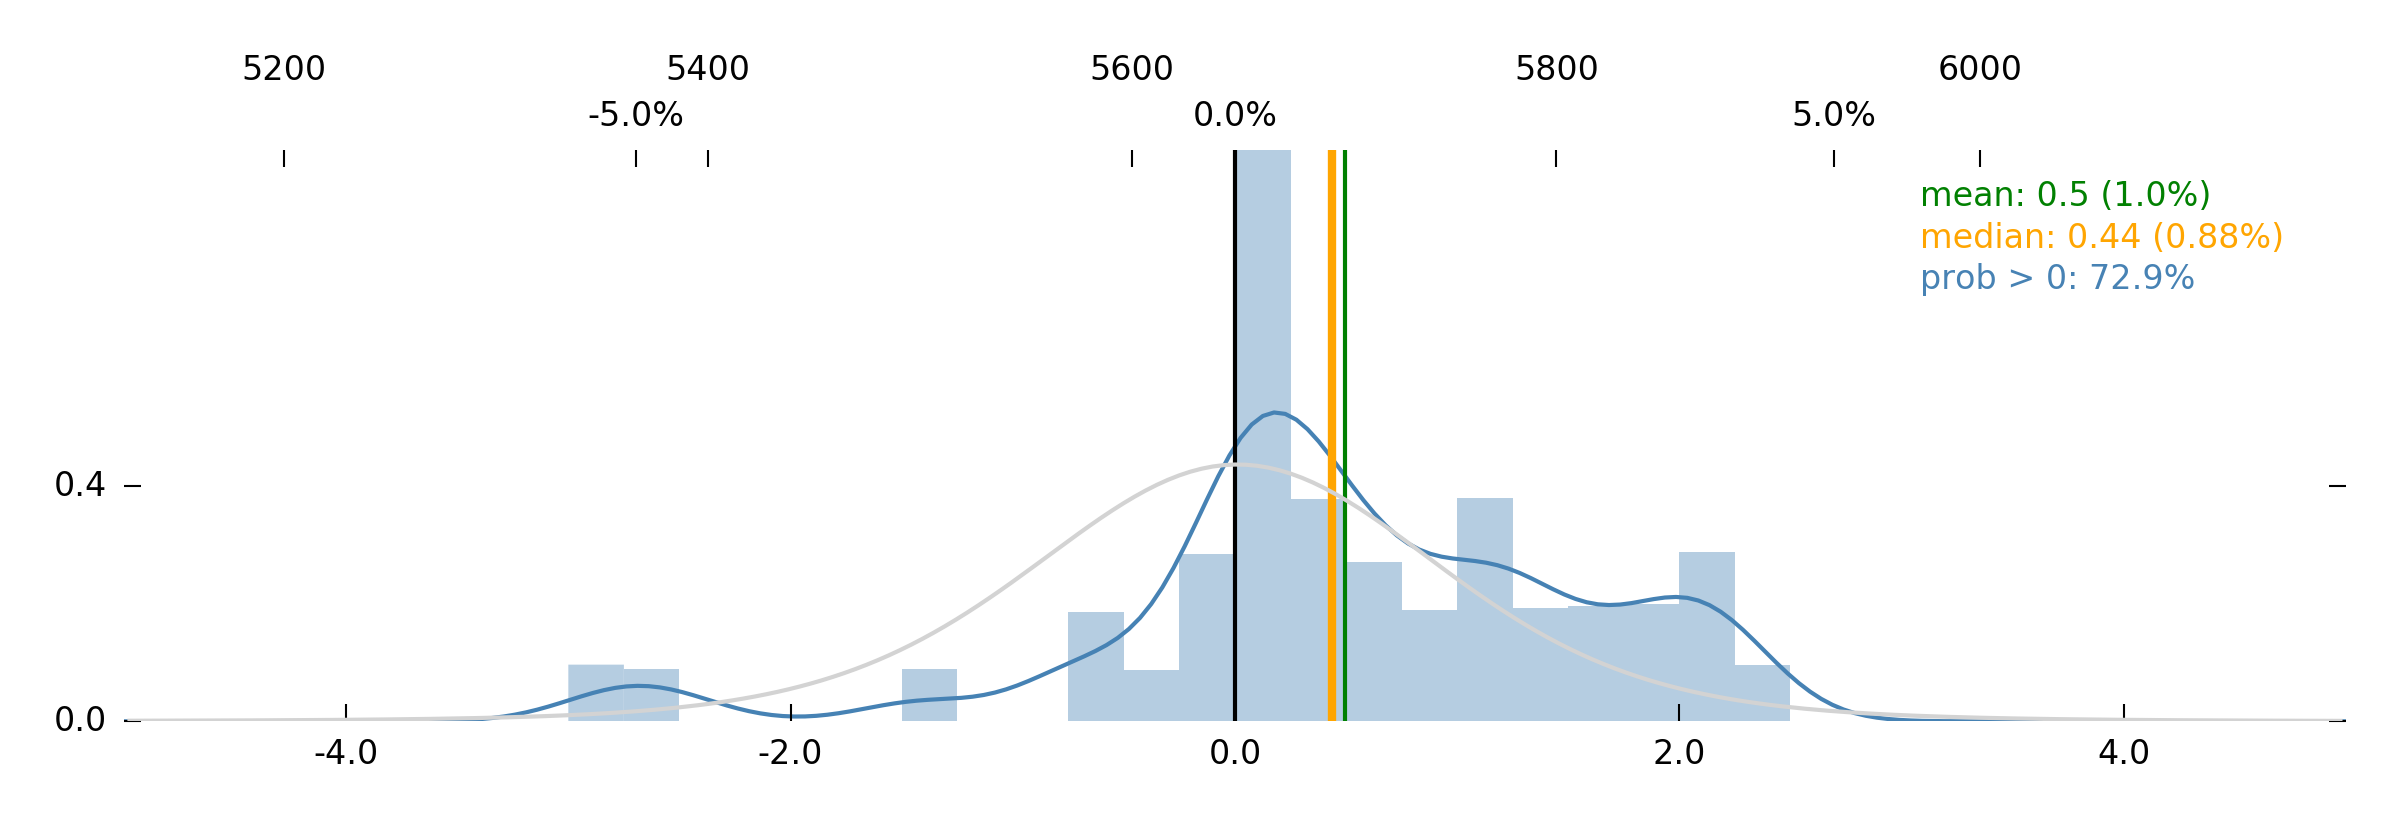
Unfortunately, the "capital" that we exercise ownership over at the moment—a smattering of 1+ month OTM puts—isn't generating a return on investment. And our friend Robot Jim is still against us in this matter. Workers of the world, apparently, unite on a 1.00% mean 1-week forecasted return.
As before, Jim's forecast is strong; and as before, our disagreement is a matter of a very particular set of circumstances which we believe matter more, given the nature of the recent volatility and the attending action in VIX. (More on that in a moment.)
Elsewhere, it is a struggle to find meaning in the data. Bonds are still rather uninteresting (net option selling in TLT, but no increase in dealer short positions in CFTC bond futures data). SPX put flows exhibit the same pattern as they have for a long time now, to which we seem doomed for eternity. GEX+ is above $1bn, but it's disinclined to rise with prices.
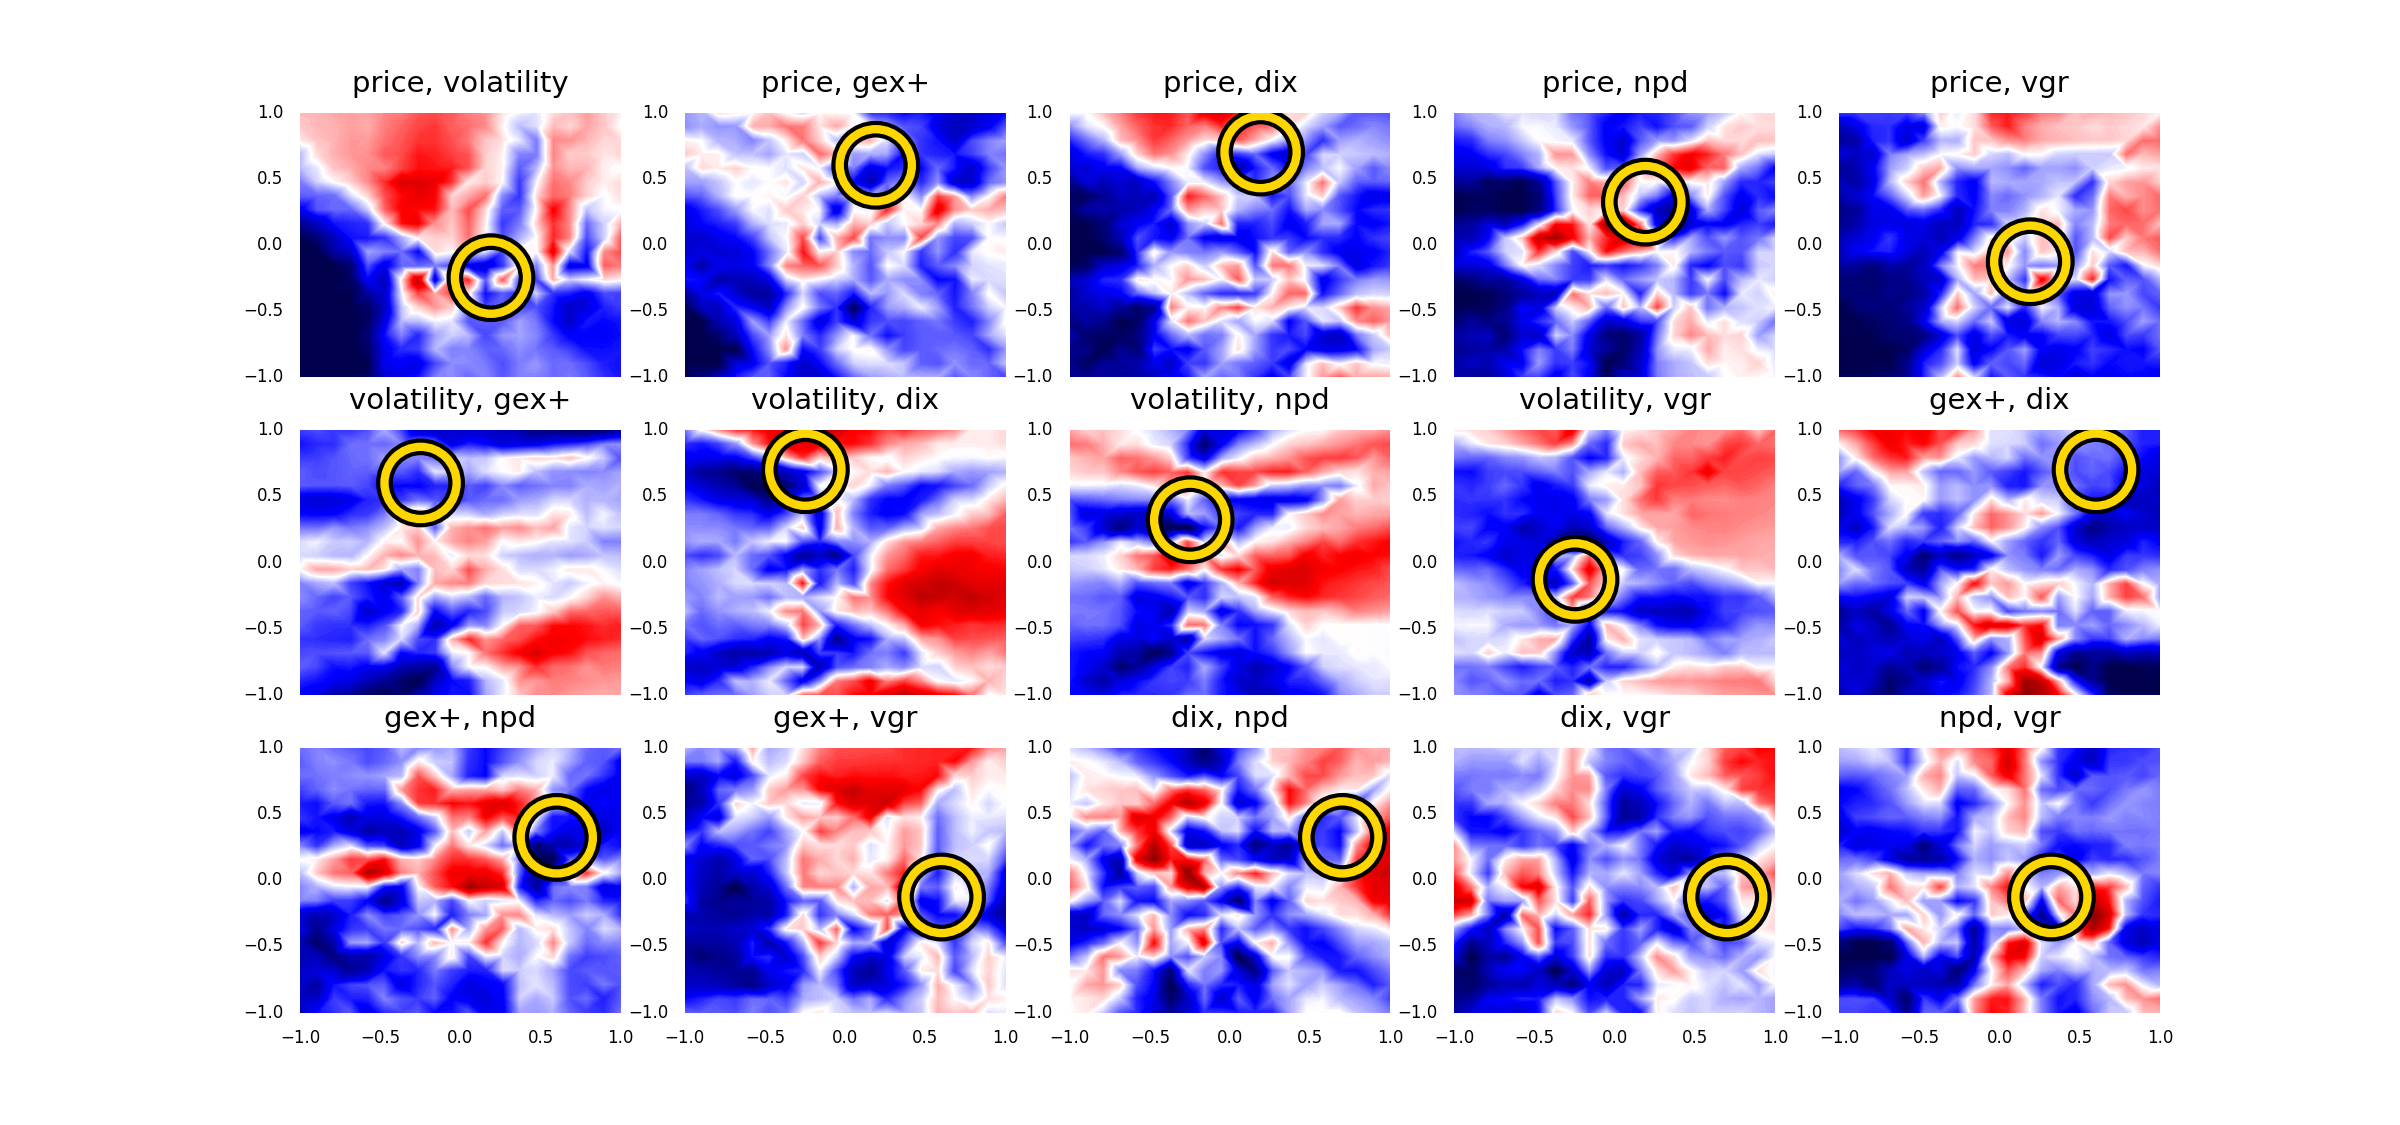
When we look across all the data pairs for SPX and their bull/bear tendencies, we note that the most important consideration appears to be Price itself. If Price were to fall, that would be bad for the forecast.
Similarly, if GEX+ were to fall, that would be bad. Though there's generally a correlation, this does not always correspond with Price—especially as concerns OpEx—but it should indeed correspond with price right now, since there's no huge OpEx at hand. So we're in this situation where Jim will essentially only give us a bearish forecast if the S&P falls a couple percent first.
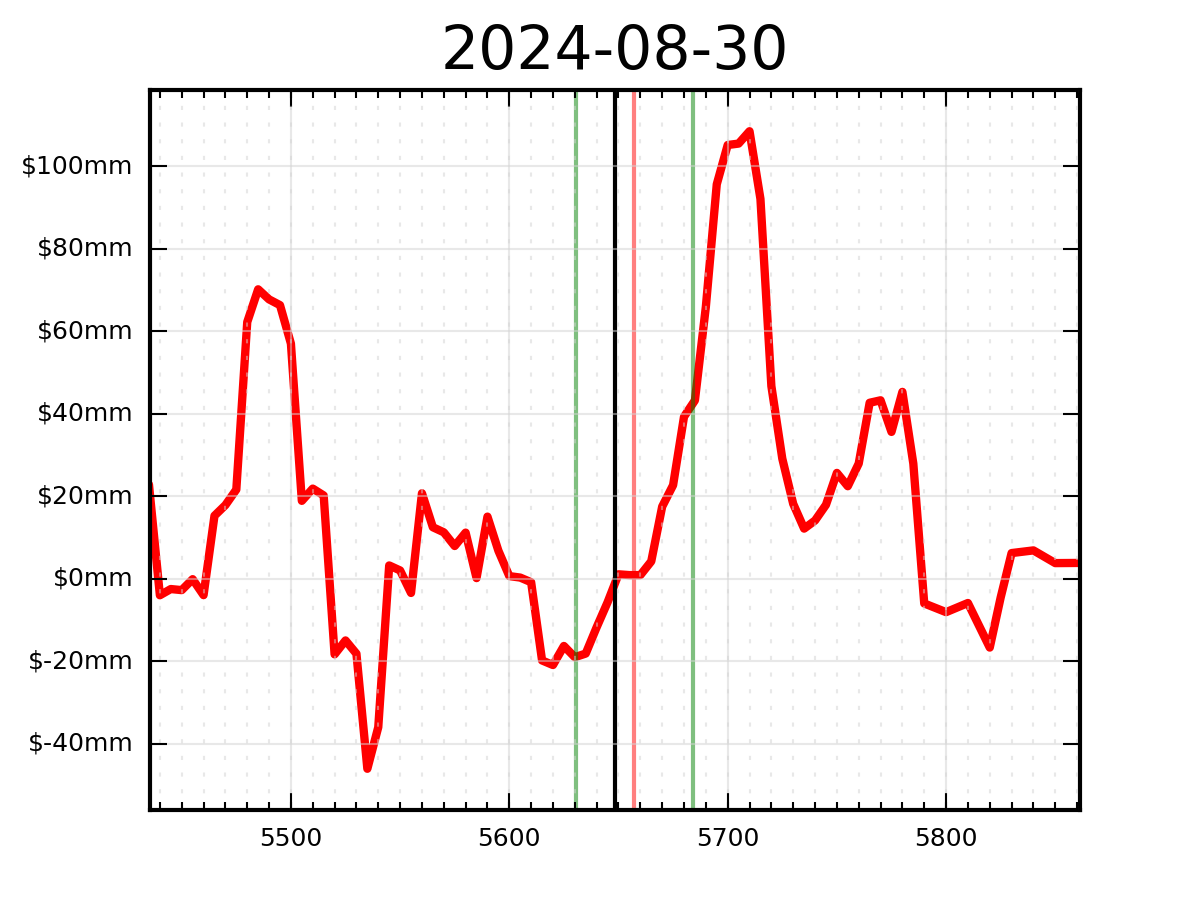
On the side of Labor is also the 0DTE data for Monday.
A nice ramp materializes above the Mid band (c. 5665). An artifact of bought calls. We will be forced to buy E-minis for an intraday trade if these levels are achieved.
We hope that this does not become a trend this week, however—lest we be reduced to casually imbibing Frederick Pabst's "Blue Ribbon" Lager and discussing sporting events, or whatever it is the Labor class does for recreation.
Holding puts.
Some Numbers (If We Can)
We're bearish for the same reasons stated last weekend. In summary:
A month ago there was a substantial spike in realized volatility. At the time, the
Volatility predictor logged +0.40, which only happens about once a year, on average, and means that average daily moves over the course of the month prior were 0.40% higher than the same stat exactly one month earlier. Big difference. Big increase in volatility.
Our assertion was that this is associated with subsequent downside in SPX because VIX—by not tracking SPX realized volatility—isn't doing a good job of helping portfolio managers hedge during the event anymore. And so there's deleveraging after the fact. Let's test this, to the extent that we can!
So first, let's look at the right time period and the right range of Volatility. When we tested the relationship between VIX and RISC
a couple weeks ago (which is where we got the idea that the tracking error between VIX and SPX RV was problematic), we split the data at 2015 for simplicity, to make the point. But if we were able to
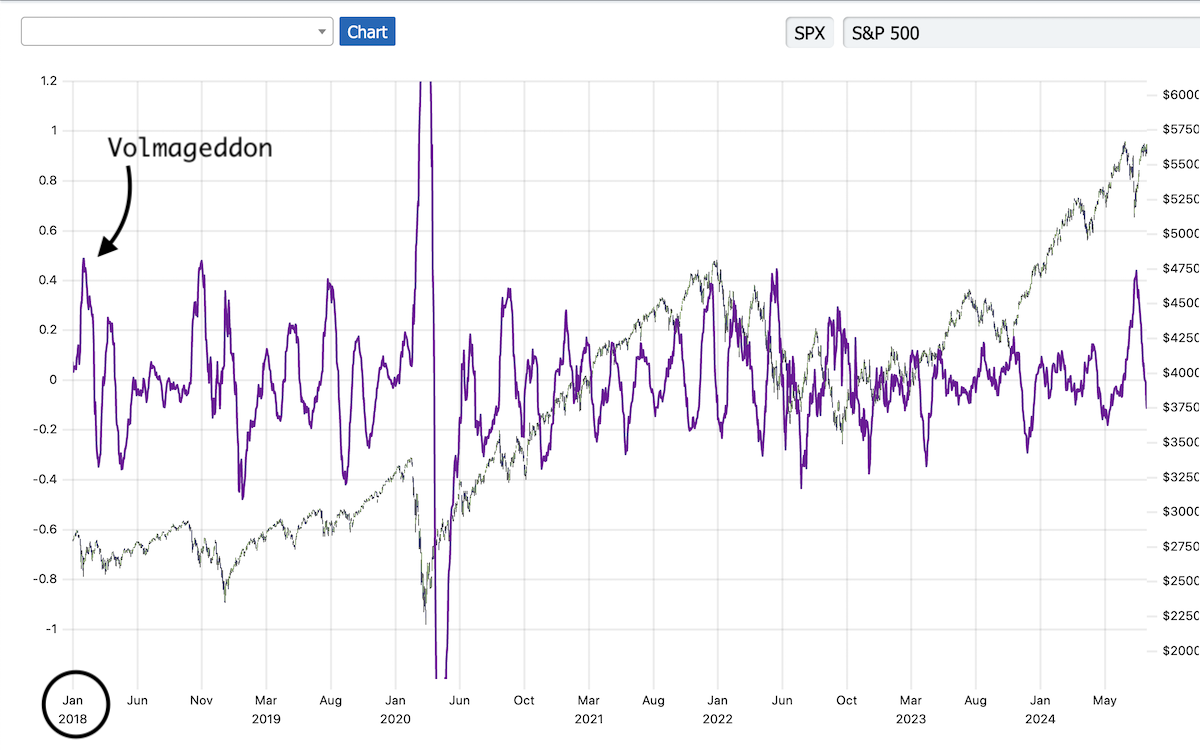
choose a date, we'd choose Volmageddon, at the beginning of 2018, for when VIX "broke."
Now, since the pre-2018 landscape is not rich in instances of a Volatility of +0.40, let's go with our gut and look at the data from 2018 to present, which we believe will represent the most egregious failures in VIX to match S&P realized volatility.
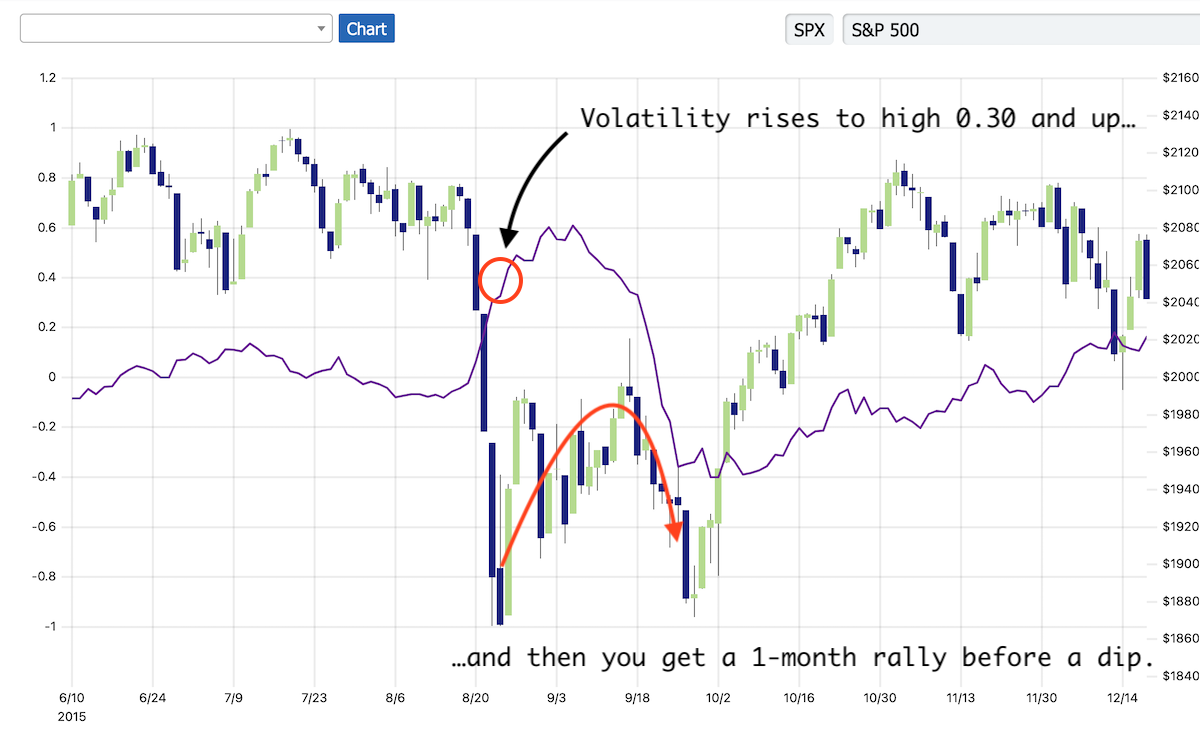
Besides, if you look at the one time between 2015 and 2018 that Volatility was jumpy, it actually exhibited the exact behavior that we're anticipating right now.
So let's just say that we can ignore this older instance as probably illustrative of the same phenomenon, and then let's skip ahead to Volmageddon.
Here's the data we want to consider: 2018 to Present.
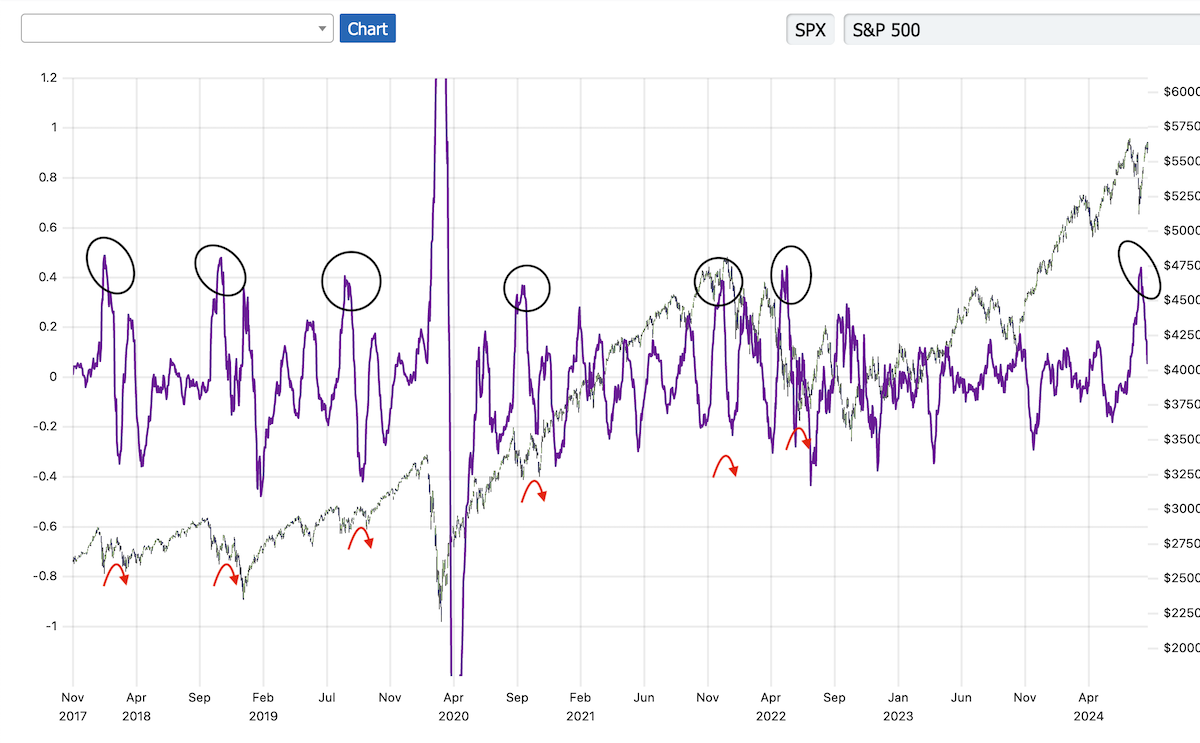
See every time the purple (Volatility) line is poking a bit above 0.40? Aside from the Covid crash in 2020, this describes just about every volatility event, and it's also what just happened a month ago—so that's what we want to consider. So for the sake of testing, let's say that we're interested in the region above 0.35 and below 0.50 Volatility—a generous enough area to give us a little cloud of data to consider.
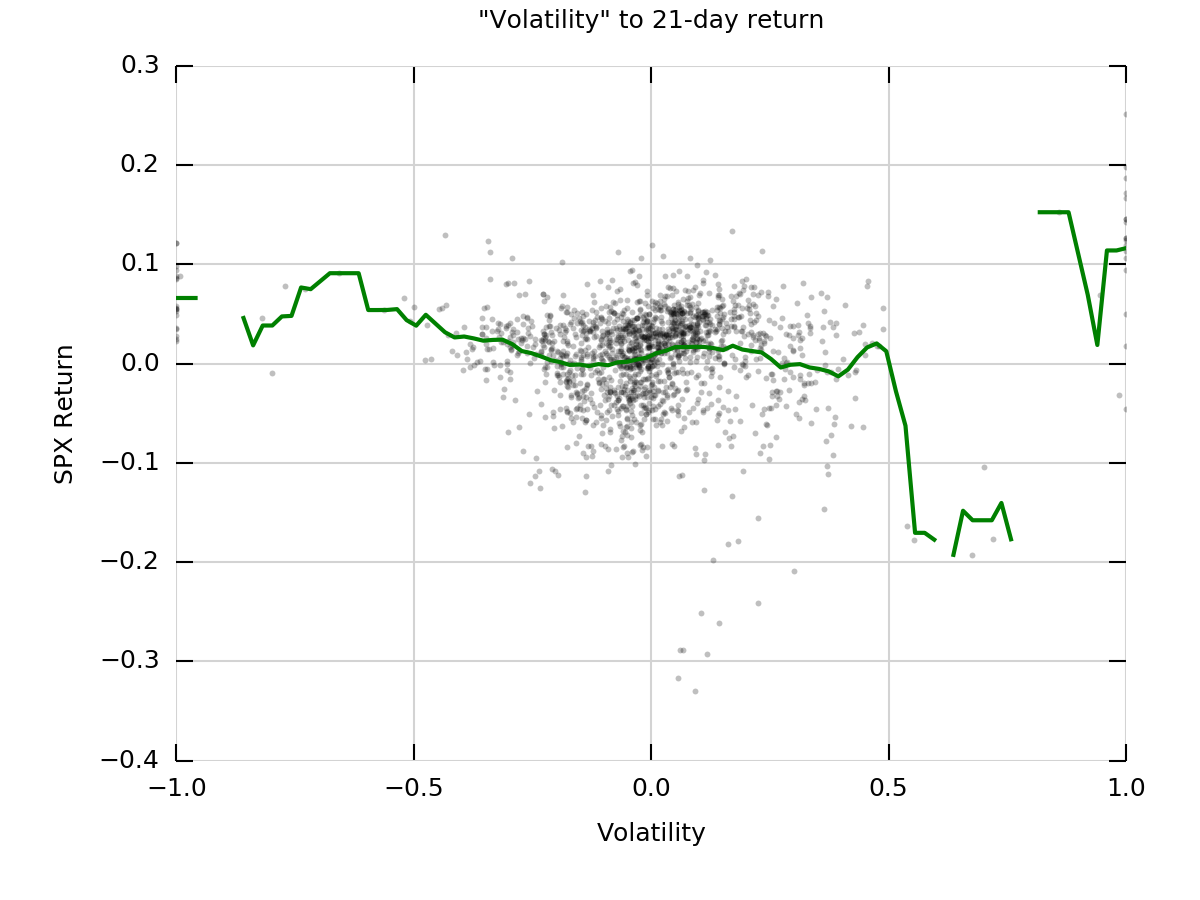
So let's grab the "SPX" ticker from the API and start charting. What we want to see is a scatterplot of the Volatility predictor by 1-month forward SPX returns. Let's do that, and let's add our usual mean bucketed return line.
Ok... interesting. Notice that the best SPX returns are associated with rapidly falling realized volatility (the left part of the chart). But then the area that we're interested in right now (the area just to the left of 0.5 on the x-axis) also has some nice returns. Since the y-axis is simply denominated in percent, we're talking about mean 1-month SPX returns of something like 2.50% when Volatility is around 0.35 to 0.50.
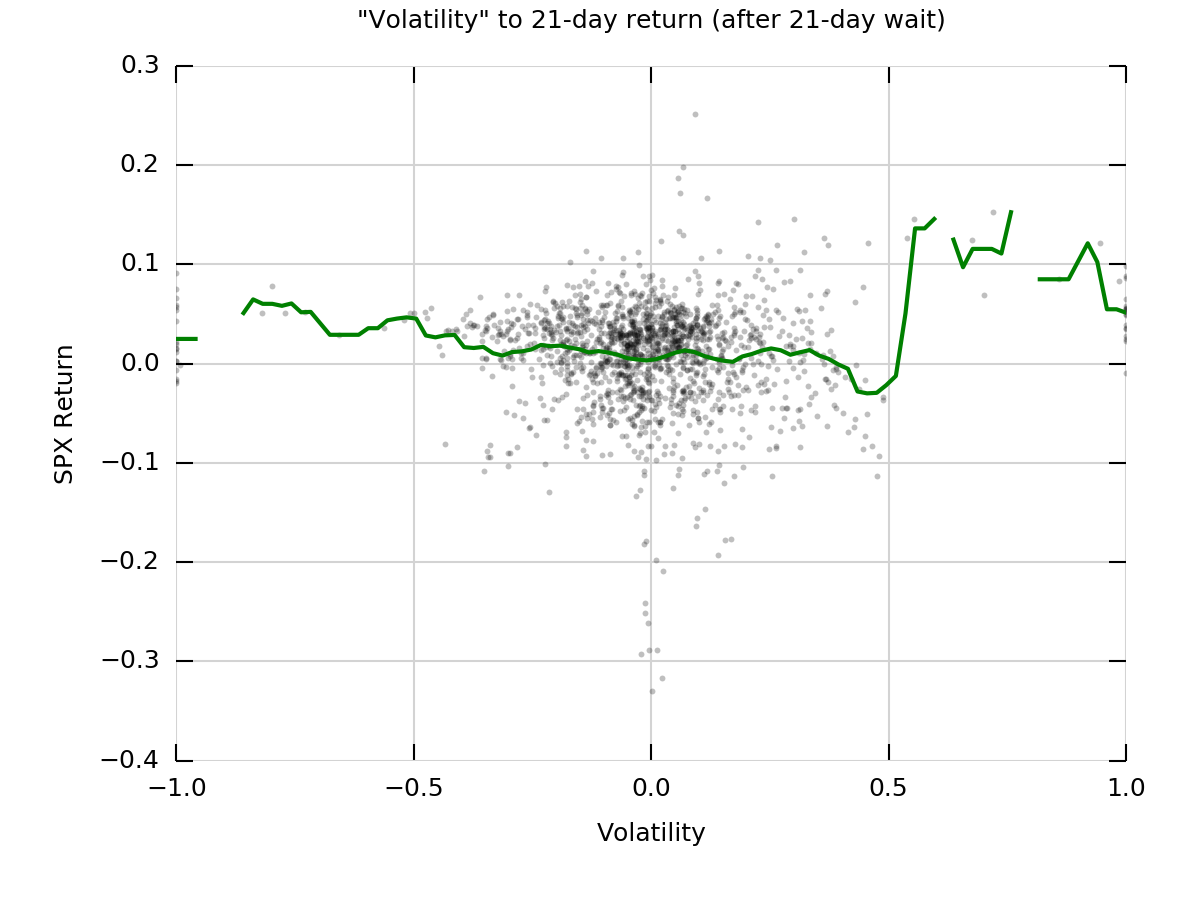
This is a start, because it tells us that the "initial rally" (when underhedged and overexposed portfolio managers are clenching their cheeks and holding on until the volatility blows over) is indeed a feature of upticks in realized vol over the last few years. Now, of course what we're actually interested in is what happens next. So to test that, let's do the same chart as above, but let's add a "forward-start" to the returns data, so that we're looking at 1-month delayed returns.
A-ha! Look! The only place on this chart where returns are, on average, negative, is when Volatility is... just under 0.50! What that means is that while yes, on average, there's a rally after realized volatility rises substantially (Volatility 0.35 to 0.50), there's also, on average, a strong reversion to the mean afterward.
This is a pretty neat illustration of what we were thinking
last weekend.
We suspect that this also betrays the "bad behavior" that we were talking about. In the absence of a VIX that "works," portfolio managers are more likely to clench their cheeks through the pop in realized volatility and degross later on. This is a pattern, it seems—and it's a sensible pattern when you understand that folks are having a hard time hedging, for which there is no ready solution.
It kinda makes sense, right?
Hold on—we want to see the data on a histogram
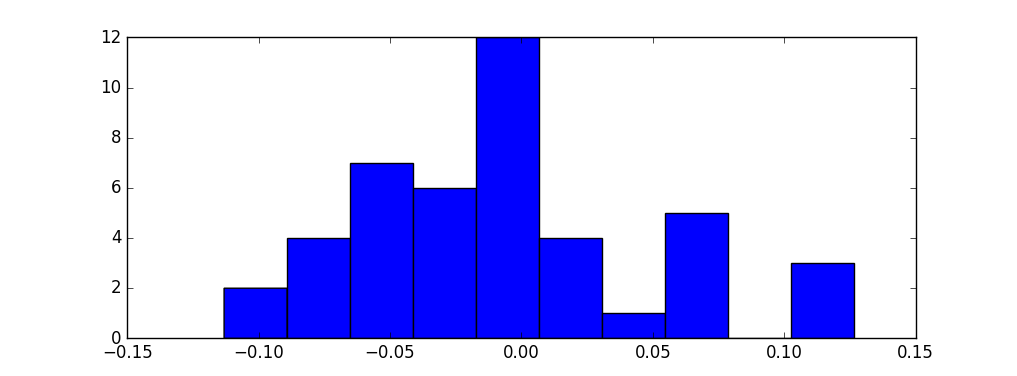
There it is. These are the 1-month SPX returns that you get after waiting one month after a spike in Volatility in the range 0.35 to 0.50. It has a mean return of –1.50%, and you can see pretty clearly the "lump" of probability around –0.05 (–5% return).
Last weekend, we included this little annotated chart below, which we thought demonstrated that there's a real phenomenon here, driven by investor behavior in the absence of a "properly" functioning VIX.
The idea was that the post-vol-spike rally tends to revert. Because reasons. We now have some more formal evidence of this.
Right now, it's about a month after the Volatility predictor touched 0.40, so if our hypothesis makes sense, we should now expect some downside. This is the first time in a while we've outright disagreed with Robot Jim—so wish us luck.
Short S&P into the fading (but not extinguished) summer light.
The SqueezeMetrics Team