An especially irregular week approaches. Here are some especially irregular thoughts:
§1 Collar, Popped
We've been blustering non-stop for the past two weeks about how the Narrative of the JPM Collar (JHEQX) was long overdue to be turned on its head this June, and rather than pinning the 4320 strike, we expected folks to deliberately target the fund by buying S&P into quarter-end—a game that we'd already named "Pop the Collar" back at the beginning of April.
Well, from what we can tell, this is exactly what happened. The index closed 3.00% above the JPM short call strike for no particular reason. That's something like $500mm stolen from JHEQX. Making the caper all the more obvious, a whole bunch of that SPX outperformance occurred overnight Friday in illiquid hours and carried through into early cash hours, deliberately frontrunning the end-of-quarter roll date.
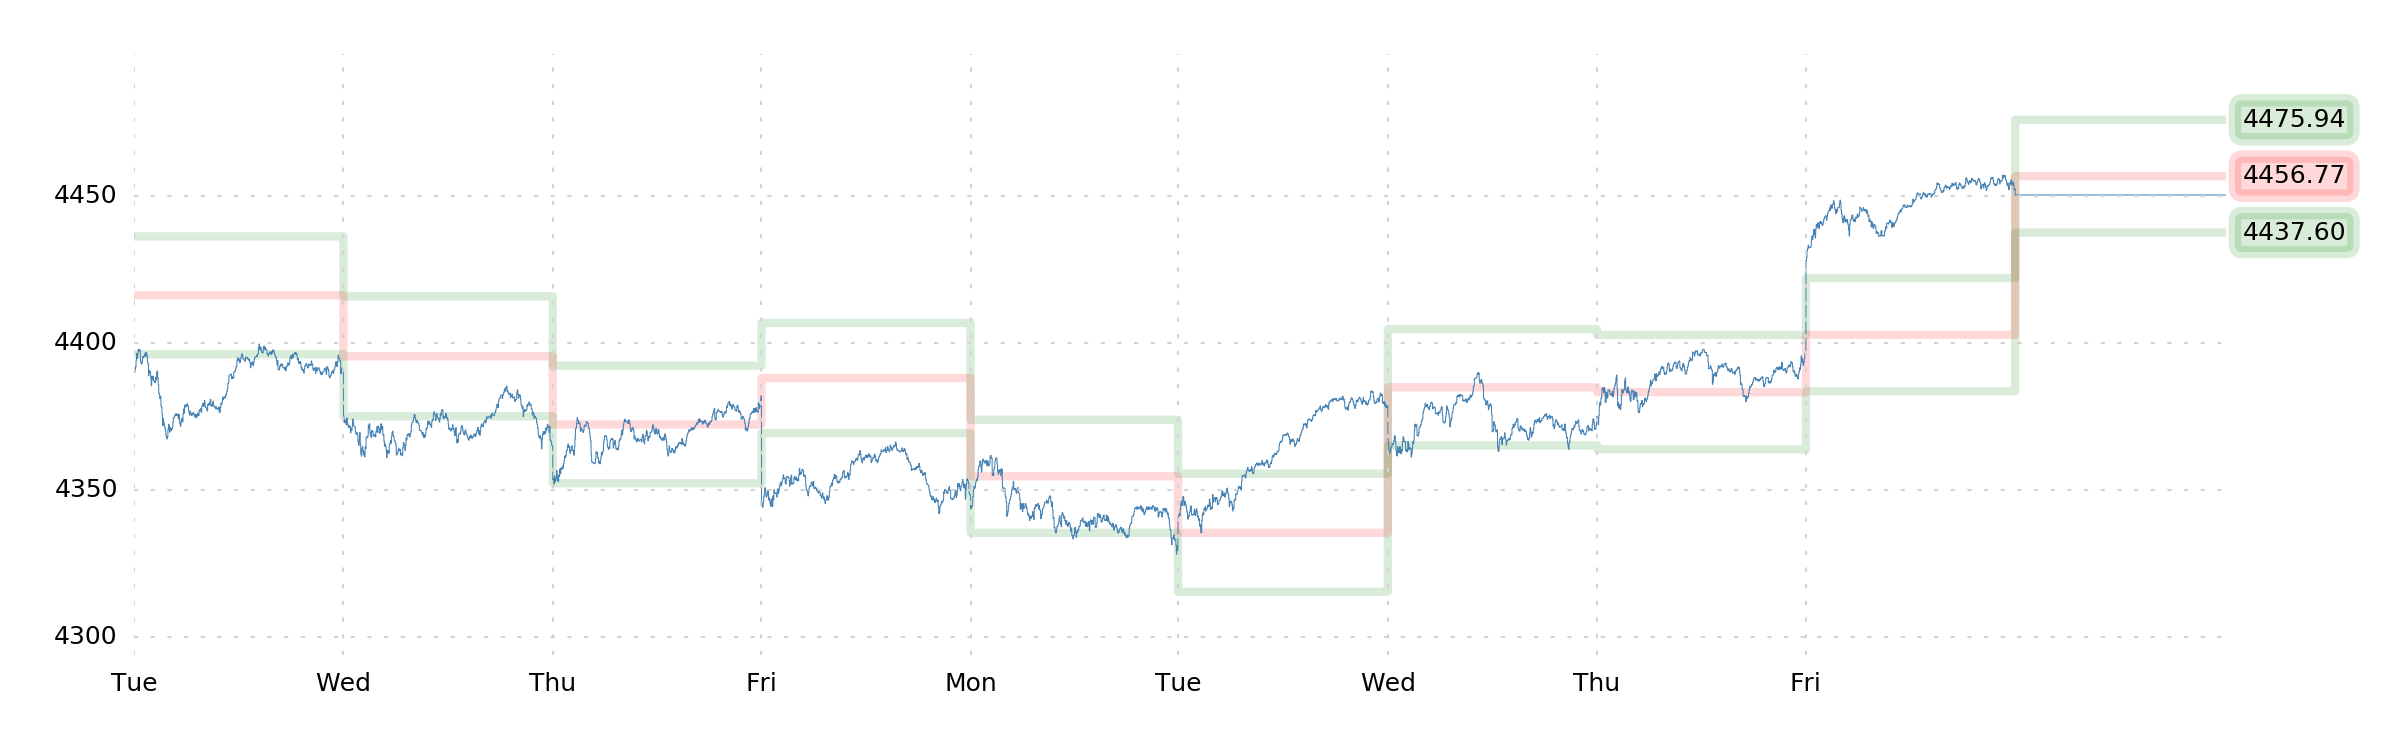
Perhaps what makes this all even more interesting is that, ultimately (and we've made this point a million times), the JPM Collar isn't even all that big in the grand scheme of things, and this means that much more than $500mm was "redistributed" in the last couple weeks. Specifically, a lot more than $500mm was lost by those who deliberately sold calls "alongside" the JPM call strike (especially last Friday for the monthly OpEx), hoping to benefit from its gravity. The JPM Collar is really just a totem, a symbol—though obviously a powerful one.
§2 Story vs. Data
And what better example could we hope for to make a point that we're always trying to make: That Data is nothing more than a shadow of Truth, which takes the form of Story—and that we should be using Data to help us suss out the Story. Data on its own can't tell you Truth.
Now, the Data won't tell you this, but as a general rule, the market eats hubris and excretes irony.
So there's a special chuckle that we'll reserve for the people who were attempting to draft in the wake of the JPM Collar by selling gobs of calls and betting on a 4320 "pin." This is hubris, and the irony is that people only did this because they've come to believe in the science of "gamma exposure." The Data told them that they could sell calls at the same strike as everyone else, and the market would be oversupplied with liquidity and inexorably attracted to that strike.
Ah, but the market, at the end of the day, is a human creation, and is thus subject to the dirty, smelly, greedy, hilarious Truth.
Truth will make you laugh and cry and curse the gods. Data won't do that.
§3 The Big Now What?
But now that the monthly and quarterly option expirations are over, the Collar has been Popped, and the Story has reached its denouement—what do we have to look forward to? We ended Friday's morning note with a reminder: That the only reason we've been bullish was this collar, and this quarter-end narrative.
Now What?
Well, there are only two things that we've really been paying attention to in recent months: First, SPX Net Put Delta (NPD) tells us that folks aren't buying puts, and when people don't buy puts, you're not in a bull market. Second, people greedily pushed money into long bond allocations in 2022, perceiving that they would look stupid if inflation was transitory and didn't grab 4.50% Treasury yields; and in the meantime, they took potshots at SPX (short put, long call) to avoid looking stupid if SPX went up.
This still appears to be the case. Investors are cynical, and have a fear of missing out. And as we predicted at the beginning of the year:
No doubt these folks will remain "blameless," but hedging one's reputation (or ego) tends to come with performance losses (as most hedges do). As such, in equities, we would expect to see some ineffectual rallies, some searing selloffs, and realized volatility outperforming implied. A failure, overall, for the ego-hedged equity investor.
Within this framework, what we're experiencing right now seems most likely to be an "ineffectual rally." I.e., cynical FOMO and a lot of hot air. If people actually wanted to be long-term allocated to stocks, they'd be buying puts to protect their outsized long-equity positions. But they're not doing that, because they don't really want to be long stocks. (Only to the extent that they can say that they were long stocks if the S&P goes up.)
(And let's acknowledge, briefly, that the most ironic outcome right now would be for inflation to pick up again, for long bond to get hammered again [relatively speaking], and for bids to evaporate across all assets, including equities [even if that seems somewhat unfair] because upside in equities is, and has been since 2022, mostly a byproduct of incremental pot-shot flows [like 0-5DTE options!] and systematic re-leveraging coming from lower volatility [but VIX is now 13 and how much lower will it go?]. So let's not let that max-ironic possibility go overlooked.)
So yeah, we think a neutral-to-bearish outlook seems warranted from here, over the latter half of 2023.
But then why should we care about all that? The more important question is: What's going to happen next week?
§4 The Little Now What?
Well, first of all, it's a weird holiday week. Early close on Monday, no trading on Tuesday. "Everyone's in the Hamptons," etc., etc. But, like a cockroach after a nuclear blast, the market will go about its business, and it'll be Friday before we know it.
On weird weeks like this, we think two distinct thoughts: (A) Not much is likely to happen, and (B) more is likely to happen than is "priced in." Meaning—maybe it's, counterintuitively, a good time to get long some options. Note that it's been a really long time since we've said this (and we've pretty much exclusively been trading E-minis day-to-day in line with SuMo and 0DTE dealer hedging data). After all, like we said above, VIX is 13, and that places 1-month ATM IVs a little over 11%, and those ATM IVs being a little over 11% implies a 1-month average move of 2.60%.
Can you imagine a future where SPX realizes more than 2.60% in either direction over the next month? Because we certainly can, and that tells us that we want to think about long gamma (a delta-hedged long ATM option), or long straddles, or long strangles, or just, generally, any long-option stuff.
When we ask Robot Jim what he thinks the next five market days have to offer (remember, he's giving us numbers for 5 full market days, so his forecast doesn't quite match the circumstances, since we're dealing with more like 3.5 market days this week), he gives us this:
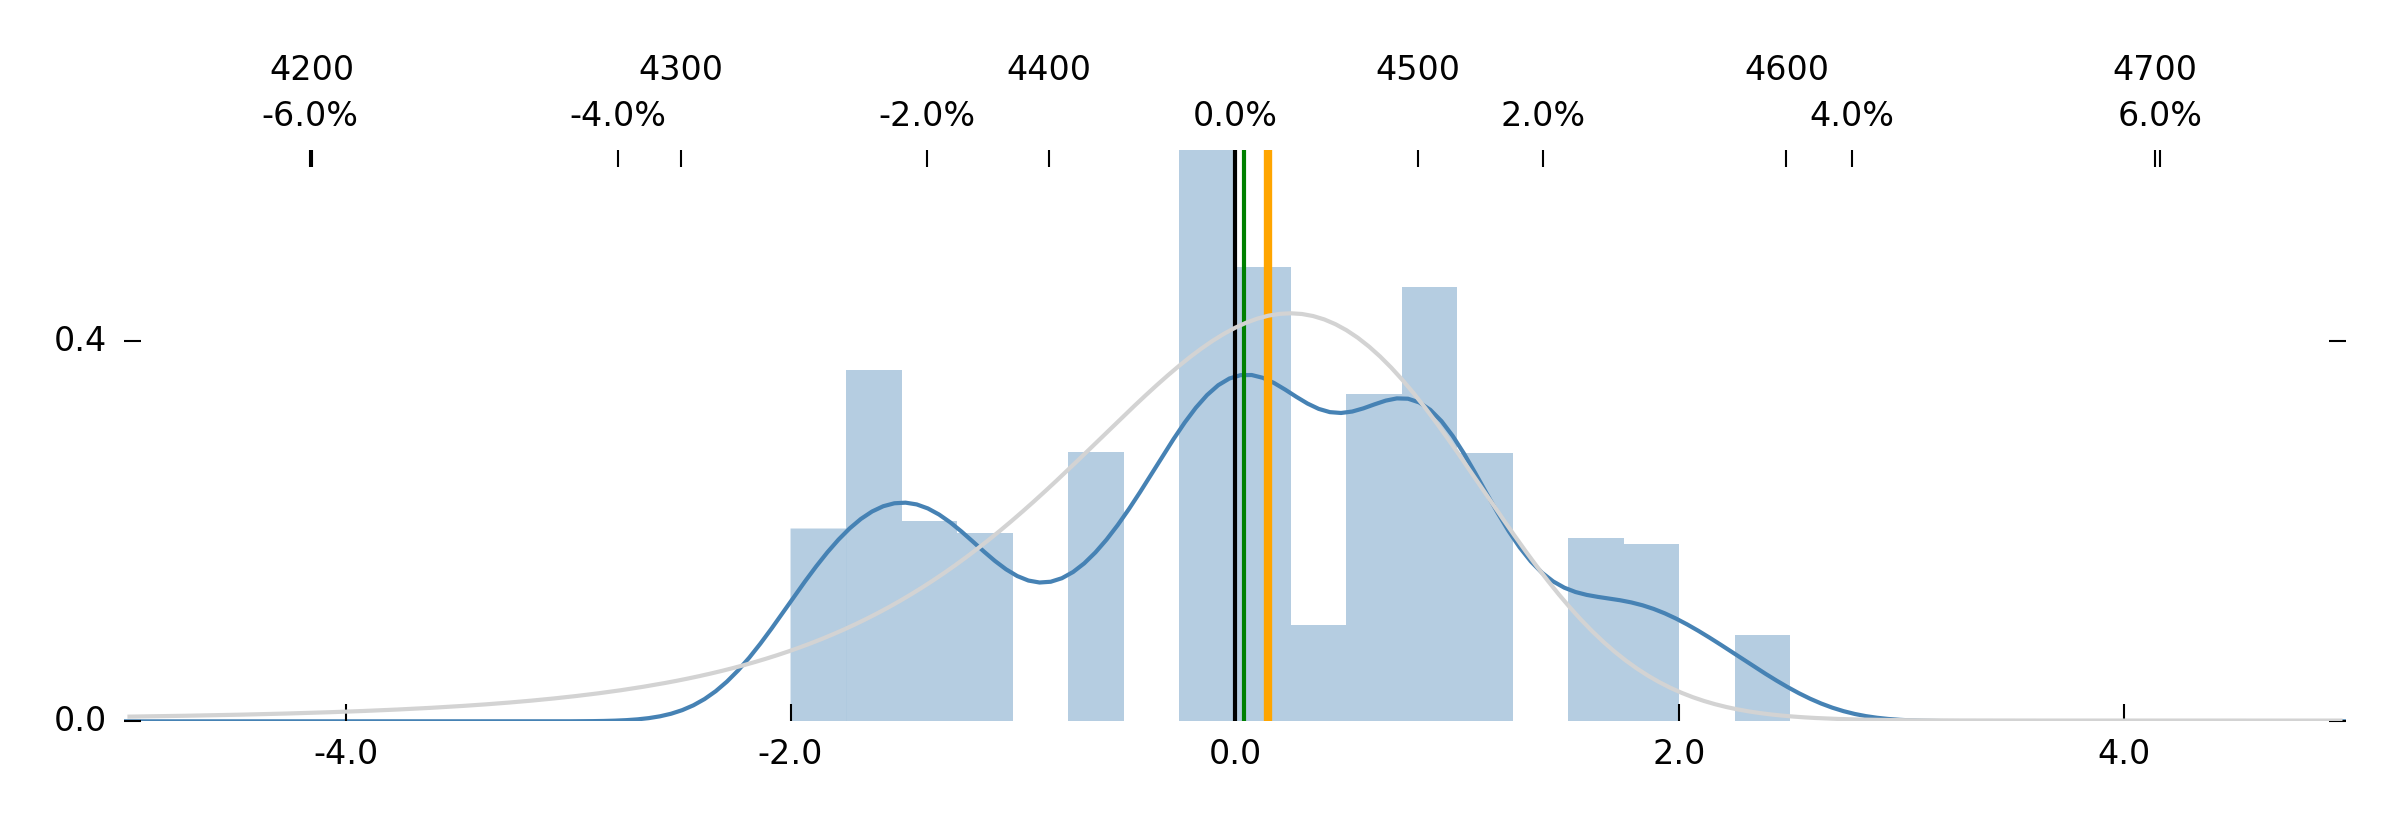
Jim's forecast here dampens our enthusiasm somewhat, by suggesting to us that, while the "shoulders" of the distribution may be underpriced (±2.50%), there aren't any tails on the table. As such, it seems like a long-option strategy would be best "capped." E.g., the above distribution might have us long options at 4400 and 4500, but also short options at 4350 and 4550 (e.g., a "long iron condor with 50-wide wings). In a phrase, perhaps we'd call this "conservatively long vol."
But we are weak-minded humans, with moist and delicate brain-matter, and before we make any decisions, we at least ought to consult the math. In this case, the math is Growth-Optimal Option Strike Evaluation (GOOSE).
§5 The GOOSE 100
So here's the idea: By [extremely] popular request, we're going to try to update a list of optimal spreads/combos based on the Robot Jim 1-week forecast. As of tonight, that list is on the Yacht Club page, in spreadsheet format, under the 1:00am Data heading ("GOOSE Spreadsheet").
As such, it will be updating at 1:00am with all the other stuff. And it looks something like this (100 rows of this):
| LEG_1 | LEG_2 | LEG_3 | LEG_4 | AVG_RETURN(%) | MAX_LOSS(%) | MAX_GAIN(%) | PROB_PROFIT(%) |
|---|---|---|---|---|---|---|---|
| 4300 | -4325 | -4350 | 4375 | 6.57 | -12.51 | 259.49 | 11.94 |
| 4325 | -4350 | -4350 | 4375 | 5.79 | -9.39 | 303.61 | 8.13 |
...
GOOSE is telling us that the single best trade right now, as of the close on Friday, is to bet on SPX landing between 4325 and 4350 in five market days, and the best way to execute that trade is with a condor (+4300, –4325, –4350, +4375). If we risk 12.51% of our portfolio on this condor, that should come with an average portfolio gain of 6.57%, a maximum portfolio gain of 259.49%, and a probability of profit of 11.94%.
Now, when it actually comes to executing this theoretical edge, we will certainly have a different experience from GOOSE's idealized, friction-free world (maybe the spreads are too wide, maybe the cost to trade is too high)—but the point stands: A bet on something like -2.50% over the next 5 market days is a "good bet," and it's underpriced by the current SPX option market. There are many ways to trade this.
(And if you look at the spreadsheet, you'll see our proposed [–4350, +4400, +4500, –4550] condor is actually 9th on the list, with an average return of 4.59%. Pretty proud of that!)
As always, even though GOOSE is Truth, that doesn't necessarily mean that we should do what it tells us. Case in point...
§6 The GOOSE $50,000
Remember how we said we'd be taking $50k and blasting it into the market with a bunch of low-probability long OTM options? We provided an update at the end of the first quarter, where we still had around $50k.
Well, now it's been six months and we've lost a cool $14,000 waiting and waiting for a big win (or two) that just hasn't (or won't ever) come.
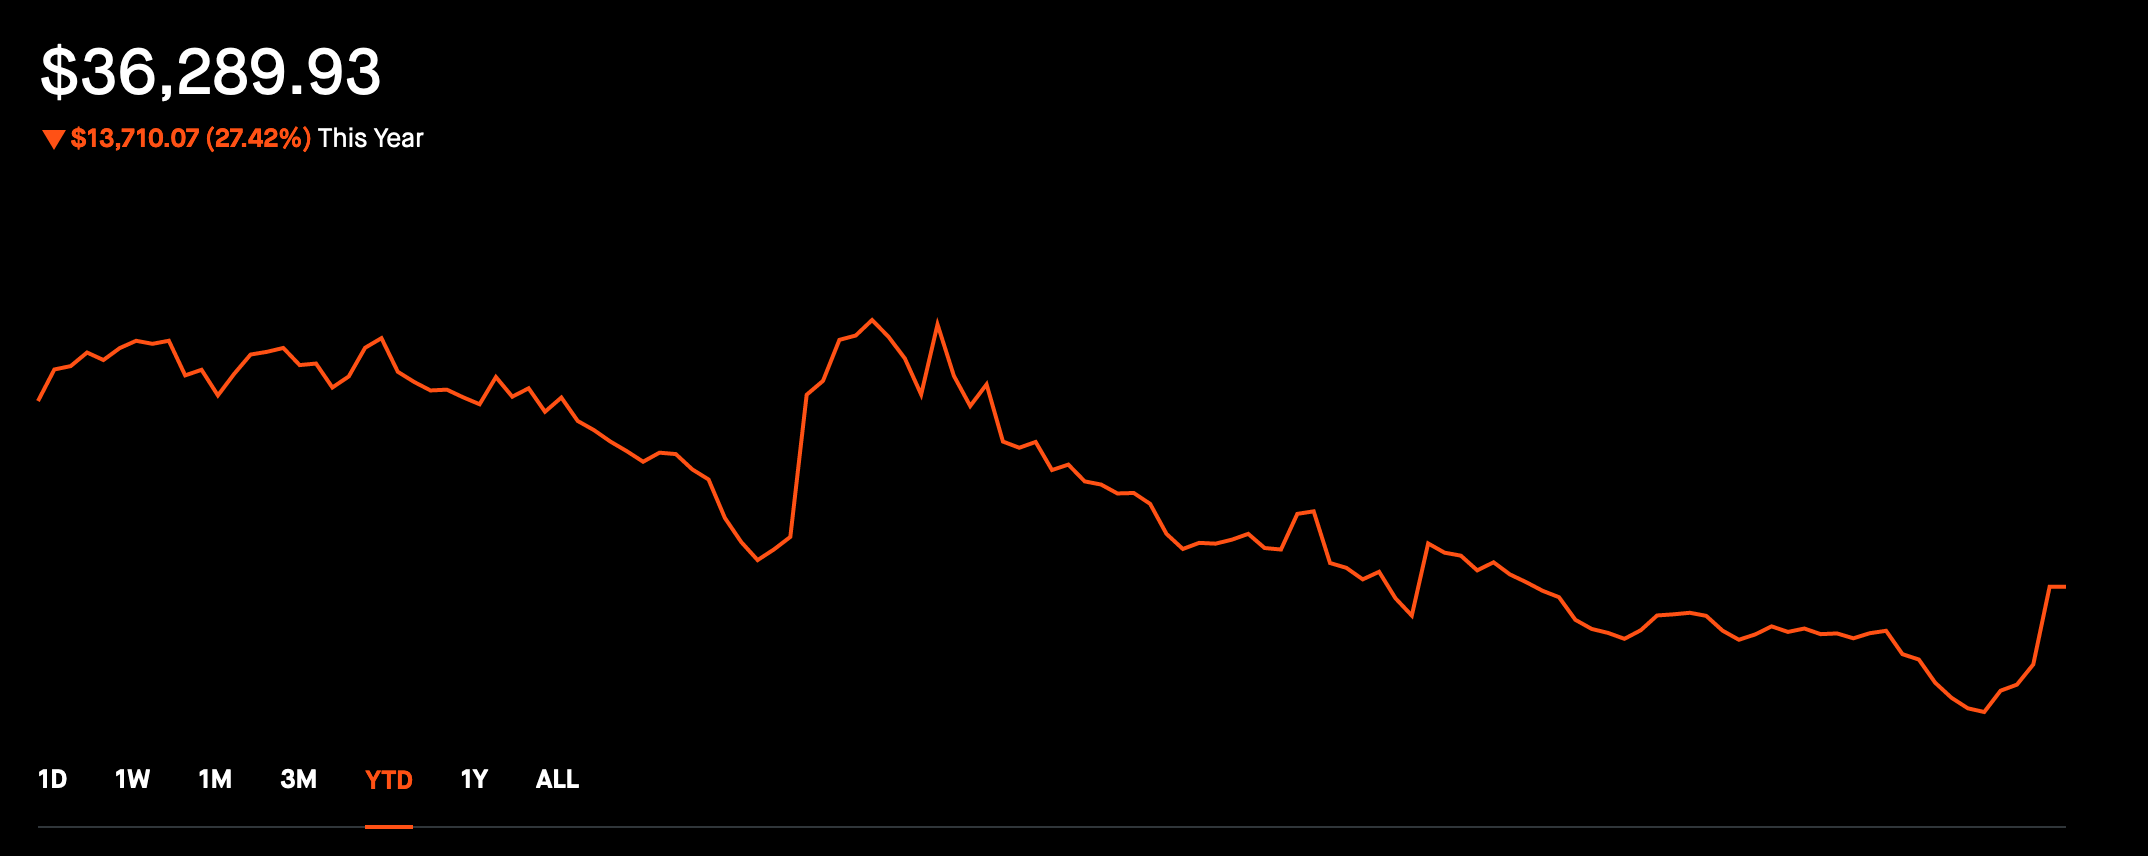
This is your portfolio on GOOSE.
Will we be vindicated by December? Seems unlikely. But you can't stop us from trying.
§7 The Truth Will Set You Free, But Then You'll Realize You Never Wanted to be Free At All