All the charts and data we refer to can be found on the Yacht Club page.
Hey everyone,
Last weekend, we presented a
chart. The chart confirmed our suspicions that, over the past several years, our NPD and VGR indicators have performed poorly.
We surmised that, as the SPX market has matured and as shorter tenors have proliferated, customers have taken much less unmanaged vanna risk, and dealers have gotten better at accounting for (pricing in) the existing risks of customer positioning. Leaving us with no edge.
We shouldn't be surprised by this. This is how things work. Markets are adaptive. Reflexive. Infuriating.
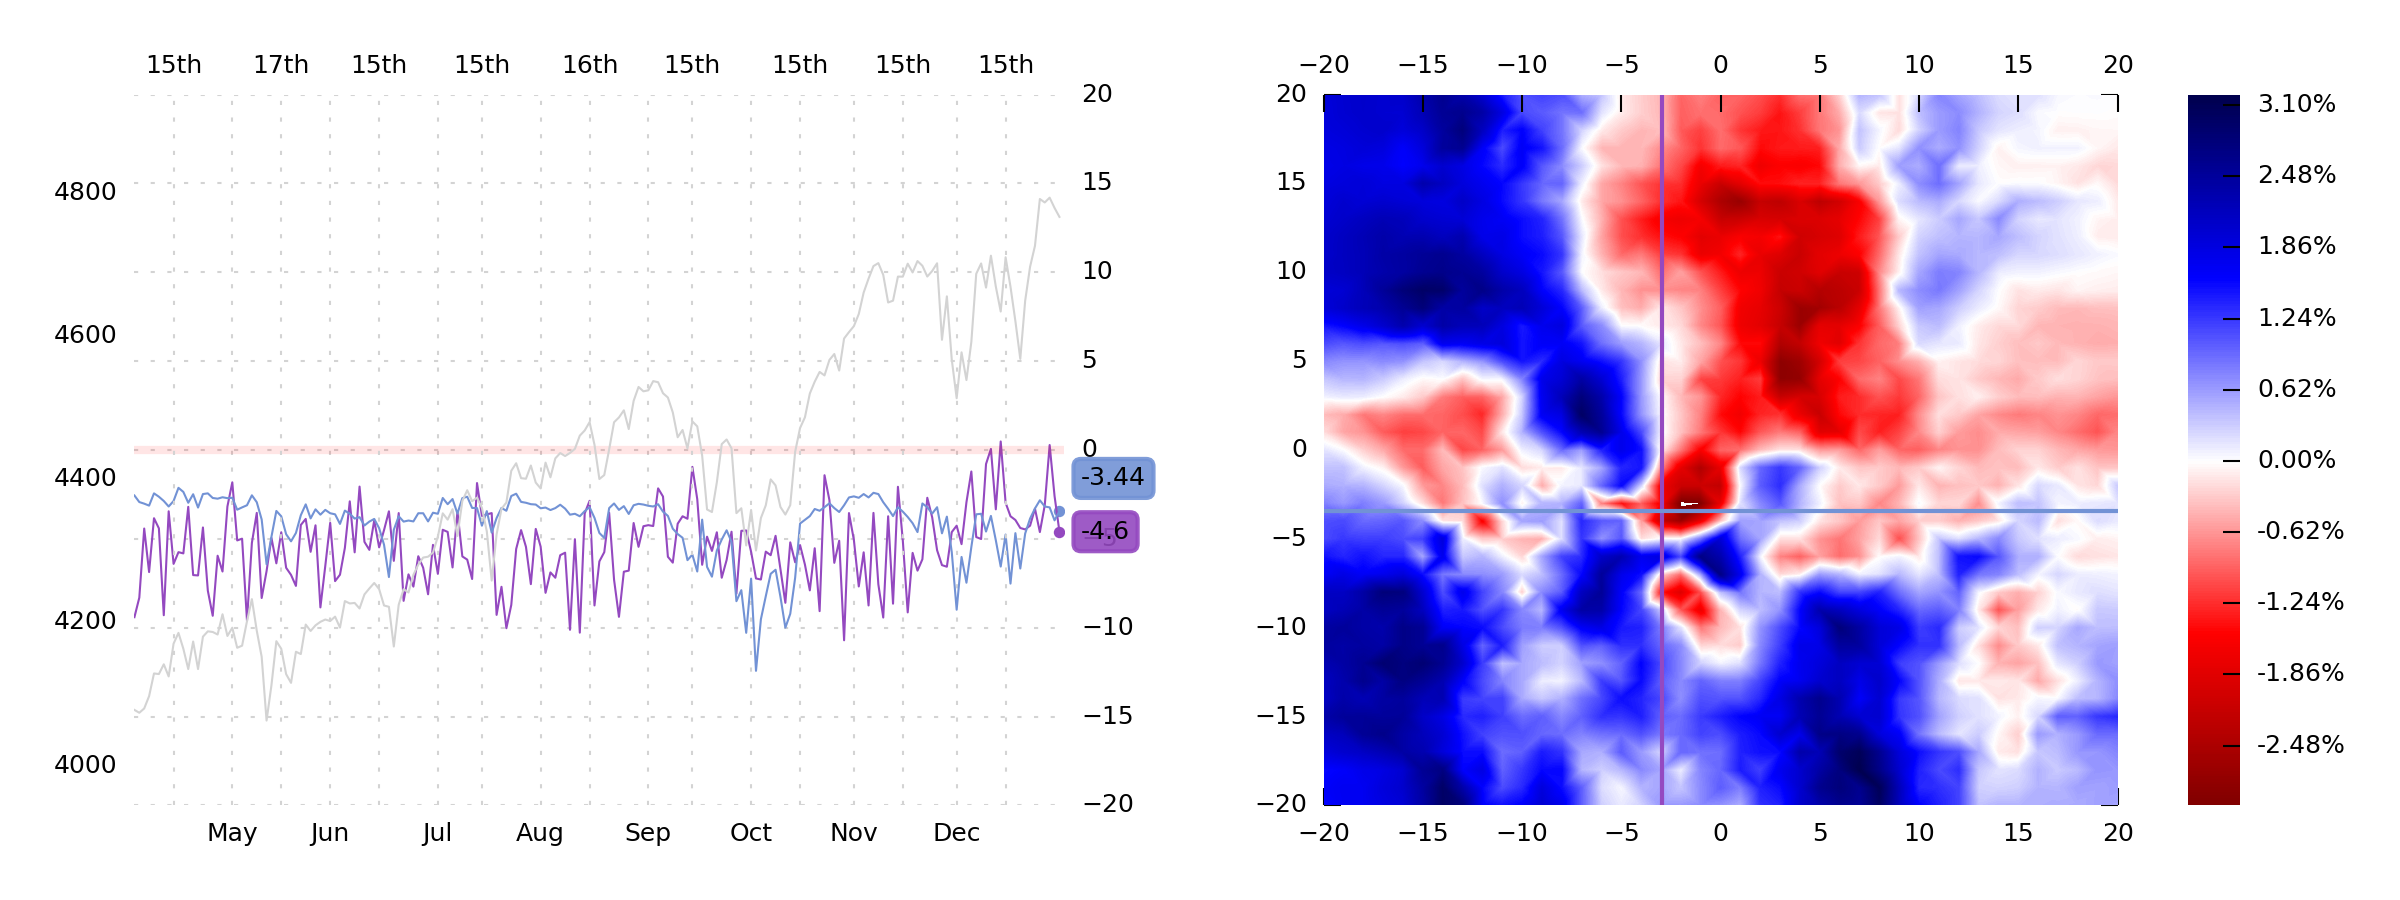
See this chart of NPD and VGR?
(Left: in time-series, Right: as a heatmap against 1-month SPX returns.)
This is from the Sunday note on
January 2nd, 2022. We perceived that this combination of low put-buying and high customer vanna exposure was very risky, and liable to lead to volatility.
This may have been the last time that NPD and VGR really "worked." That moment was followed by a good amount of volatility (and a year-long bear market).
If you want to find and read this old note, though, it's all the way at the bottom of the
Yacht Club page (keep scrolling, keep scrolling), because apparently, January of 2022 was a
long time ago—even though it doesn't feel like it.
So now we must choose a path, dear reader: (a) We would like to dive into an exploration of some potential SPX signals to "replace" NPD and VGR, but (b) we are also approaching the solstice, where we traditionally turn inward, organize some thoughts, and make a plan for the coming year.
Normally, we'd say let's just push off all the introspection and planning garbage—but this actually feels like the perfect opportunity to freshen up the SPX-centric Yacht Club page (which could undoubtedly use some tidying and organization) before we try adding more stuff.
So let's spend a moment thinking about what we'd like to see there—what would help us think more clearly.
But first...
- T–3.5
- Sputter
- Declutter
T-3.5
According to Jim, it's a good week for a little moonshot bet. A long strangle or something like that.
This has actually turned out a bit better than could be expected.
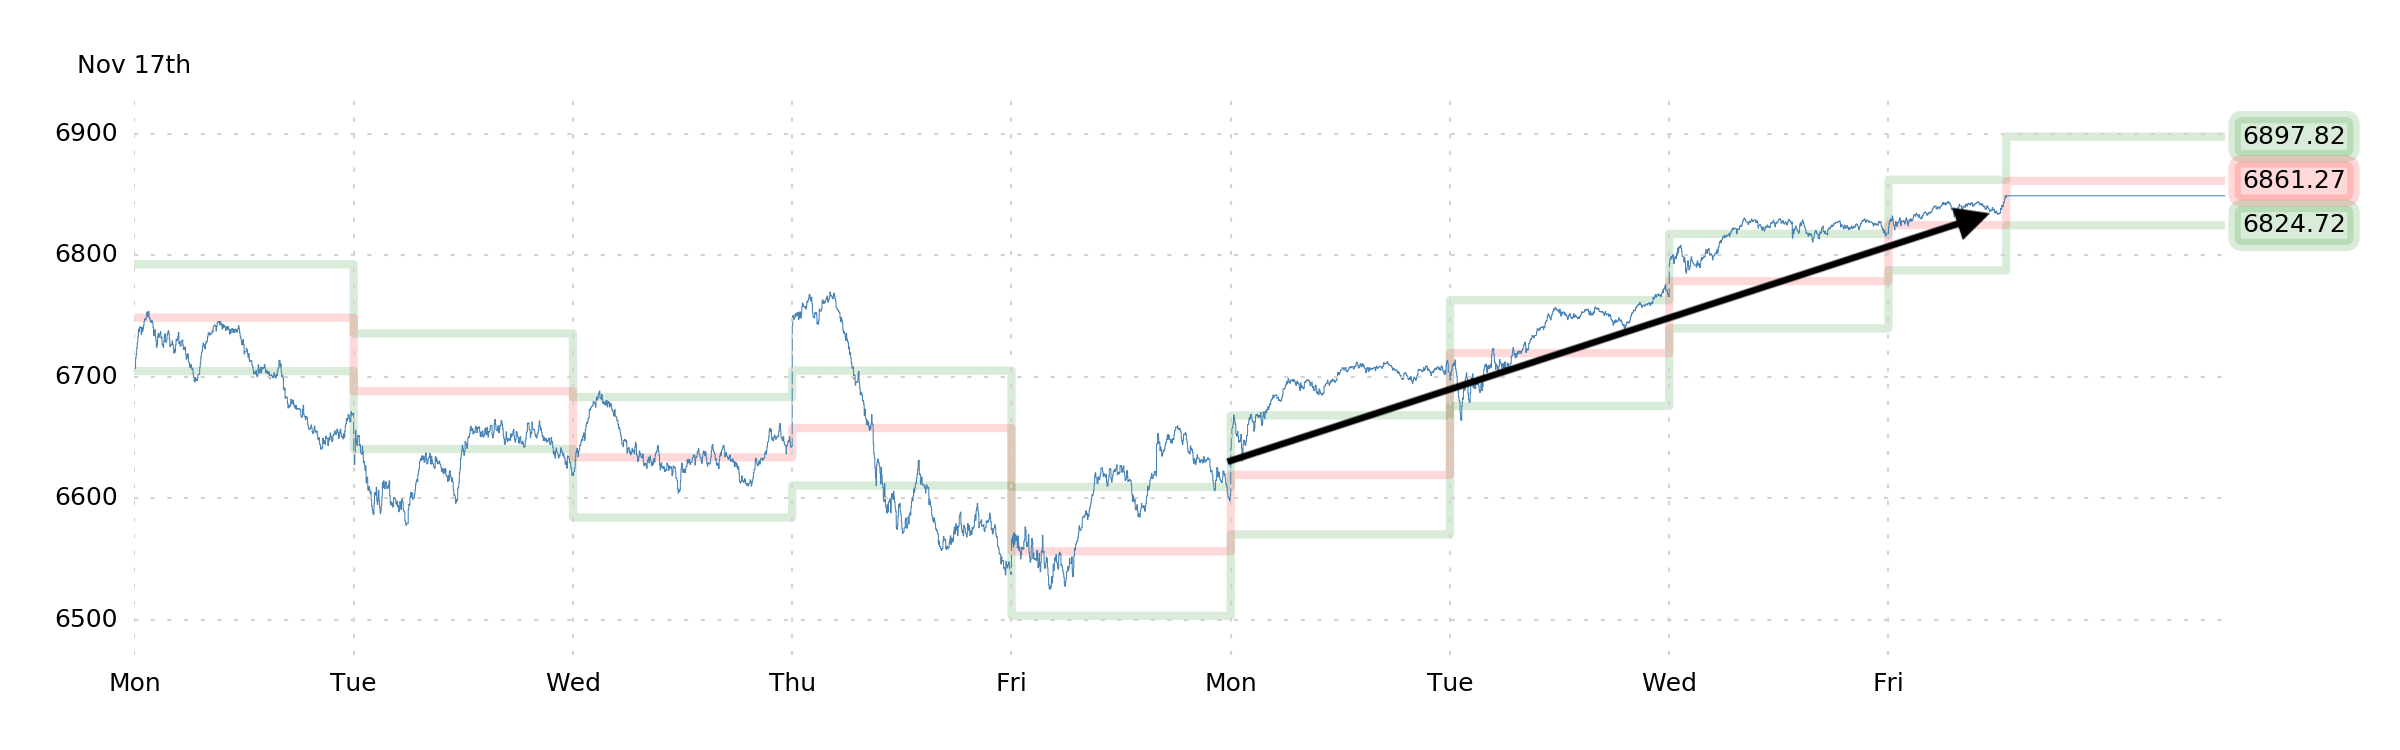
A +3.73% gain in three-and-a-half trading days is pretty exceptional, and our 7000-strike 1-month call option at least sort of enjoyed the rapid >200-point gain.
Indeed, the price-action was impressive. Not only did the index move through levels that we thought would slow it down intraday, but it also appeared to be a broad-based rally (good "breadth") rather than just a megacap phenomenon. Generally speaking, this is considered healthy, bullish.
So hopefully you will forgive us for thinking that this rally was not bullish at all.
Sputter
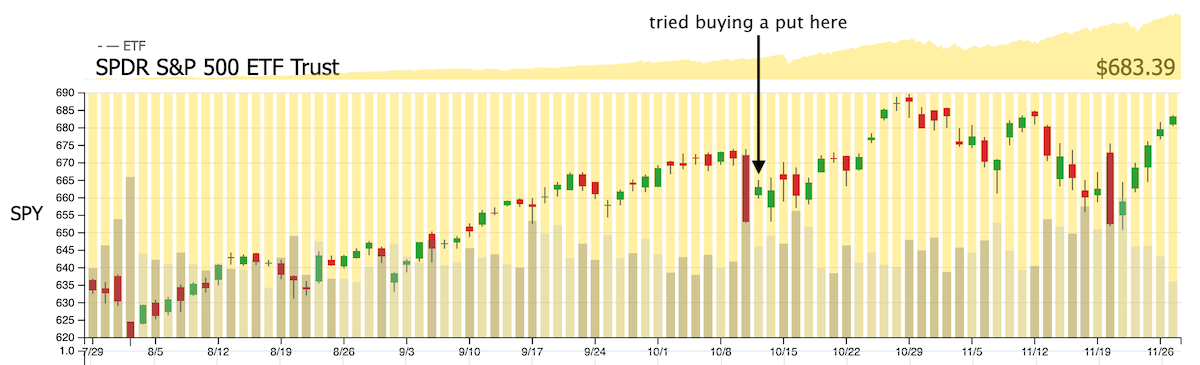
We bought a put over a month ago. It was the
October 12th note, just after a long-awaited red candle. Naturally, it didn't work out.
But perhaps you can intuit from the chart that nothing's quite been the same since then. Everything is staggered, disorderly, gappy. It's an ugly chart ever since early October.
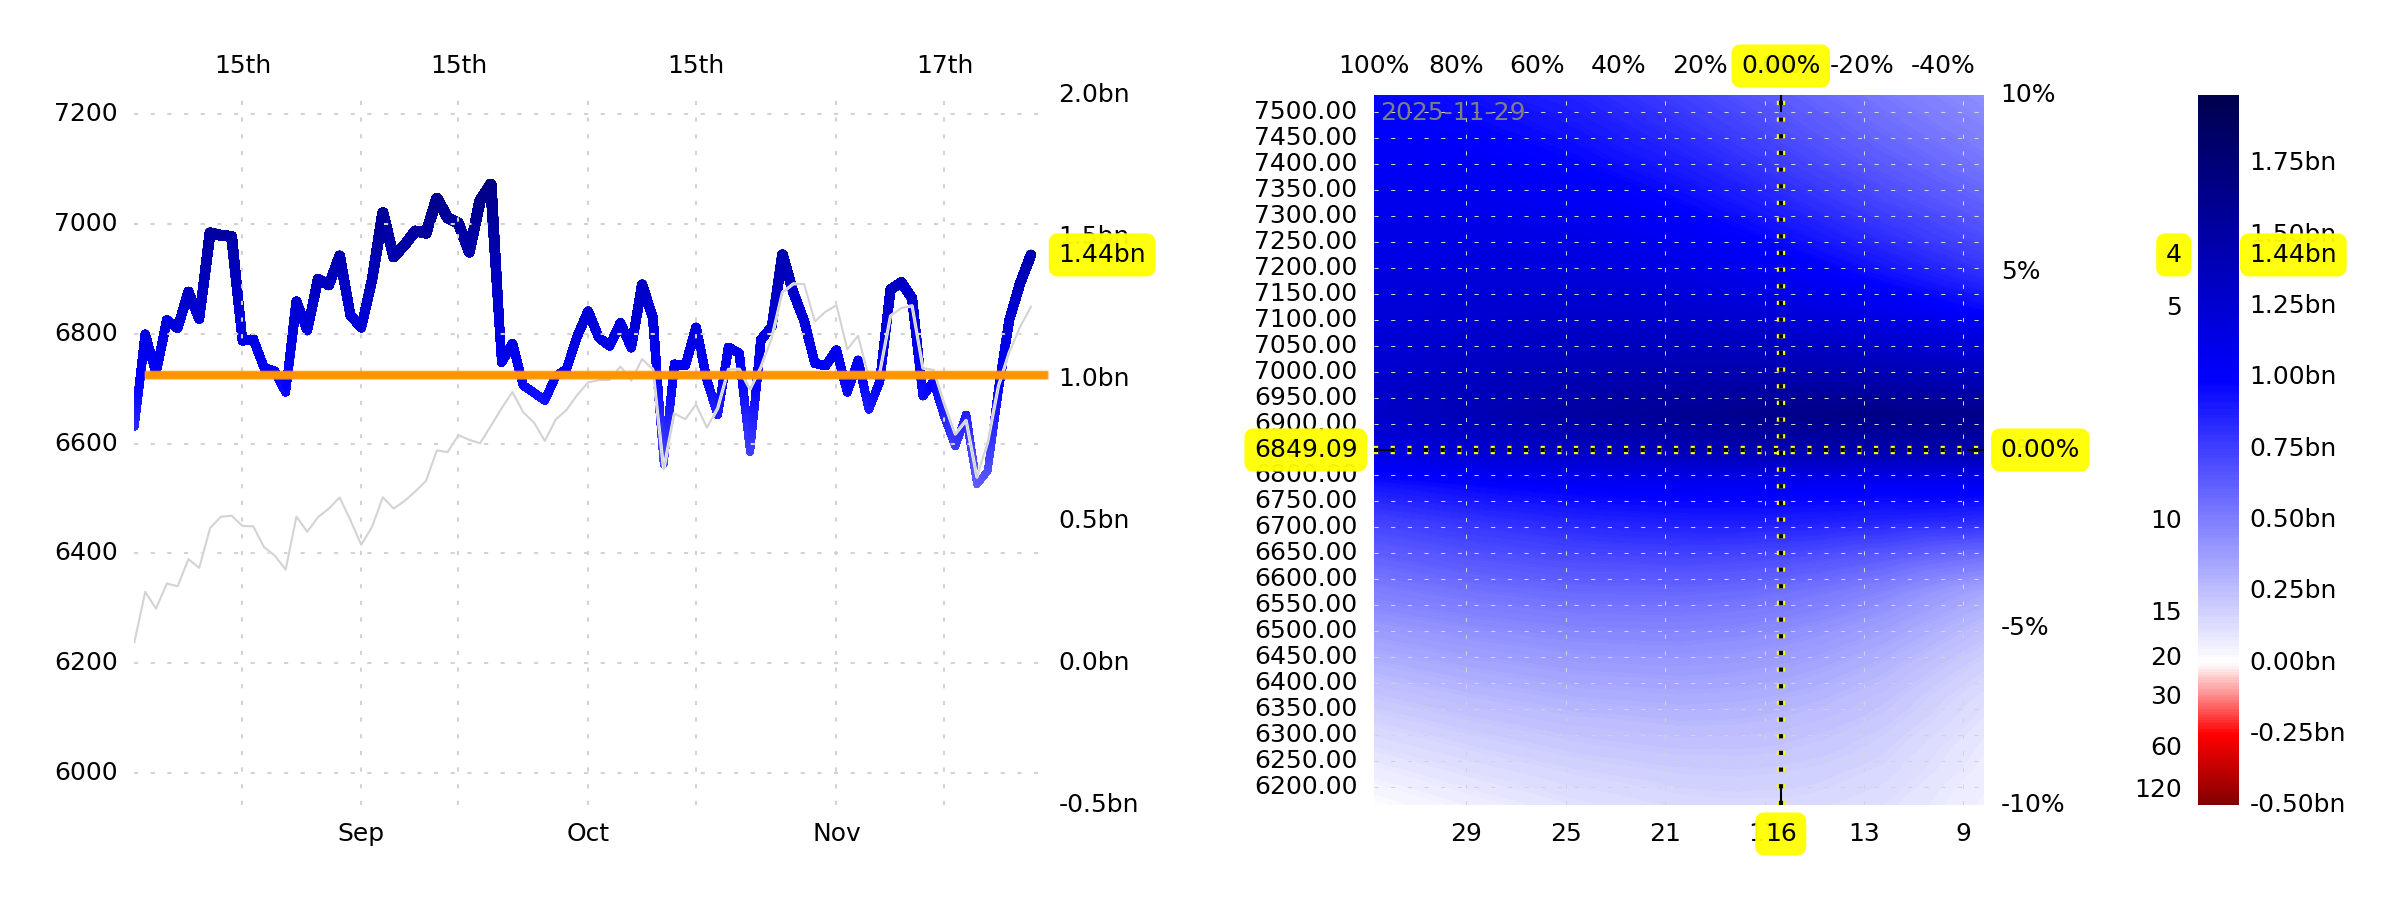
We'd posit that (of course) this is partly a product of dealer gamma exposures, and that really, the price-action after the September monthly OpEx was too calm, and that volatility was overdue by the time it came along. Try drawing a line at $1bn in GEX+, and notice that we've actually been spending a lot of time below the line lately.
But the other part of the story, beyond worsening SPX liquidity, is that there's a single, dominant narrative driving the market right now, and it's been faltering in fits and starts (which is also part of the reason that we finally bought a put back in October)—and the whole index moves sporadically as little developments hit headlines. Most recently, the most interesting item is that Google has been using an ASIC (a "tensor processing unit") for its AI training and inference tasks, and, well, the implication is that maybe we don't need many of these general-purpose GPUs (a la Nvidia) at all, since there are purpose-built alternatives!
But even the fact that we expected this kind of news didn't have us short the S&P after our punt in October. No—we've tried to be patient.
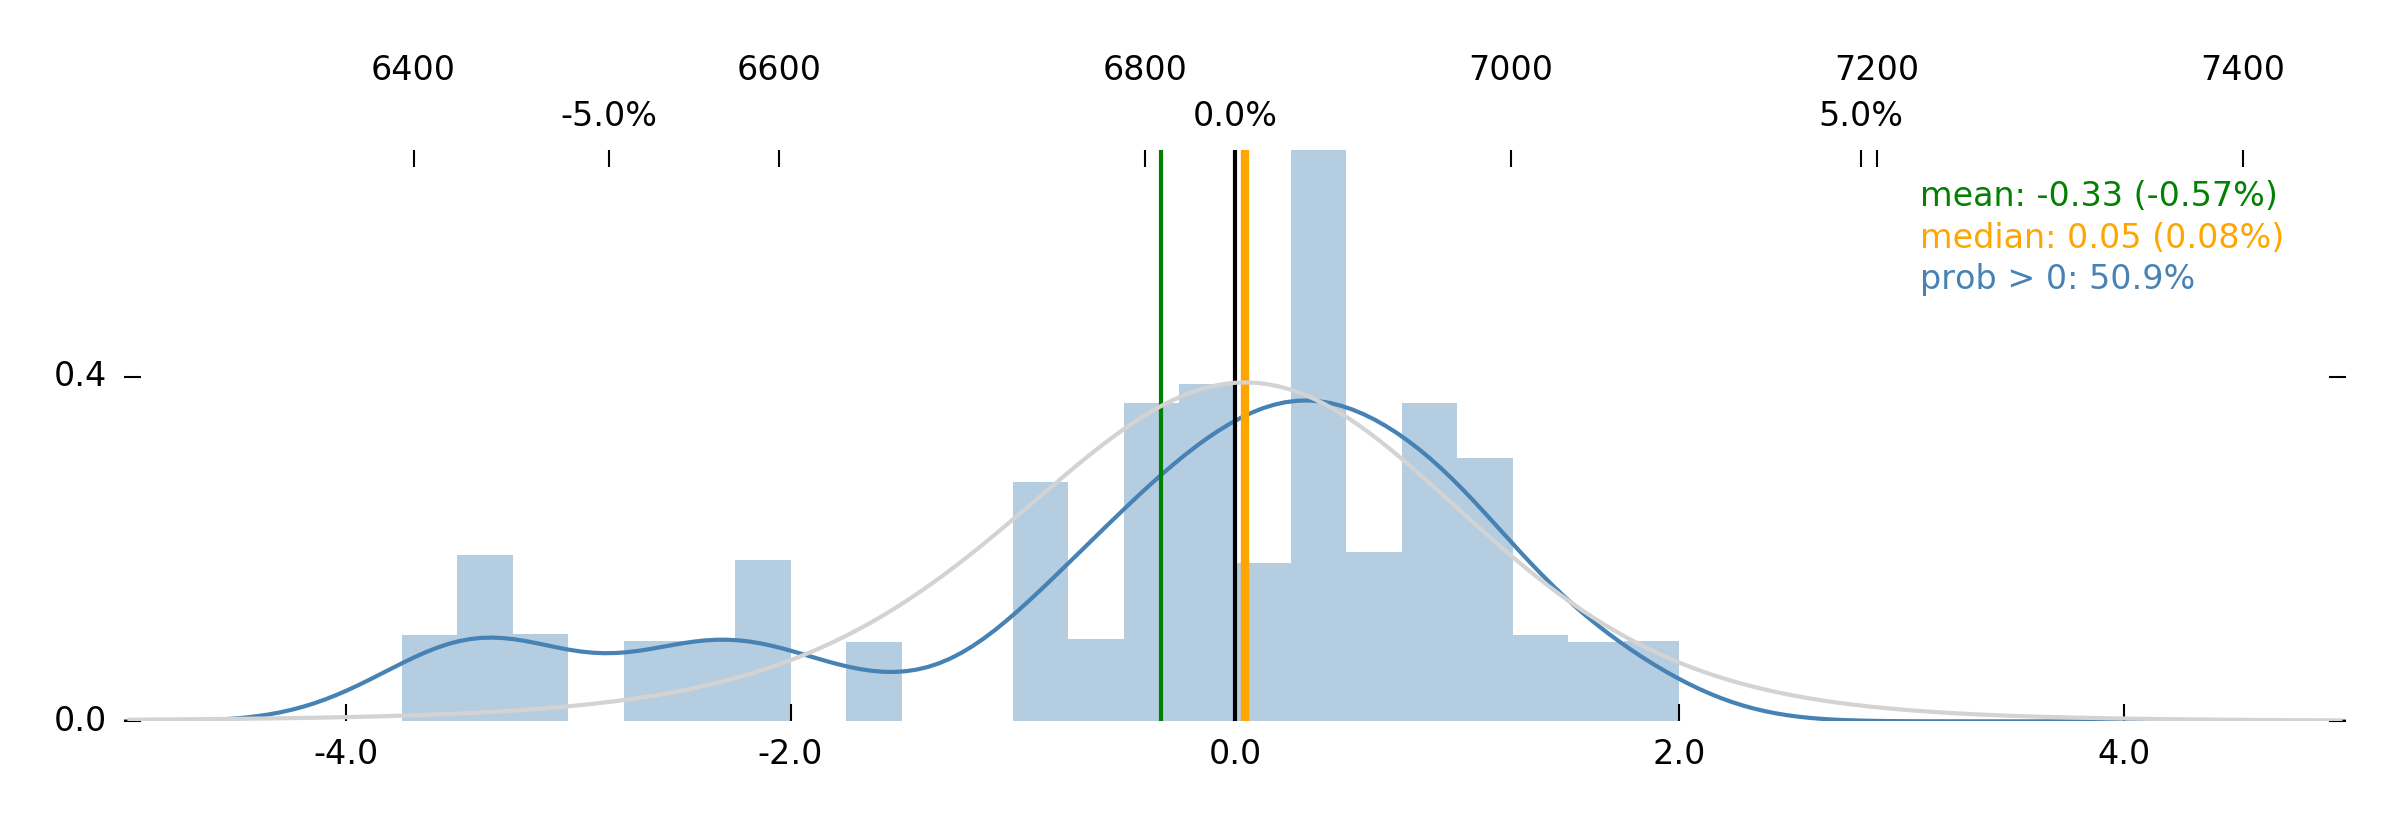
But dear reader, after last week's silly rally, Robot Jim is bearish again.
That's a mean expected 1-week return of –0.57%, informed by the presence of a fat tail in the sample data. Jim thinks that a 4% to 6% weekly loss is unusually likely in a situation like this, and oh, we're happy to hear this!
Why? Because our take on last week's action was that it was stupid. Like, the whole thing was animated by stupidity. It had the cadence of a low-information trader desperately "buying the dip" because it's the only thing he's ever done before, and it "works every time." Meanwhile, VIX crushed ten points in just those 3.5 days—and for what? Did something change? Does it make sense to think that volatility should now be lower?
No.
Now, we usually don't go out on a limb like this, but our feeling is that there is a lot of potential downside teed up right now, and that this most recent spate of buying was primarily retail-driven (retail is a notorious dip-buying contingent, and is extremely willing to cross a spread to get a fill, thereby impacting prices a great deal more than objectively larger-dollar traders), and that in this case, that's a bearish thing. This is not a good moment to buy a dip. But they did it anyway. And they, thereby, gave the index more room for a bigger volatility event.
Long puts at 6700 is an easy decision for us. More 1-month options, since with VIX at 16, we want the vega.
We feel, unusually strongly, that this is the right time.
Declutter
We do not prioritize "organization." If you spent all of your time placing your ideas into neat little buckets, justifying every thought, and back- and forward-testing each one of your ideas, you would never be able to execute on an edge—or even on a systematic beta. We are inclined, instead, to execute on half-baked ideas if they only sort-of make sense, and to just keep moving forward with new ideas. Aside from the occasional moment of self-hatred and despair, this has worked pretty well for us.
Data is not something to get attached to. "Indicators" don't often stand the test of time. If you're to hold on to anything at all while navigating markets, it should be the sense that change is constant, and that only a few elements of broad understanding ("wisdom?") can translate from one year to the next. We tend to think that identifying "fear" is important. We also think that "dealer disintermediation" is important. These things carry over, and are always true—but where you look for, and where you find, fear and dealer disintermediation, are always changing. (Of course, NPD is a measure of fear; and VGR is a measure of dealer disintermediation, and that's why they worked.)
Still—when venturing out in search of new data, it seems to help to know where you've been in order to understand where you ought to be going. And so, in the interest of not retracing our steps, and not getting completely lost in the weeds, we'd like to invent some method of more easily surveying our past work, our past findings. Right now, we wonder if we can simply apply some keywords, or tags, to past notes, and then place them on a time-series chart to better understand what was going on. Where we've been.
To that end, we will plan on having a new Yacht Club page up by next weekend, and hopefully we'll already have a clearer idea of where we ought to be looking.
Enjoy the [bearish] week!
The SqueezeMetrics Team