All the charts and data we refer to can be found on the Yacht Club page.
Hey everyone,
Things are moving. Things are interesting. Let's try to fit some pieces together. Several games are being played in the market right now, and it would be good to talk about them:
- An "engineered recession" (Chicken)
- The Cboe Volatility Index (Bloody knuckles)
- Sector rotation (Russian roulette)
But first...
- Ow
- Mercy!
- Games
Ow
Monday's action was surprising. It was also a bit irksome, since we were long S&P, patiently waiting for a little rally. A little rally that never came.
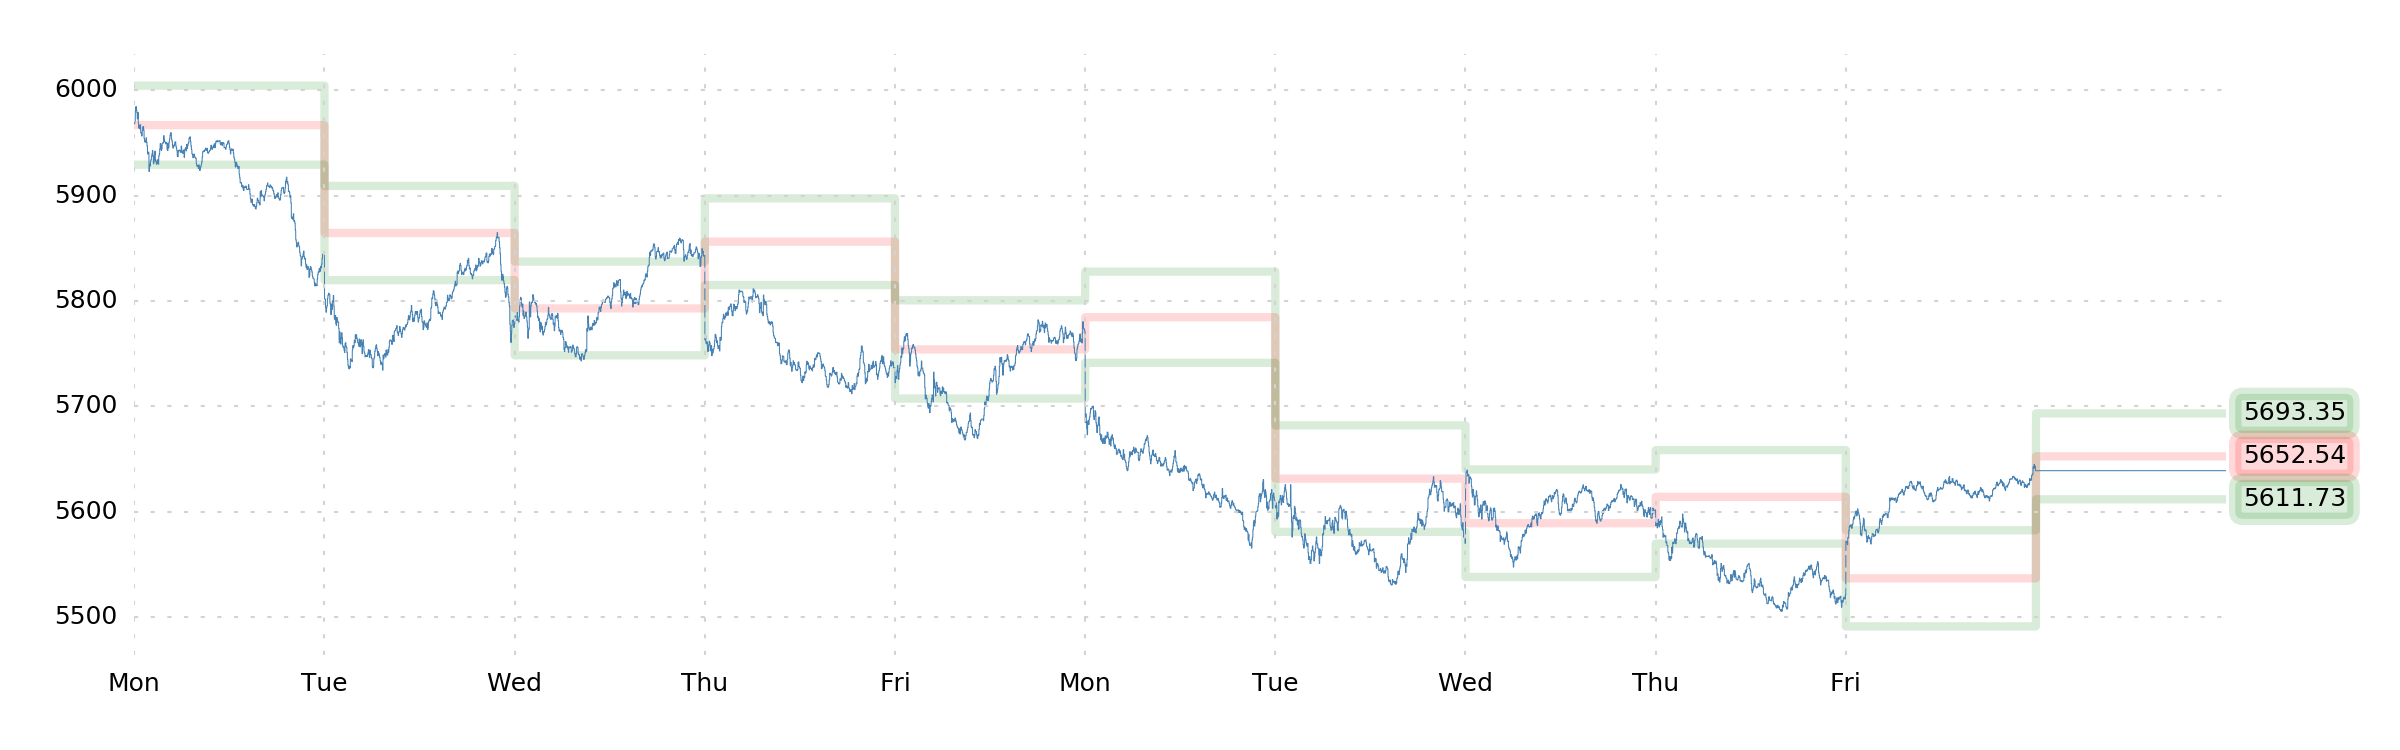
The index went down 2.27% on the week. Our portfolio loss over the past month is now a healthy –5.00%, partly owed to stocks, partly to bonds. Relatively painful.
There are a number of competing explanations for what "caused" this persistent selloff. The two that we've heard most often are "European repatriation" and "Pod shop blowups." The former suggests that Europeans are selling U.S. stocks, and the latter suggests that some correlation breaks hurt long/short equity pods. Both, at heart, are downstream of Trump's second trade war and other perceived "degrowth" policies (we've apologized for this before, but it's true—a lot of stuff is going to be about Trump whether we like it or not).
These explanations are charming and all, but they're not particularly helpful. We don't think we can suss out Trump's tariff plans, European bid-hitting, or pod-shop risk limits. None of them will necessarily be rational, even, so it's hard to attempt it. Any further and we drift into "macro" frippery.
Let's try to keep it grounded.
Mercy!
The index is down over 8.00% from its peak, and a mix of signals has arisen.
In
DIX, we've had three days of stronger readings into the end of the week. This suggests that liquidity improved. There were a number of 40% prints earlier on, which is (especially in 2025, where baseline DIX is higher) suggestive of poor liquidity from dealers. This is a bullish indication.
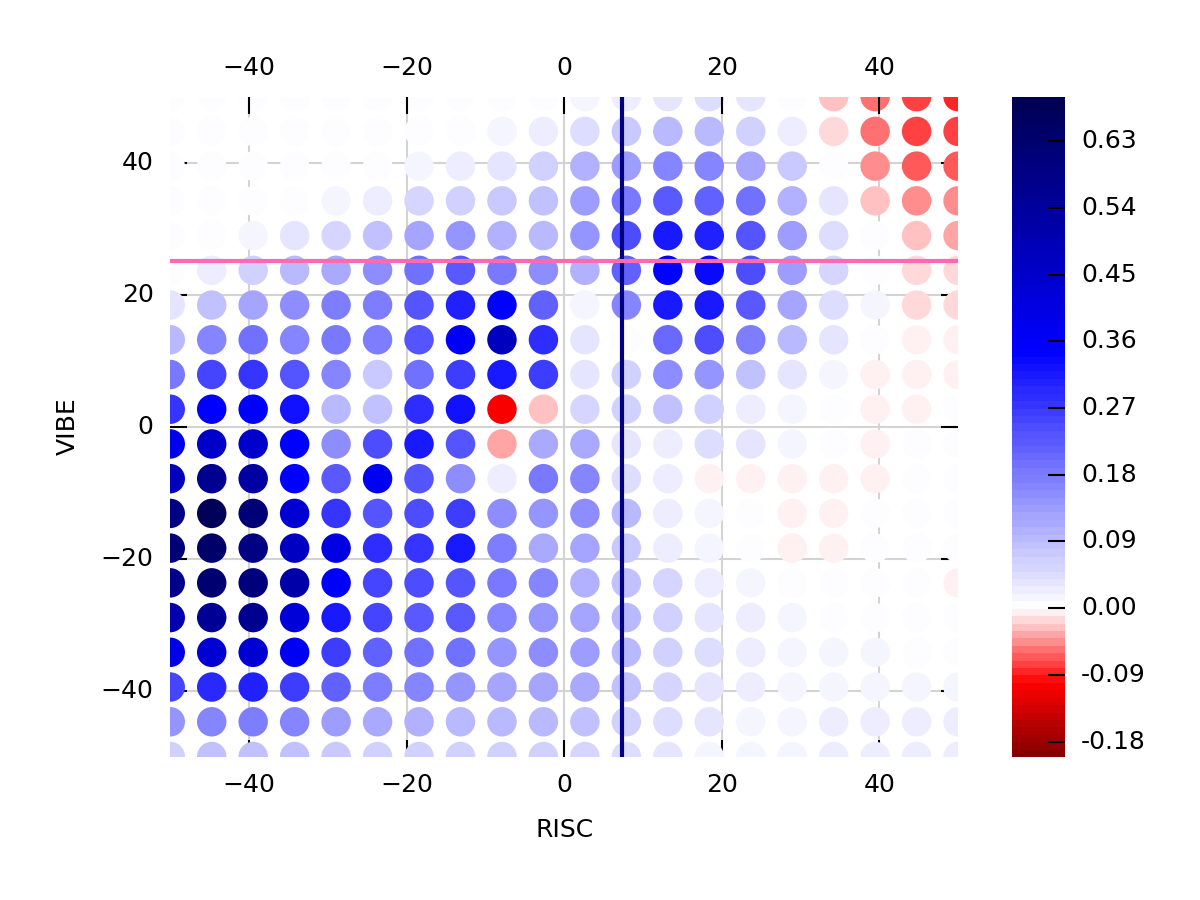
But then in volatility, we have a RISC of +7, which suggests that realized volatility in SPX is actually higher than implied. That's pretty neutral in isolation, but it's surprising to see that after a correction, and doesn't inspire confidence.
Generally speaking, you'd see a positive RISC and positive VIBE as SPX is recovering and gaining momentum (not what's happening right now).
But then perhaps we can appeal to the customer Vanna-Gamma Ratio (VGR) for bullish feelings!
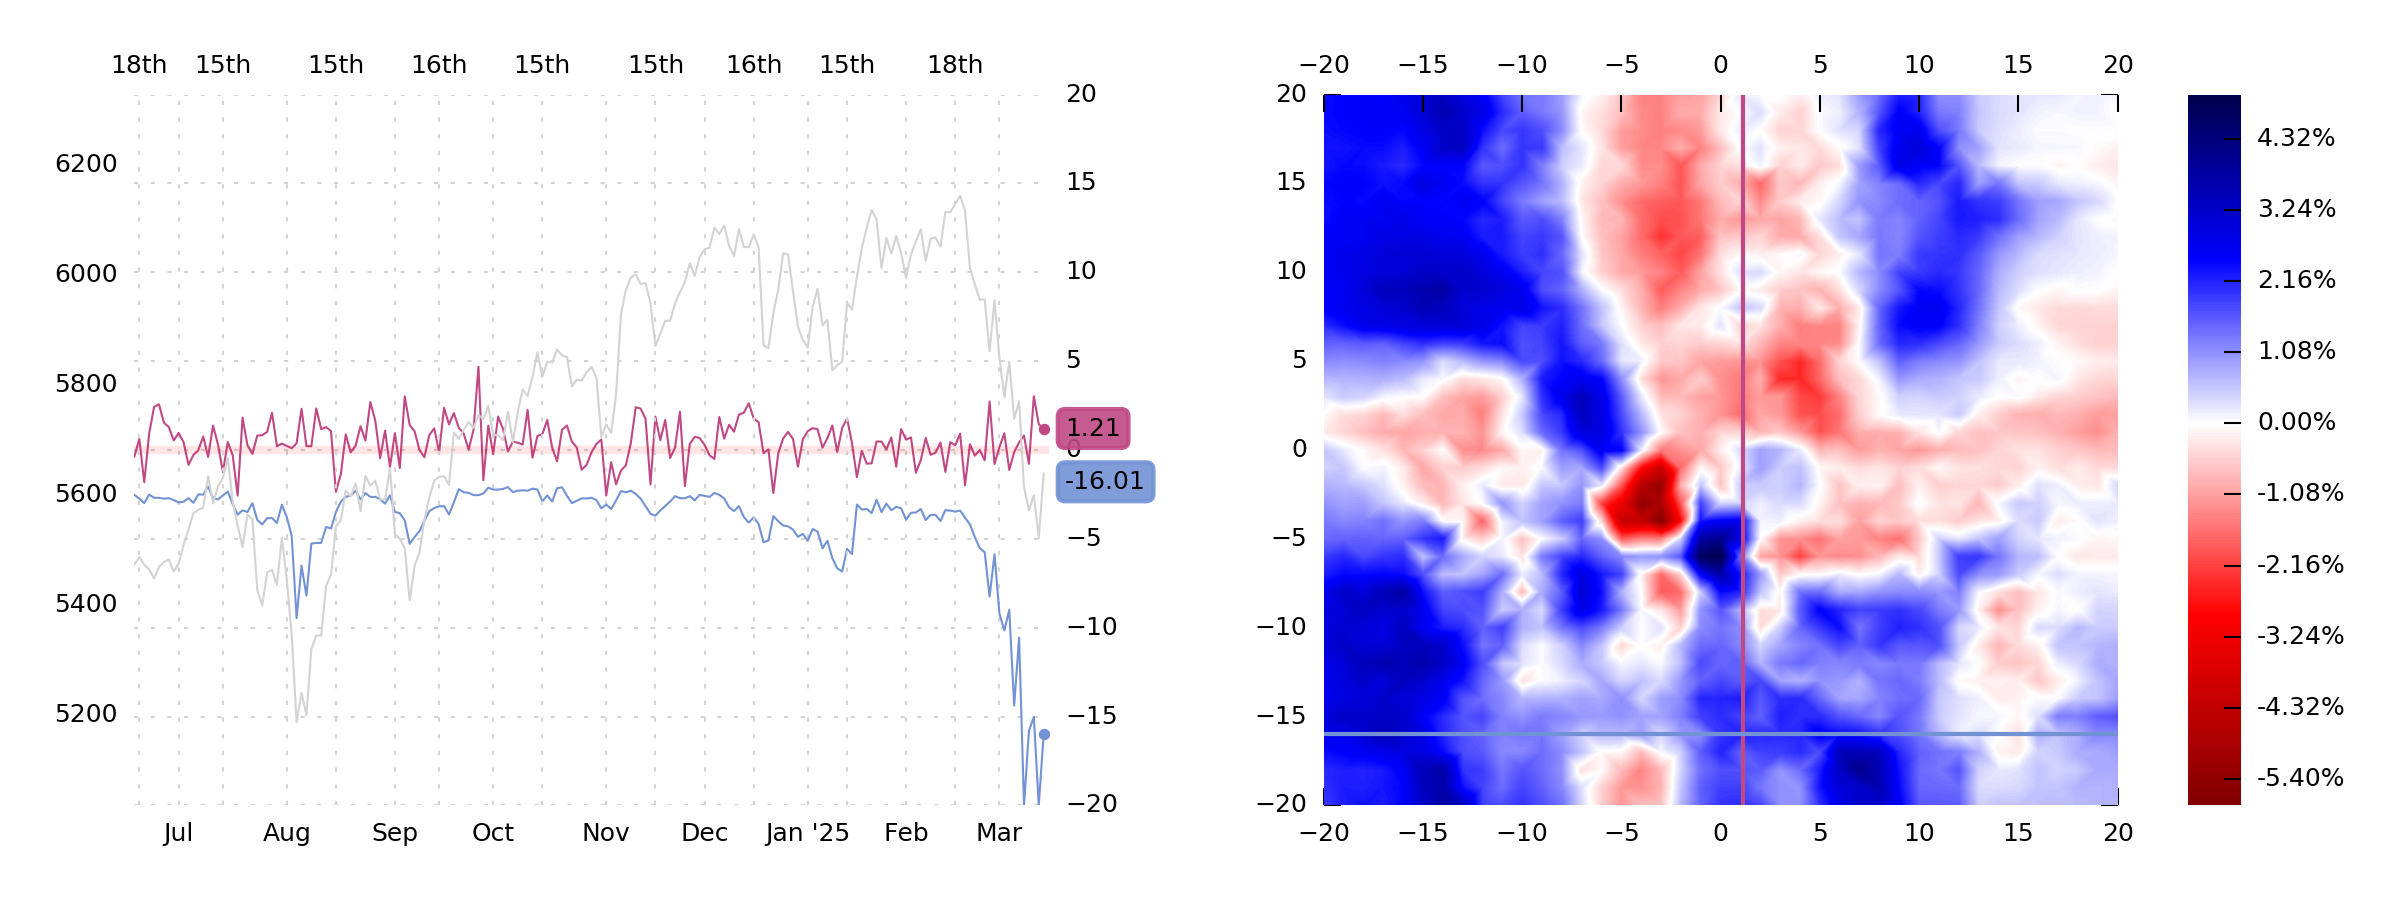
VGR has plummeted to -20, where it's seen support. That's the way it's supposed to work, and it suggests that there's still more support here, since customers' deltas are not overexposed to vanna. That means things don't fall apart here.
But then at the same time, if you look at the wine-colored line above (SPX Net Put Delta [NPD]), you may note that customers have tended toward selling SPX puts (positive put delta) in the last few days. That's not really what you want to see, generally, since it means that people are accumulating short convexity, and thus, future dangerous positioning. While it's almost certainly not a problem yet, if that keeps up for much longer, it could indeed become a liability.
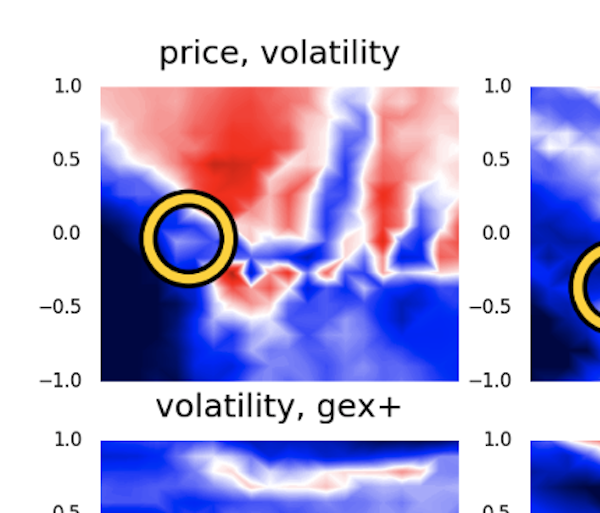
Ah, but let's simply fall back on vol-normalized 1-month "Price"—one of the most reliable indicators of SPX performance. We can see where we're at in terms of Price on the "weather map" of the Probability Page.
And, well, yeah, we're still in a blue area right now—but if either Price or Volatility rise, we'll end up in a more reddish area pretty quickly. So there's not as much oomph there as you'd guess.
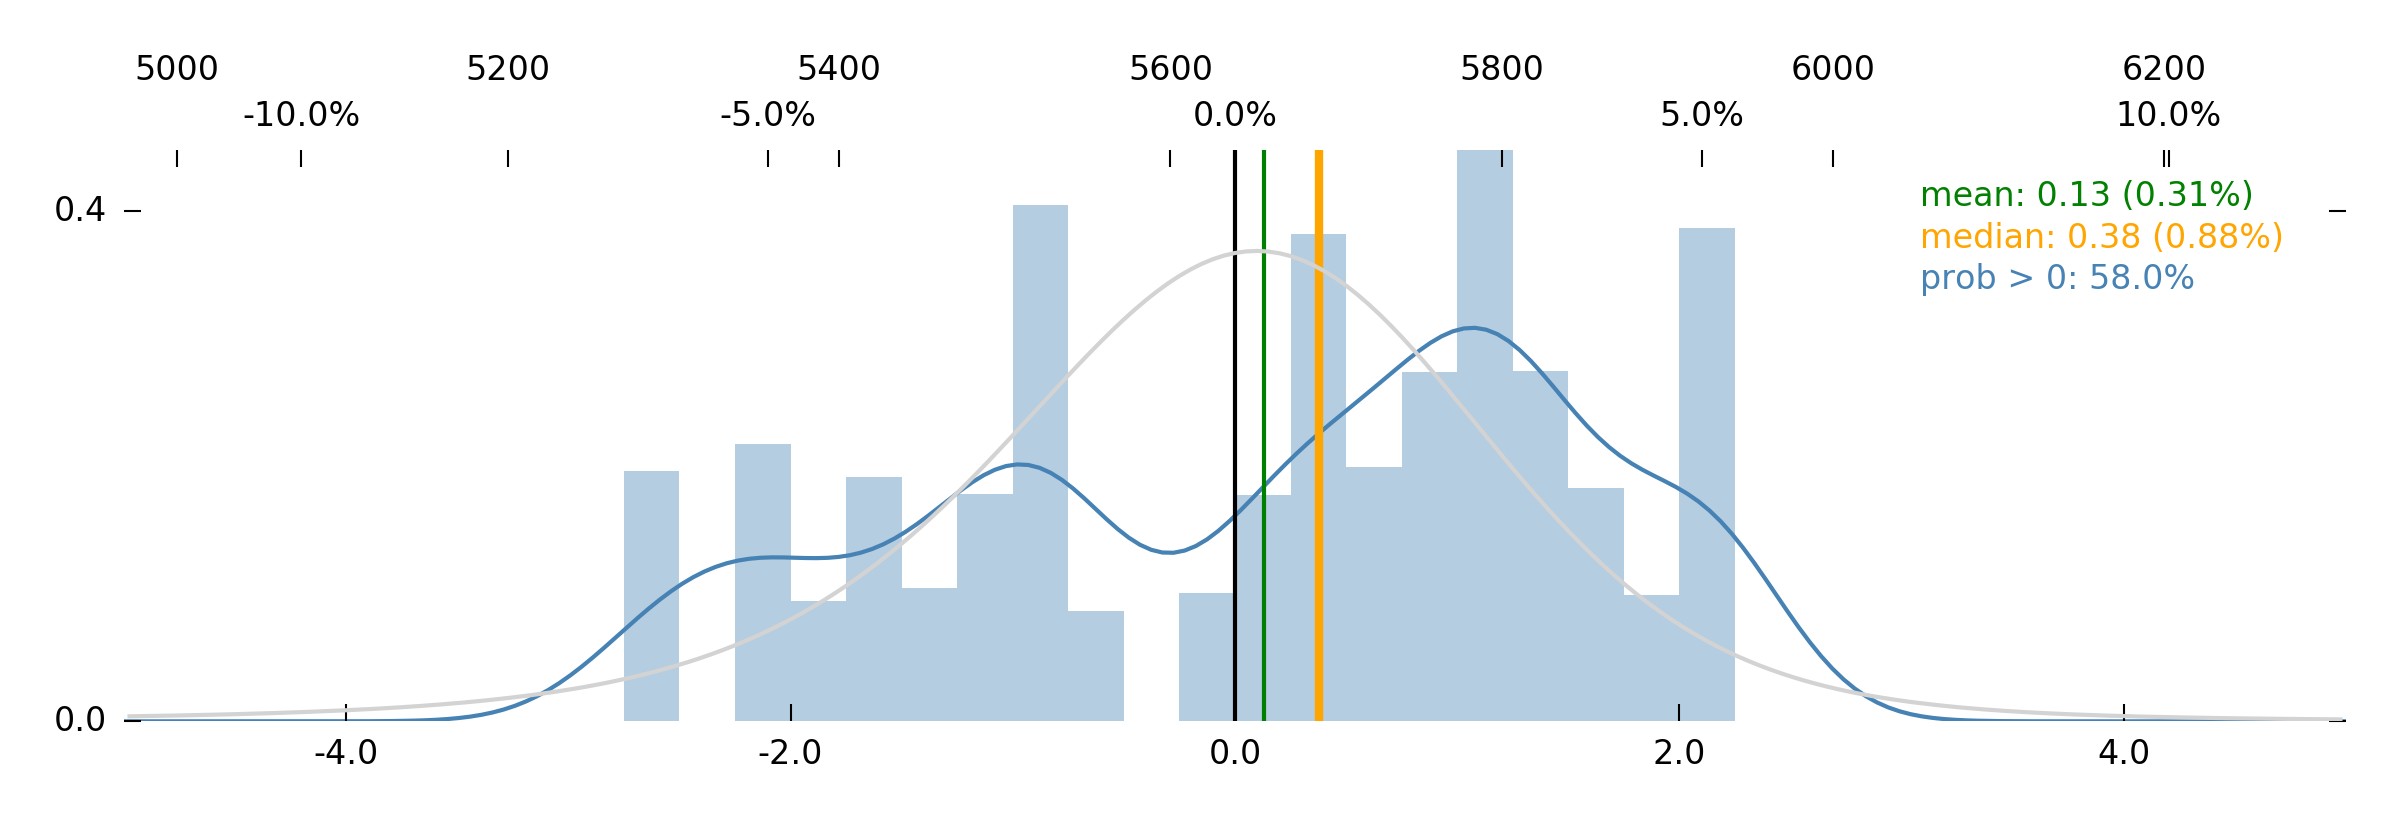
All together, Robot Jim consumes our data and comes up with this 1-week forecast:
Is it bullish? Yes, but not very. The more important takeaway is that this distribution favors long volatility.
Notably, very few events have us landing around SPX 5600. It's actually more likely that we land at 5800 or 5500. Thus, Jim predicts movement—more movement than the market itself is pricing in (because, well, VIX is 21).
So, this indecisive no-man's land that the data says we're in? Jim says it won't last, and that we have to move. It could be up or it could be down, but we have to move.
We can get behind this idea! So you'll find us long options this week, and delta-hedging at [hopefully] opportune times. We're inclined to focus on gamma (rather than vega), with 1-week options, since that's where our edge appears to be. And in keeping with the forecast, and for reasons also elucidated below, we'll [gently] lean long SPX delta in one fashion or another—because we think that's [still] the smart thing to do. For now.
Now, speaking of [hoping that we're] doing smart things, let's talk about those "games" that the market seems to be playing right now.
Games
There is a certain class of game that involves taking stupid risks or enduring pain. Whether borne out of boyish bravado or sheer nihilism, people tend to play these games when other things aren't going so well. One of these games is at the center of the market's action right now. Another such game is being spawned by these circumstances. And a third game is one that we, inspired by these events, are inspired to play ourselves. These games are...
- An "engineered recession" (Chicken)
- The Cboe Volatility Index (Bloody knuckles)
- Sector rotation (Russian roulette)
Start with the game of Chicken. This is Trump's game. "I'm not even looking at the stock market," he says, while pressing the "Recession" button repeatedly. He wants inflation and rates down—stocks be damned. Stocks, which are liquidity-sensitive critters, are playing dead in response, affecting a correction, but Trump hasn't budged. More, bigger tariffs loom on the horizon. Trump appears unbothered.
It's a weird little drama, but the whining that's allegedly coming from the market and its spokespeople isn't credible. "Tariffs cause inflation," they say, but TIPS don't seem to think so, and neither does oil. "This is chaos, and the market doesn't like chaos," they say, but VIX can't even get to 30 with S&P swinging 2.00% daily after a 10% decline.
On the surface, the market is disturbed, rebellious. Underneath, it's quite calm. But that calmness gives rise to an interesting technical effect that we've noted before, and this leads into the game of Bloody knuckles...
Portfolio managers use VIX [options and futures] to hedge equity volatility. They're long VIX because VIX is supposed to more-or-less linearly track 1-month realized SPX volatility. When it does this successfully, managers get a great hedge—when it doesn't, they don't. And specifically when VIX
underperforms SPX realized volatility, that causes problems. We've talked about this
at length before.
Because S&P is down 8.00% in the last month and VIX is only 21, that is a problem. It means that, as a PM who uses SPX vega / VIX products as a hedge, I am probably losing a bit more money than expected, and moving uncomfortably close to some risk limits. In recent years, this has given rise to a certain
"bad behavior," whereby PMs appear to hold their breath for a little while and then deleverage after a rally. It's actually remarkable how
replicable this has been.
(You would be correct to point out that the PM who moved away from "vega" and into pure "gamma" by focusing on 0–5DTE puts as a hedge will also have been quite disappointed by the PnL on those options over the past month. Most near-term puts did not pay well on this downturn.)
If there were other factors that led us to actually believe in crash risk, we'd say that maybe this is finally going to be the time that PMs cry for mercy and deleverage into the lows. Since there aren't—our guess is that this pattern repeats: They keep playing the game, even though it hurts. They wait until the market goes up, and then they sell. A temporary rally.
And now for a self-imposed game, inspired by these circumstances: If we still think it's smart to be long delta in this market, particularly because we think that the underperformance of vol is fairly likely to garner a temporary rally as a response, can we maximize our odds of a payout by picking just the right sector? Ah yes, Russian roulette!
And this—the prospect of spinning the cylinder and choosing the "right sector" to pull the trigger on—brings us back to some unfinished business.
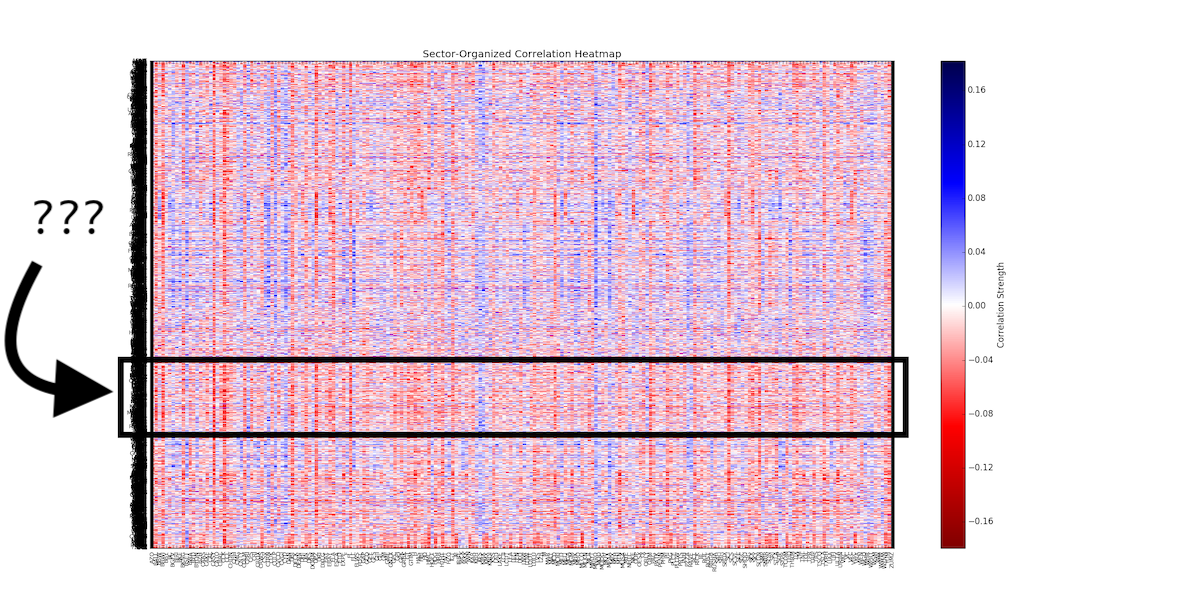
Recall that the
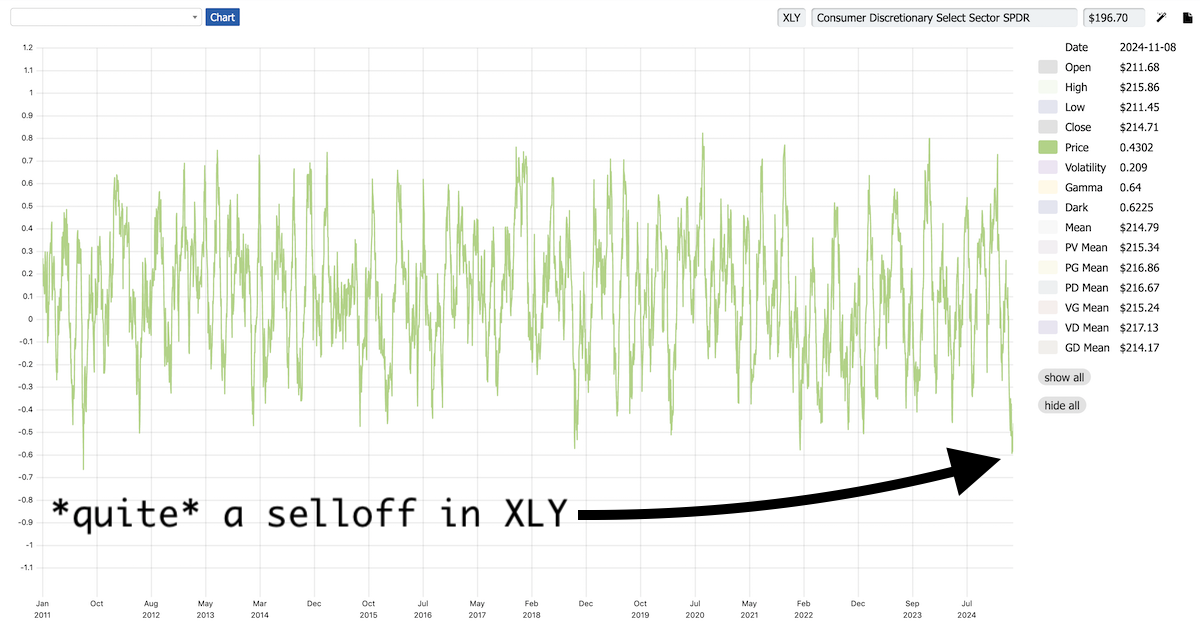
"plaid shirt" tells us what stocks have predictive correlations with other stocks, and that we found that, e.g., Energy and Utilities tend to have "antagonistic," negative predictive correlation. Well, right now, the last month has featured some pretty gnarly vol-adjusted returns in the Consumer Discretionary/Cyclical sector.
This, of course, goes hand-in-hand with the "Recession" narrative, so it's not surprising. What might be surprising is that when we zoomed in on the map of predictive correlations to find the sector with the reddest relationship with Consumer Cyclicals...
...the answer was Industrials.
Which means that when Cyclicals sell off, Industrials are perhaps the most proximate beneficiary—the next week of returns in Industrials is unusually good when Cyclicals are down.
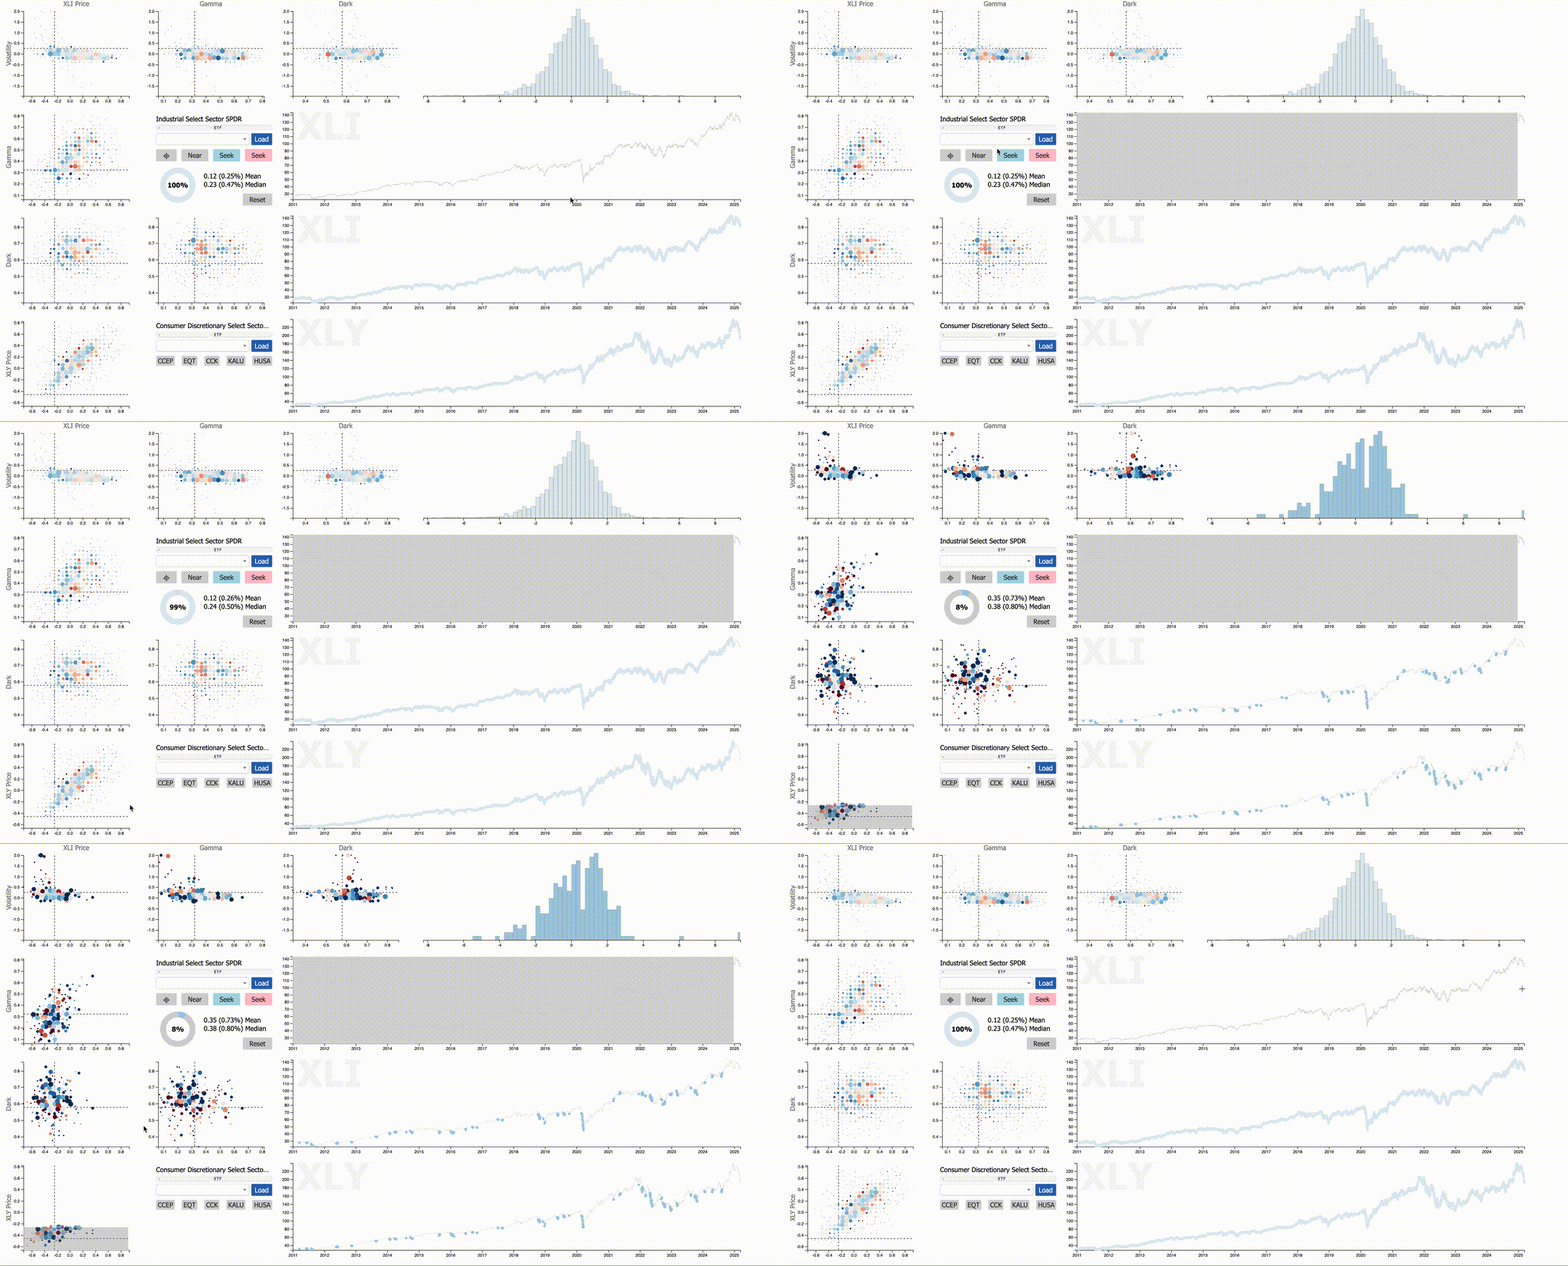
Skeptical, we checked the
k-scope on this, and, well... it appears to be true.
When XLY does really bad for a month, XLI does pretty well over the next week. Nor is this entirely frivolous an observation: For instance, XLF (Financials) do not seem to benefit from an XLY dip.
Can we, then, in the interest of fun (we are playing a
game here, after all), choose to get long some name(s) in the Industrials sector that's featured on the
Ideas page? How about Unifirst Corp (
UNF) or Northrup Grumman (
NOC)? Would these be good candidates for a week-long bounce in the S&P 500? Why not? It can only go as wrong as everything else that has gone wrong in the last couple weeks!
Finally—and very much in the vein of playing stupid games and running gauntlets and inflicting pain on oneself—let's mention bonds.
We're still long bonds, in exactly the same proportion, in exactly the same way, and for exactly the same reasons as elucidated
last weekend. So if you know whoever controls the bond market, please put in a good word for us.
Enjoy the week!
The SqueezeMetrics Team