All the charts and data we refer to can be found on the Yacht Club page.
Hey everyone,
We've been extremely conscious in 2023, and perhaps a bit obsessive, about one possibility: Bonds could go down.
This matters, in the simplest sense, because people are positioned in such a way that they assume bonds cannot, or will not, go down. This, then, impacts stocks, because marginal FOMO buying in stocks (which has driven stock gains) is strongly tied to bond returns.
We're not going to re-hash this for the hundredth time, and we're not going to do a stupid "told-you-so" because bonds went down a little bit and stocks went down a little bit and people seem surprised about it. But we do want to think and talk about it for a minute.
So let's take the same format as last weekend. In the third section, we'll talk a bit about Strategy, and then a bit about Research.
But first...
- Stuff that happened
- Stuff that might happen
- Other stuff that might happen, and stuff that we need to make happen
Stuff that happened
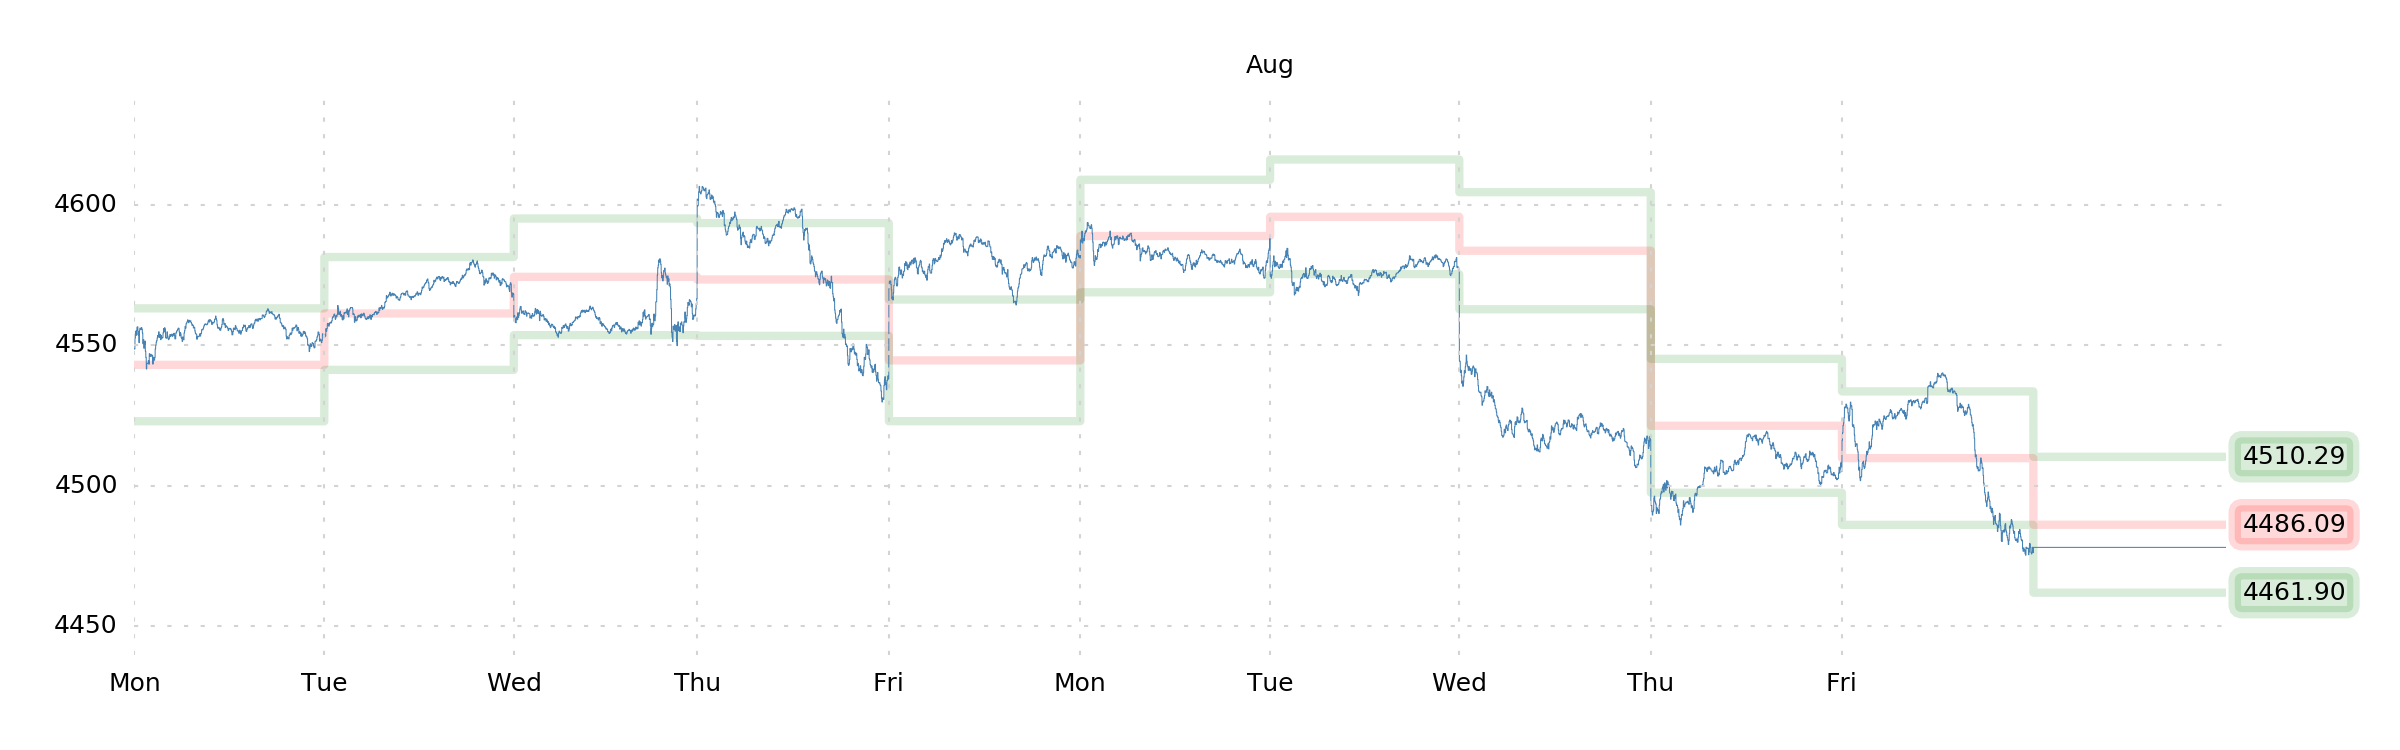
Last weekend, we said that the S&P was obviously betraying some fear with respect to bond prices going down, specifically on that Thursday. Even on an intraday basis, stocks were jumpy about bonds, and when TLT shot below $100 (we mentioned a few weeks ago that people are discretionarily drawing lines on charts to make these decisions and you should expect this sort of thing), stocks got hit pretty hard.
Well, this past week, TLT went down a fairly substantial 3.29% (20-year T-bonds up 14bps to 4.36%), making good on its threats. And stocks made good on their betrayed sympathies.
Perhaps suggestive of the relative mildness of the SPX decline (2.27%), however, is that—while this was exactly the scenario we've been fussing about for months—last weekend's optimal GOOSE spread, a condor, still returned a full profit. Robot Jim thought that a shoulder move was fairly priced, but that a tail was very unlikely. This week implicitly qualified as a shoulder move. Shorting the tail still worked.
And this leads to the next question—if stocks seem to have underreacted to the magnitude of this bond selloff (and all other things being equal, we'd say that they have), then are we due for more downside?
Stuff that might happen
And while we'd love to say "yes," we can't honestly say yes, because we're still not positioned for it.
Despite beating the bear market drum every day for months, and despite waiting breathlessly for TLT to break down toward its 2022 lows as confirmation that people are positioned too heavily long bonds—we still don't think the stars align for a good, short-term-data-driven SPX short.
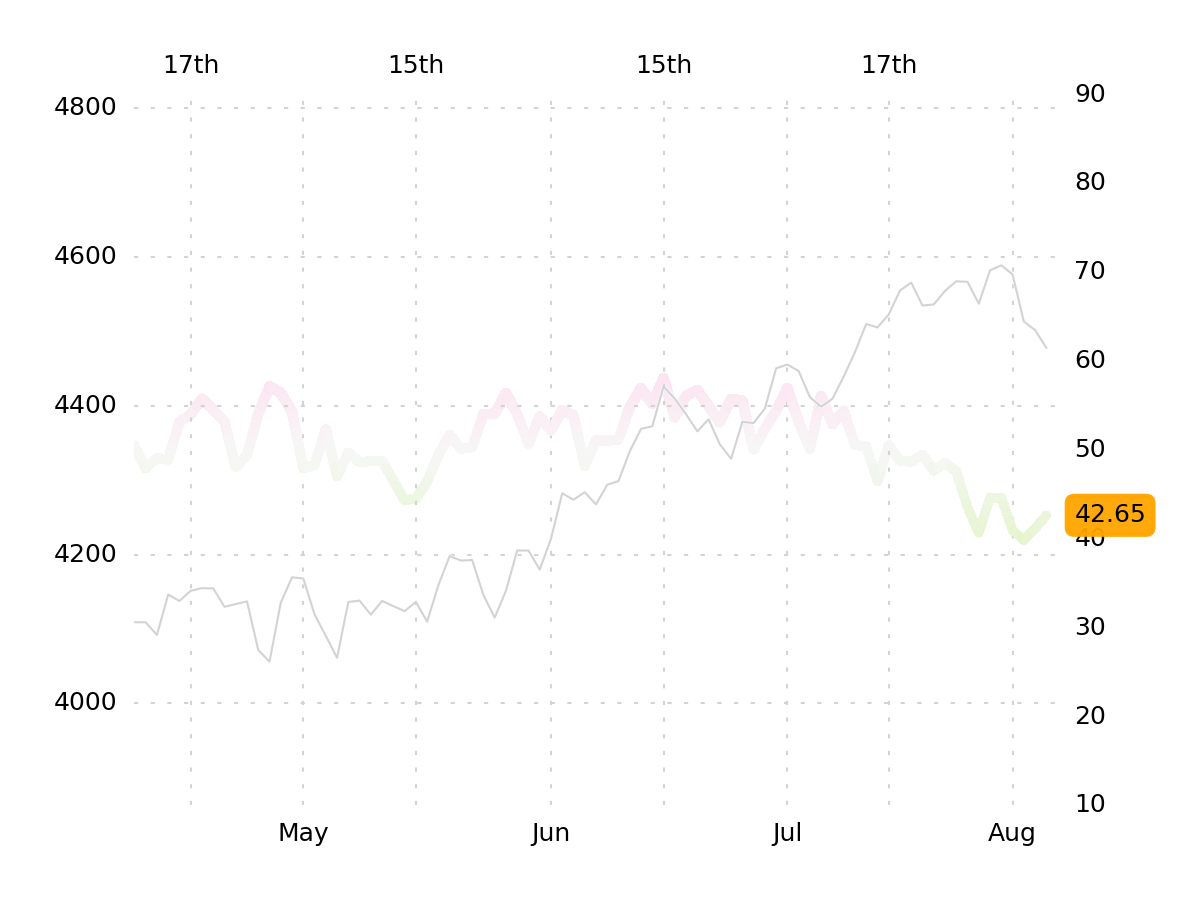
Why? Broadly speaking, because we think that the vol response to the bond selloff has been fairly large, on a relative basis, and is likely to insulate the S&P from breaking down. Here's an opportunity to refer to VIBE (The Volatility-Implied Bullish Expectation), which tells us that front-month VIX futures have been rising a bit more than average in response to the increase in SPX volatility.
This suggests that some folks may have been quietly, slowly getting positioned for the possibility that SPX turns over. Nor can we blame them—we've been thinking the same things. Interestingly, this matches up with the intuition from last weekend, that, even on an intraday basis, a lot of eyeballs were on TLT, and were prepared for bonds to sell off, and for a potential impact on stocks.
Now, certainly, this doesn't mean that the index can't keep going down. Obviously, a lot of factors are going to feed into that. But our suggestion here is that a significant amount of people were actively insulating themselves against a decline (or positioning to benefit from one), and likely for the same reasons that we were thinking about it.
And as much as we believe that VIX ought to be something like 20+ in this type of market, the reality, right now, is that the liquidity implied by GEX+ suggests that near-term vols are not cheap. To see this, we need only refer to Robot Jim's 1-week forecast—which we were going to have to bring up eventually anyway.
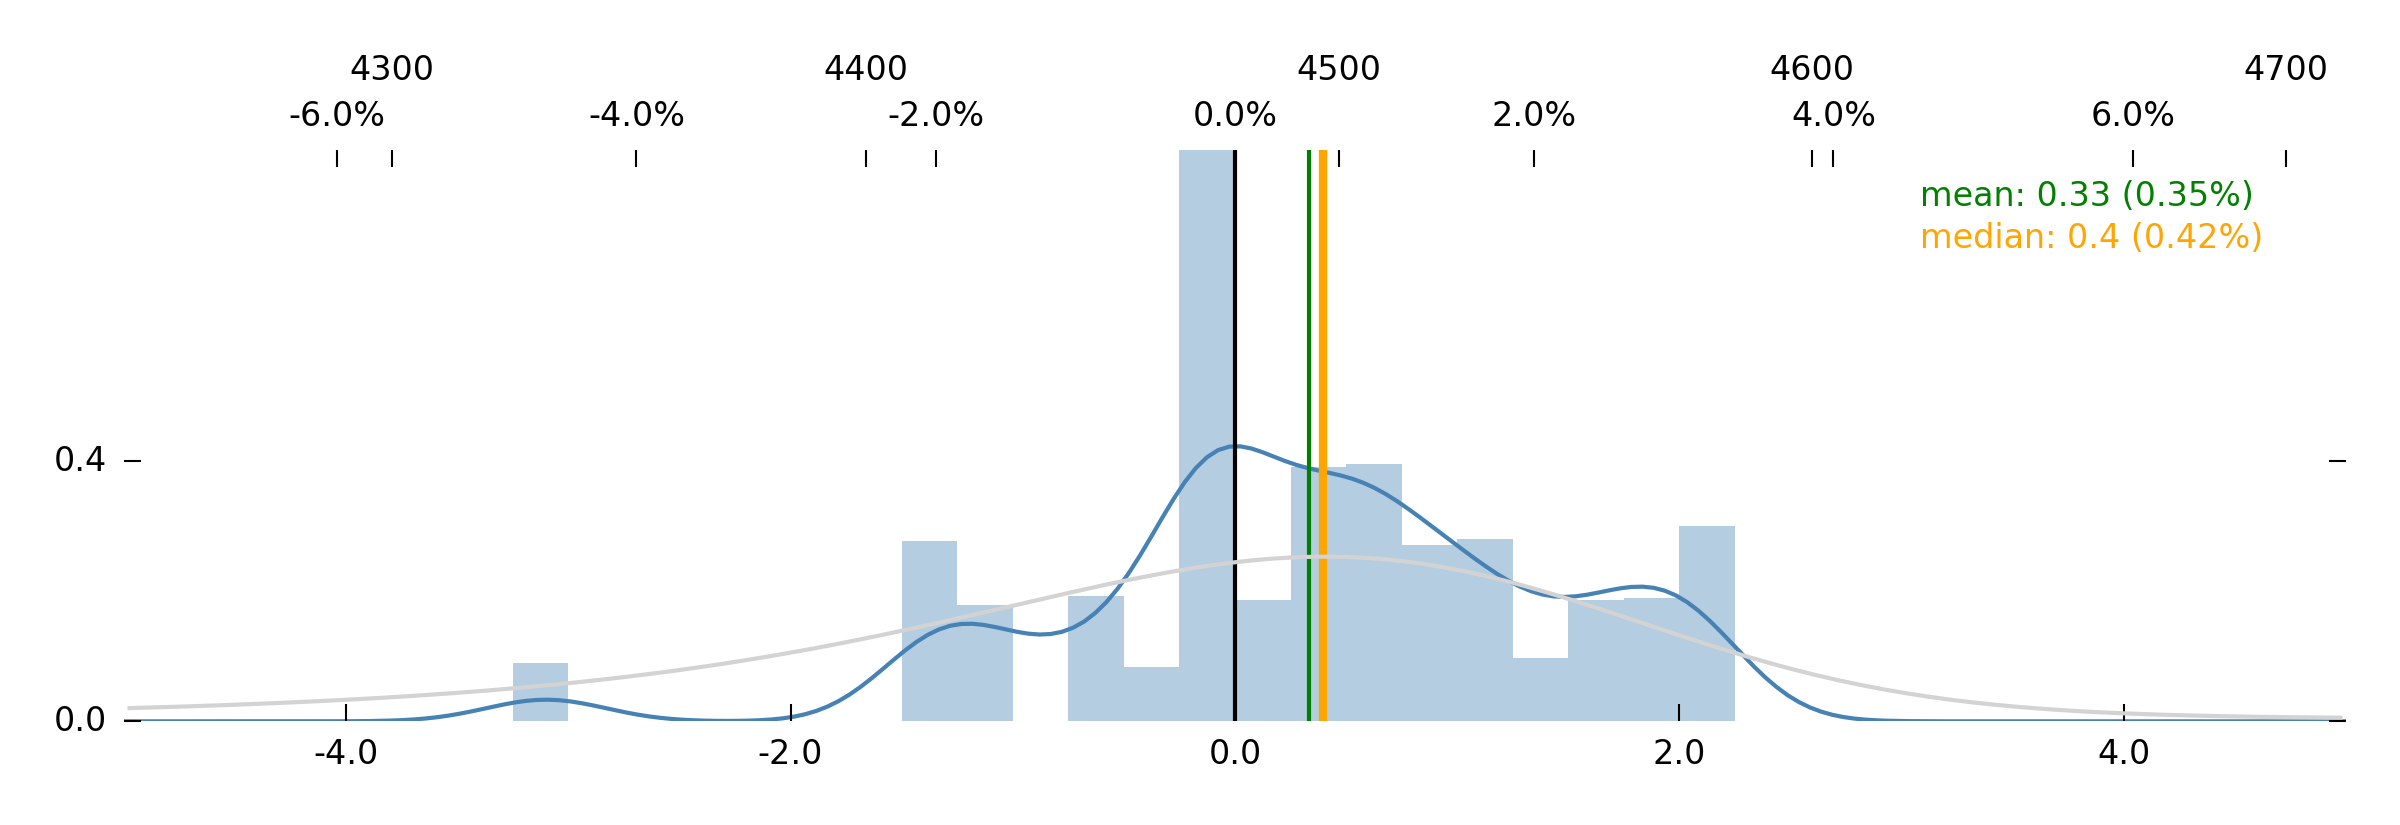
Yes, Jim finally sees something resembling a left tail, but he also says that the market is overpricing that tail (gray line broader than blue and higher in tails).
Furthermore, Jim seems to think that the likely outcome is pretty boring, with a big lump of underappreciated probability in the -0.50% to +1.50% range. A 4475-centered (and 175-wide) butterfly is the GOOSE-favored spread for the situation.
So yeah, it may seem strange that we've been preaching irony and doom about bond returns, but now that it's actually happening, we're sitting here doing nothing.
(An aside: Frequently printed at the beginning of Nathaniel Hawthorne's Scarlet Letter is a weird little autobiographical note called "The Custom-House," which contains this haunting quote:
"It is remarkable, that persons who speculate the most boldly often conform with the most perfect quietude to the external regulations of society. The thoughts alone suffice them, without investing itself in the flesh and blood of action."
We grimace at this frequently. We would not want to be accused of this.)
But anyway, the point is, well... let's talk about it below.
Other stuff that might happen, and stuff that we need to make happen
We haven't lost an opportunity to say that this is a bear market; yet, we haven't actually been bearish in the last four months or so. Mostly, our forbearance (hah, get it? for-bear-ance?) is owed to Robot Jim, and hopefully you, too, have benefited from his fairly sanguine outlook.
But now that we expect some of that cynical FOMO in stocks to subside, as bond returns disappoint, we want to opine, briefly, only about the possible shape of a decline in stocks (to say nothing of when such a decline occurs, because we're still not positioned for it).
Here's the basic idea: There hasn't been net put-selling in 2023 like there was in 2022. We would say that this is at least partly a result of higher yields being readily available, ripe for the taking. I.e., selling VIX under 20 isn't going to give you more "income" than just buying some corporate bonds right now.
As such, the likelihood of a decline in stocks turning into a full-blown crash seems unlikely. Not only are people, overall, under-invested in equities (at least relative to history), but nor are they aggressively selling puts, or volatility. As such, it doesn't seem like there's a high likelihood of folks getting caught on the wrong side of that trade and precipitating a crash.
And that's really all there is to it. A decline in positive S&P flows seems likely, but we'd guess that it doesn't trigger something like VIX > 40. Not until the shape of the positioning/flows changes, anyway. What's more likely is the bullish vibes grinding to a halt, and then a beginning of monotonous moves lower.
In other words, we're not worried about "missing out" on the bear market.
Now, speaking of the "shape of positioning and flows..."
***
We were talking about RISC and VIBE, the Realized-Implied Spread Calculation and the Volatility-Implied Bullish Expectation. What we said last weekend was that VIBE is basically meta-RISC, or the derivative of RISC; because while RISC measures the simple spread between 1-month realized and 1-month implied volatility, VIBE measures the spread between change in 1-month realized and change in 1-month implied volatility.
Now, what we're going to propose here is that RISC, by measuring that spread, is implicitly a measure of positioning, whereas VIBE, by measuring the changes in the components of that spread, is a measure of flows (and this matches with our idea of it as a "sentiment" indicator, which is why we called it VIBE in the first place).
In this sense, we might think of RISC and VIBE as comparable to VGR and NPD, where VGR is a measure of positioning (measuring customer positioning re: vanna and gamma), and where NPD is a measure of flows (daily 1DTE+ net put deltas).
This may turn out to be too aggressive a comparison, but it's the first thing that occurred to us when we drew the connection between RISC and VIBE, and we wonder if there will end up being some conceptual overlap (hopefully the concepts are similar, but hopefully, also, the data ends up giving us a distinct signal).
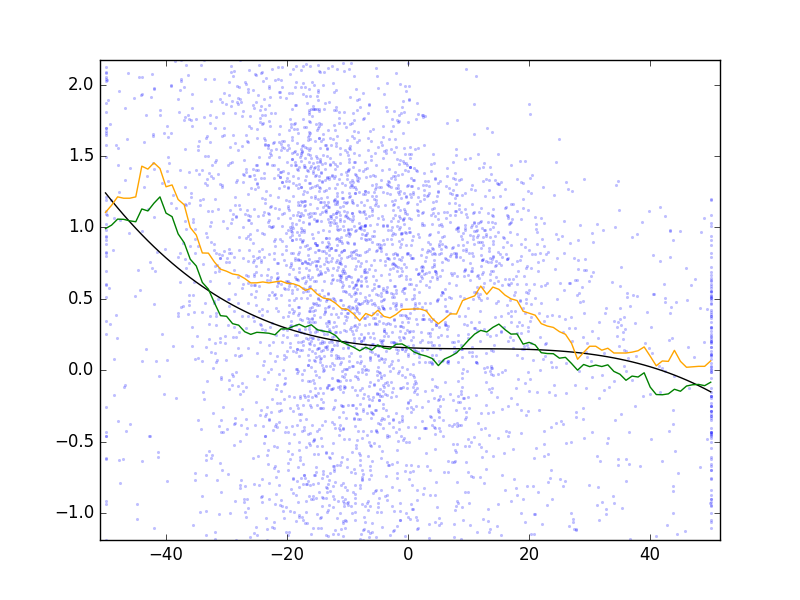
As a reminder, here's the signal coming from RISC: These are 1-month SPX returns, normalized to volatility (so, 1.0 on the y-axis is a +1 MAD return), with RISC in the domain [-50, 50].
When RISC is -50, that means that 1-month daily realized moves are 0.50% less than 1-month daily implied moves (i.e., options are really expensive). This is, of course, where S&P returns are best (+1 MAD).
The ultimate win here would be if VIBE, when re-derived using only a SPX/SPY ATM vol data source (instead of VIX futures data), ends up (1) working at all, (2) pairing well with RISC, and (3) if we're very lucky, adding additional value to the RISC signal.
Again, we're optimistic about this because we believe the signals in RISC and VIBE are similar-ish to NPD and VGR, in that they denominate positioning and flows, respectively (and by showing different-but-complementary things, they add value to each other).
So we're going to start by re-imagining our VIBE data, using ATM vols instead of VIX futures. We'll try to get that done by next weekend. If this works, it will be a tidy little nugget of data that would look pretty next to RISC. And, ultimately, we hope it will do more than just look pretty.
But more importantly, what looks very pretty right now is a little chair out on the veranda, in the rapidly waning August light.
The SqueezeMetrics Team