Our inclination, at this point, is to try to work this [predictive correlation] data into the platform—that there should be a sort of "recommendation" system for what correlated stock you might want to look at while you're looking at a ticker on the k-scope. Does that make sense? This sounds potentially quite powerful. Let's try to make it available.
Well, we did it!
Let's talk about that.
But first...
- The best-laid plans
- Often go awry
- Predictive correlations
The best-laid plans
The plan was...
To just be "long gamma" into the beginning of the week. And we'll go from there.
This certainly wasn't the wrong idea.
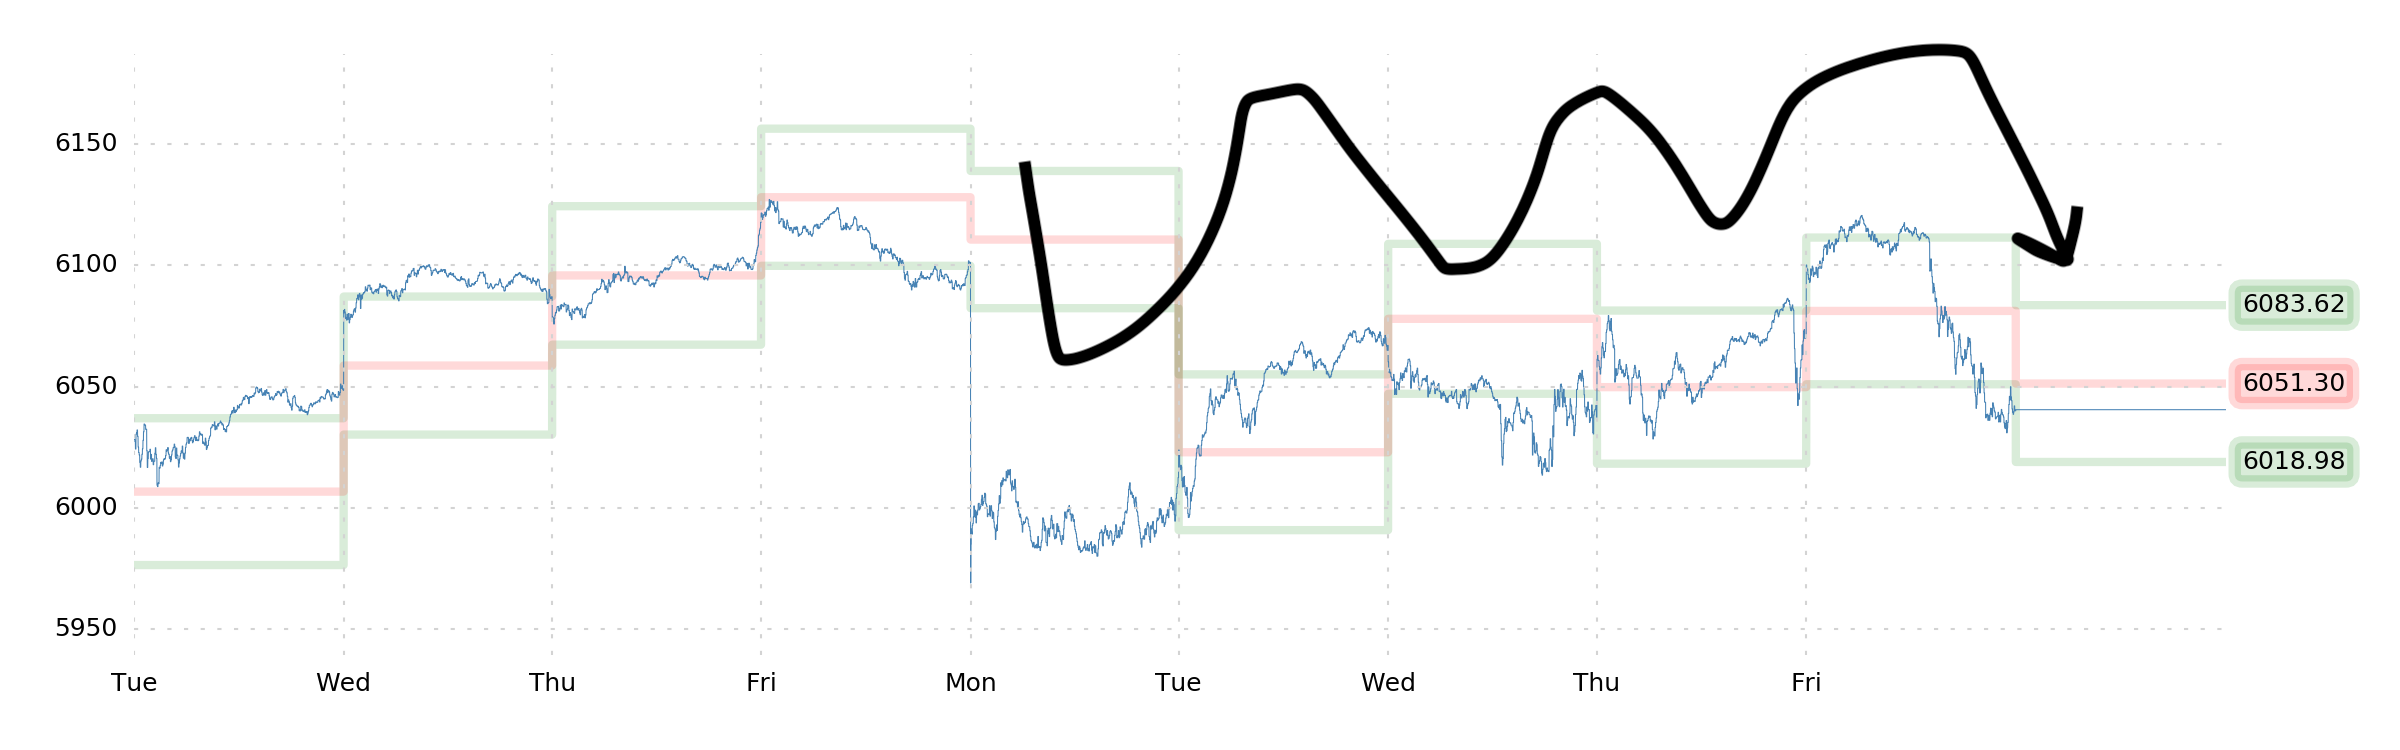
The index wiggled a lot, and ended down a percent. Five out of five days traded outside of the Support-Momentum bands. A long gamma position definitely won with just about any hedging scheme.
However, as the week wore on, we gradually moved toward a simple short position, extolling the virtues of either short E-minis or a long put spread. Realistically, this trade, if entered into later in the week, is pretty much flat.
So while we felt like we had a good idea of what was going on, a pretty good and useful forecast, and positions that were in-line with that good information—we just sorta ended the week flat (and you may recall that we were long a put into this week... well, it was actually a 6000-strike put position expiring on Monday, and that huge gap down on Monday pretty much pinned 6000, so that didn't go great either!).
Shall we expect more of the same? What's the plan?
Often go awry
Jim still has the probability of upside at just 48%.
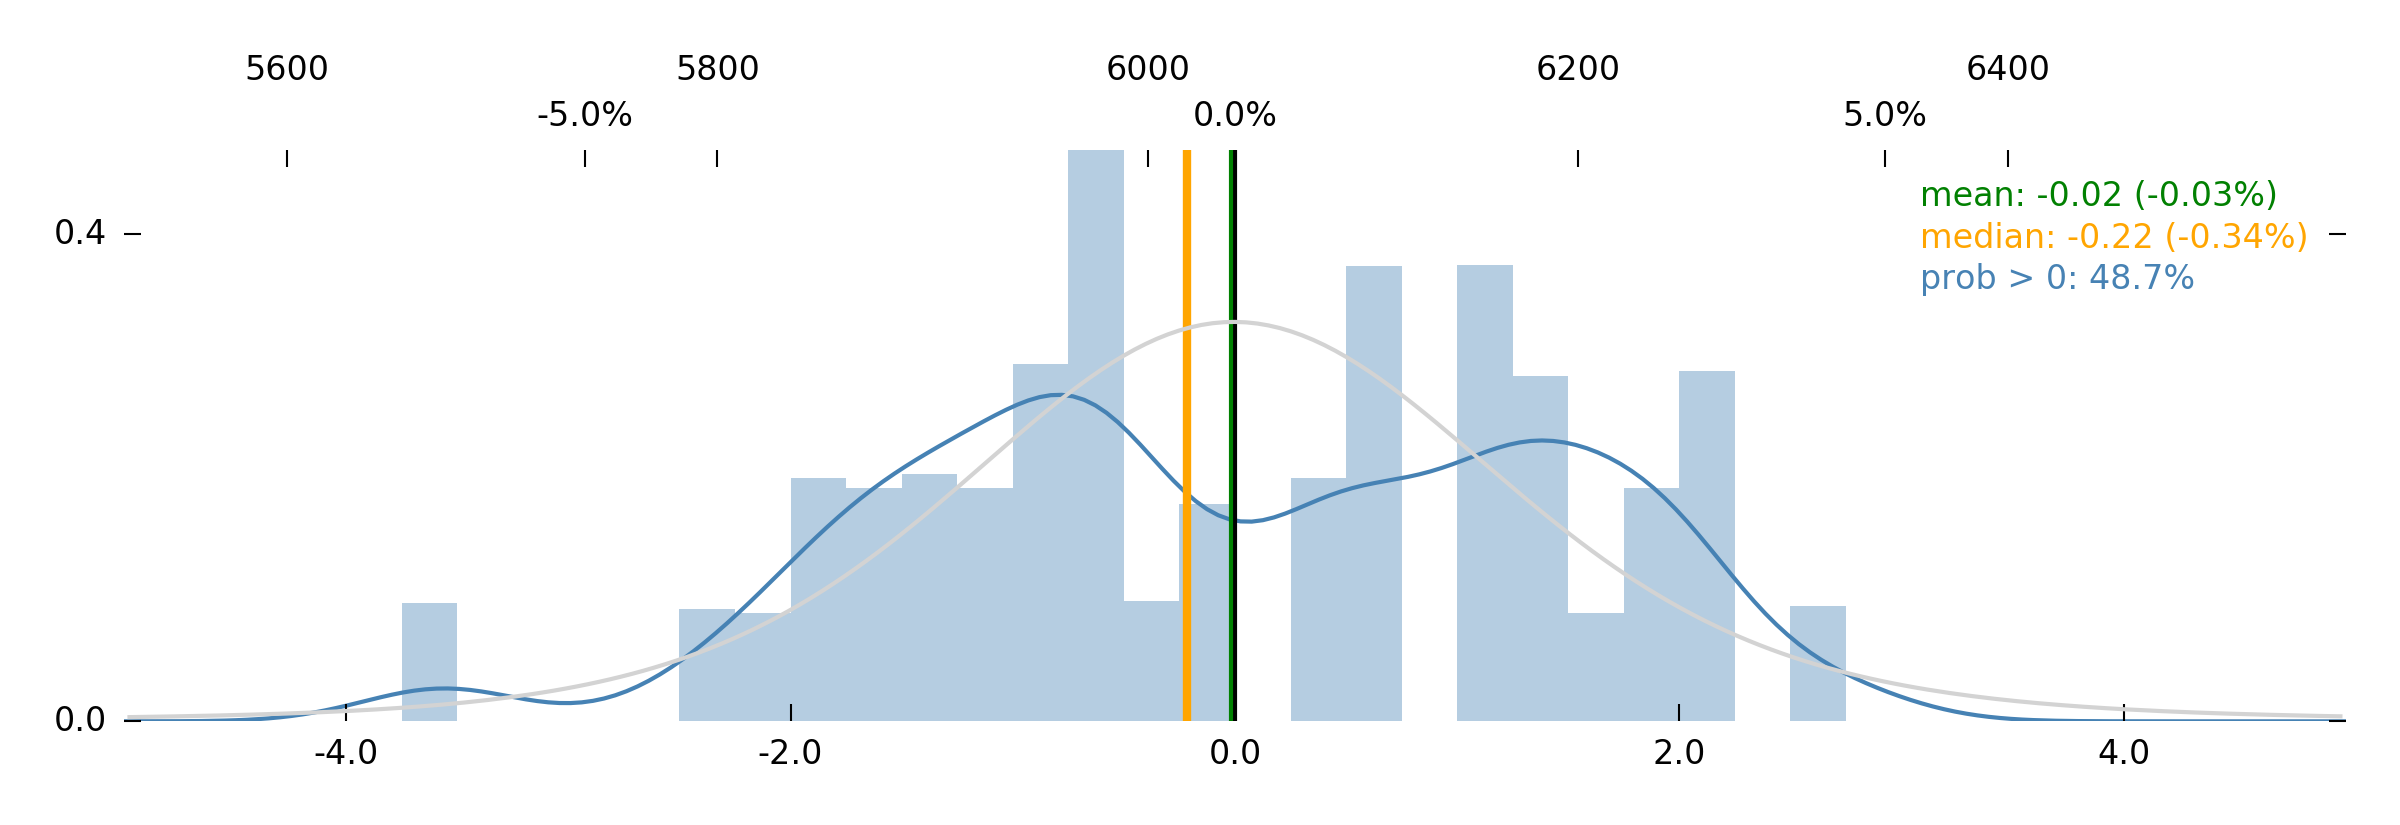
And, like much of last week, there's also a sort of weak "bimodality" to the distribution, whereby a move to 6200 or 5900 is actually more likely than SPX sitting still. This is interesting, because once again, it encourages the use of a long-gamma approach—and who are we to shun what's so clearly been working?
We could comment on "dispersion" here, but you probably have someone yapping in your ear about that already. Let's not be surprised if, generally speaking, more of this keeps happening. There are going to be winners and losers in generative AI, and trade wars, and in the the disassembly of government. That's just gonna keep happening.
Gently long gamma and, if we're being honest, we're already carrying a bunch of short delta from last week too.
Predictive correlations
Honestly, we're really struggling to figure out what to say about this stuff. About the predictive correlations. Like—there they are. You can click 'em. You can see that it's real. But if you click them, you'll just end up going down a rabbit hole, asking more and more questions.
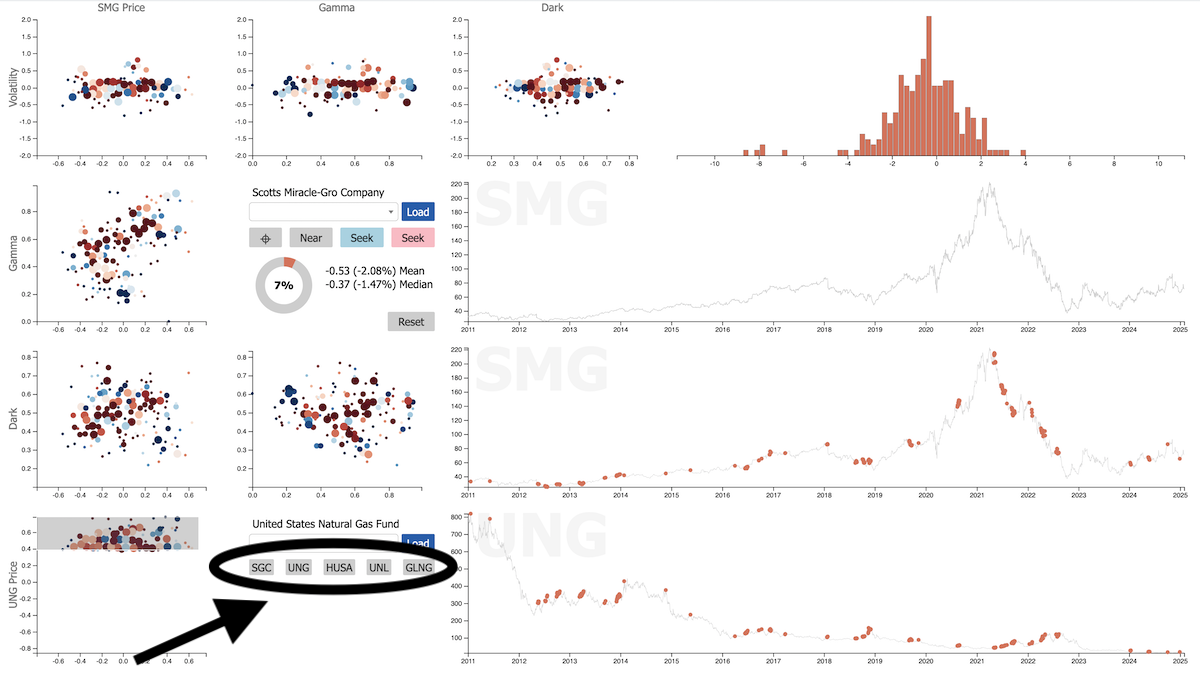
For instance, you can see that Scotts Miracle-Gro (SMG) is predicted by the Price of the U.S. Natural Gas Fund (UNG), and you can reason about that for a minute. Our guess is that Scotts isn't buying swaps or futures to hedge their indirect nat gas exposure via their huge fertilizer need (planting grass, harvesting seed, dunking that seed in nitrogen fertilizer, selling bags of nitrogen fertilizer to consumers, etc.). So whatever price they get for nitrogen fertilizer is coming largely from the input commodity itself. Weird, but seems to be the case.
And then at any given moment while clicking through these tickers, you're probably only two degrees of separation away from Constellation Brands (STZ), or Golar LNG (GLNG), or Coca-Cola (KO), or Casey's General Stores (CASY). And maybe that's what America's all about (alcohol, natural gas, Coke, and cheap pizza?), so maybe it makes sense that these predict a lot of stuff—but by golly our heads are spinning from trying to figure this all out.
Is it worth trying to map out these predictive correlations a bit more comprehensively?
We really don't want to do that, but maybe it's important...
...oof.
In any case, we're not going to provide you, dear reader, with any clear guidance or goals this weekend. Because we're confused, and we need a minute to think.
In the meantime, please do take a look at the "Ideas" page, and note that there are "Sector" and "Industry" columns now included. We thought this would help. And then when you're done looking at that, spend a bit more time with the k-scope, and click on those correlated tickers. There are some real melon-scratchers in there. Send us your favorites! (We really like the relationship between "normal" utilities and "nuclear" utilities. They're cointegrated, but there's a negative predictive correlation. And that's fun and useful.)
Enjoy the week!