All the charts and data we refer to can be found on the Yacht Club page.
Hey everyone,
Everyone loves to talk about VIX. They talk about how it's high, or how it's low, or how it's under accumulation, or how it's forming a bear flag and it's time to sell it, or how it's gonna go to 100 because the End is Upon Us.
They also talk about how it doesn't work properly, or how it's rigged, or how it's reduntant, or whatever. As such, discussions about VIX are generally quite low-signal, and are typically a platform for misunderstandings and crank opinions.
VIX printed 70 in pre-market two weeks ago, and how it's 14. There's something wrong with that. At least that is our crank opinion. And now that the insanity is all over with, let's talk about why we think it's a problem.
But first...
- We knew it'd go up (down)
- We know it'll go down (up)
- The VIX is too damn high (low)
We knew it'd go up (down)
Our position for this week was an SPX put option. A long put options benefits when implied volatility goes up and/or when spot price goes down.
It turns out, though, that implied volatility went down and spot price went up.
We don't have a put option anymore.
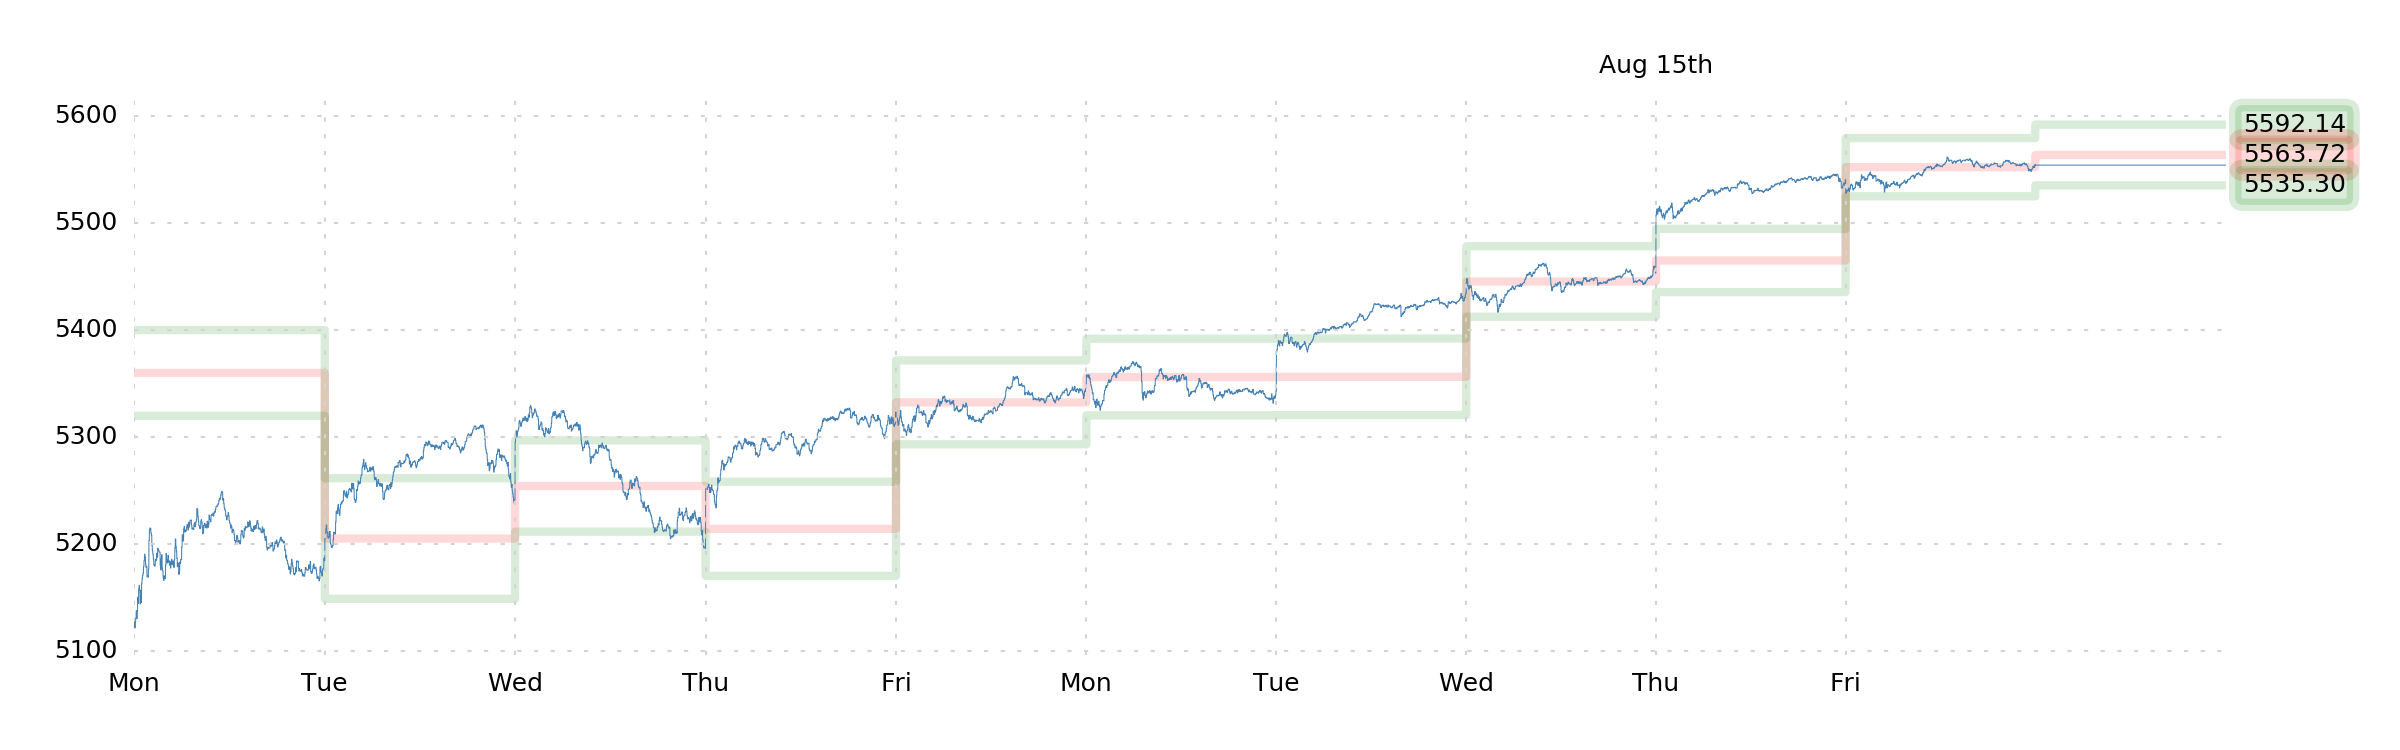
This is not as upsetting as it sounds: Our thesis was that a 5% move was underpriced. The outcome was never likely to be a >5% move, despite this being the "smart bet." So we're not terribly disappointed. And at the risk of sounding a bit corny—we feel like we got the better part of the rally anyway. On both Tuesday and Thursday, we were long at the Momentum band and holding till close because of the 0DTE setup (which indicated a substantial amount of customer long call positioning above spot).
So it ended up being a perfectly suitable week, even though we weren't "right" about anything.
Now of course it is worth noting that the S&P 500 is up some 7.00% from its lows earlier this month. It's been a substantial rally. We are naturally inclined to bet against stuff like this (an inclination that generally does us no favors), so we're keen on finding an excuse to have some short delta—an impulse that we will attempt to gratify in a moment.
We know it'll go down (up)
The week ended on a fairly bullish note. Indeed, R0B0-J1M had been getting increasibly bullish as the week pressed on, and as GEX+ rose above $1bn—liquidity land.
So it's no surprise to us that His Silicon Eminence is still barking up the bull tree.
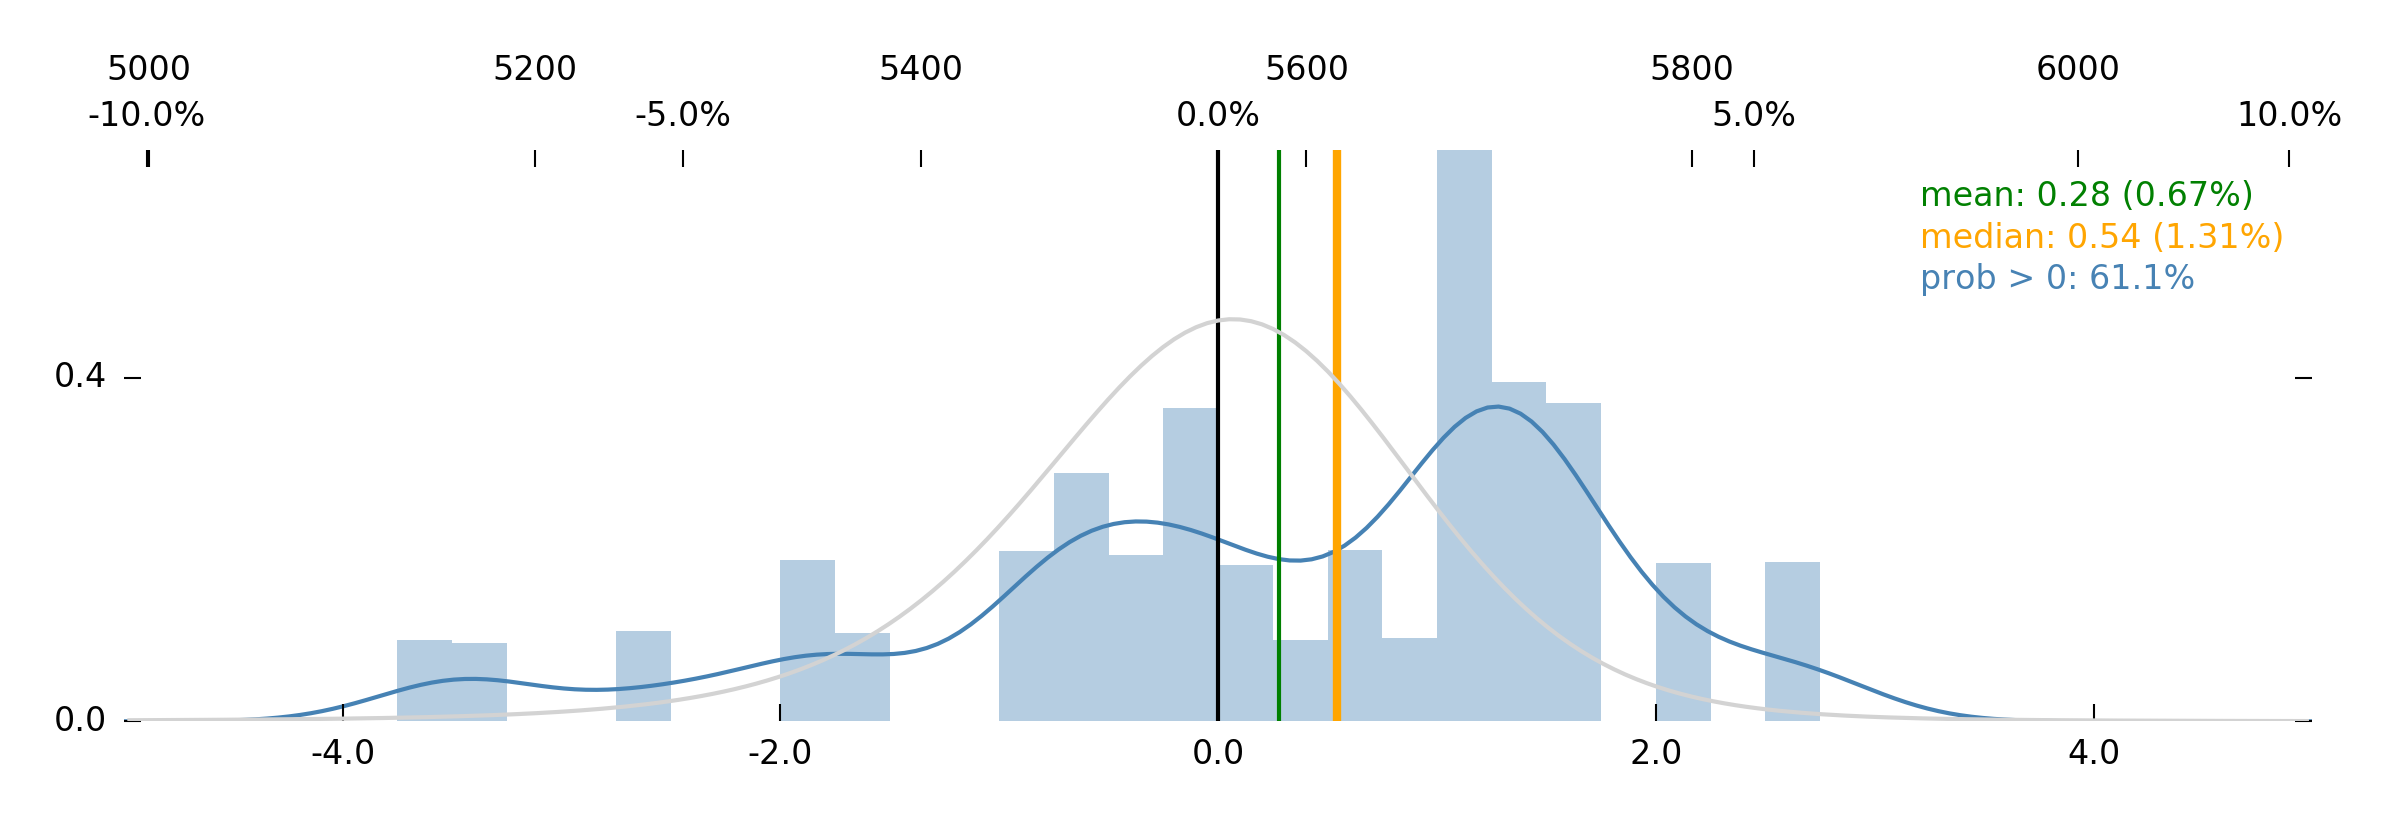
This 1-week forecast distribution has a median of 1.31% and a nice big lump of probability around SPX 5700. There is obviously a good bet in there, ostensibly in being long a call option. Yet, at the same time, there appears to be an advantage on the other end of the distribution—a long tail is present!
We don't speak of "long tails" often, and we don't speak of them lightly. This is a significant left tail—the kind you want to be hedged against. We're not sure we've said that any time in the last several months, so... take note. It's notable.
Taken together, the message from Jim's distribution appears to be, "be long vol." Again, this is not a message we've been getting frequently, as Jim seems more keen on simply agreeing with the market's implied distribution lately. Here he does not.
That's pretty exciting. The implication is that we can choose our favorite long-vol-leaning structure, with whatever delta we desire, and expect to be on the right side of the trade more often than not. Our inclination is to keep the cash outlay, and the effort, to a minimum, and to buy a fairly wide strangle (e.g., +5650C +5400P). This can be "managed" (rolled, spreaded, delta-hedged) later on if one of the legs works out, or as the forecast changes.
But in any case, we're inclined to go into the week long gamma.
The VIX is too damn high (low)
We think there's a problem.
We've spoken before about the "real reason" that VIX exists. Let's reiterate that here, and clarify, because it's important:
VIX is a way for someone with a big equity portfolio to hedge exposure in such a way that matches "institutional" expectations for risk-management. I.e., a hedge that prevents some kind of portfolio volatility "risk limit" from being breached. The VIX call option is probably the best example of how this works—if I calculate that my portfolio will start getting unwieldy and require liquidation if S&P 500 is regularly having 1.50% average daily moves, I can simply buy a call on VIX that corresponds to about that level of realized volatility (~30 VIX). Now I know that, as S&P 500 volatility rises above that level, I'm getting protected from the need to liquidate.
This is why, if you ever looked at the older VIX "Fact Sheets" and other advertising materials, the only statistic that was actually pushed to the forefront was that VIX correlates strongly to S&P realized volatility. The pitch was, "Yes, it's based on the option market and 'implied volatility' and fancy math, but it basically gives you linear exposure to realized volatility." And since institutional "risk limits" are often (or inevitably) a function of realized volatility, the customer feels like they can use the level of VIX as a decent proxy for "current realized S&P vol." And thus hedge with it, and avoid liquidation.
What this means is that Cboe was trying to pitch VIX as an index for a type of "volatility swap" product (VIX futures). Markets for real volswaps tend to fail because it's painful and expensive for dealers to replicate the PnL of a volatility swap (which is linear to volatility, and requires one to dynamically hedge in options themselves). As such, the only way a volswap market can exist is if there's quite a lot of real two-way flow all the time. That doesn't ever work out. The solution? Use the "variance strike" as an index (VIX), make a static hedge more-or-less possible for dealers (by buying a strip of >30-day SPX options), and then instruct the customer to accept a reasonable amount of tracking error with respect to realized vol. A small "fudge factor" and everyone's more or less able to meet in the middle.
Good for customer, good for dealer, good for Cboe.
Looking through Cboe's VIX marketing materials right now, though, we don't see any mention of the correlation of VIX to SPX realized. This may be because saying this nowadays would invite criticism. The correlation numbers probably aren't as good as they used to be.
And the reason for this has got to be what you saw in the past two weeks. Even if you ignore the unhinged 70 VIX prints from the morning of Monday the 5th, you had VIX spike to 40 in cash hours on an SPX move that, frankly, didn't justify that—and then it round-tripped back to a 14 handle while SPX realized volatility went up.
If we're expecting VIX to go up with realized volatility—well—it overshot. And maybe that's not such a bad thing for equity risk hedgers, but the inverse is quite problematic: When VIX is in the 14s but the average move in the S&P 500 over the last month is over 1.00% (corresponding to more like 20 VIX), anyone who holds long VIX futures or long VIX calls is kind of getting a raw deal.
And if the customer is getting a raw deal, there's a higher likelihood that they're hitting their risk limits despite thinking that they'd be hedged against the volatility—and thus we imagine, right now, that there's a higher probability of a "surprise" deleveraging, and of broad discomfort among those people who trust SPX vega and VIX, and those things that are tied to it, for tracking and hedging portfolio volatility.
Can the customer adjust to such a scenario? Of course! But the way that one adjusts to this scenario is by using something completely different to hedge, or by deleveraging. It's actually kind of a big deal if VIX doesn't work like it's supposed to, and like people were expecting it to work.
Ok—does that make sense? Maybe. But we need a bit more substance than this. We're claiming this problem from the last two weeks is actually a broader problem from the last few years, but this is mostly anecdotal. It's something that we've felt. So let's dredge up some numbers to justify it, if we can. Testing this should be easy: We already have a measure of the differential between S&P realized and S&P implied volatility (RISC), and we already have VIX. Both of these are next to each other on the GEX+ Spreadsheet, so let's just pull that up and start thinking.
Specifically, the problem is if—when VIX rises—it's not tracking the 1-month S&P realized volatility very well. So if, when VIX is suitably high, that corresponds with a maxed-out RISC of +50 or –50 (meaning that S&P realized and S&P implied are disagreeing by >0.50% in terms of S&P daily expected move), that'd be a bad thing. It'd be especially bad if high VIX tends to correspond with a RISC of +50 fairly often, because that would mean that realized is higher than implied, and this would be the exact thing we're talking about—where VIX as a hedge against realized vol is failing.
So let's start with a simple test: How often, across the whole dataset since 2005, is VIX >35 (a big deal) and RISC +/–50? How often has this problem happened?
149 days. Perfect. Over half a year's worth of days.
Now split the whole dataset in half, at 2015. How many days was VIX > 35 before 2015? And then how many of those days had a problematic RISC of +/–50?
190 days of really high VIX. 59 of those days with a huge spread between IV and RV. So, 31% of high-VIX days had this problem before 2015.
Now do 2015 to present.
58 days of really high VIX. 40 days with RISC indicating a huge spread. So, 69% of high-VIX days had this problem.
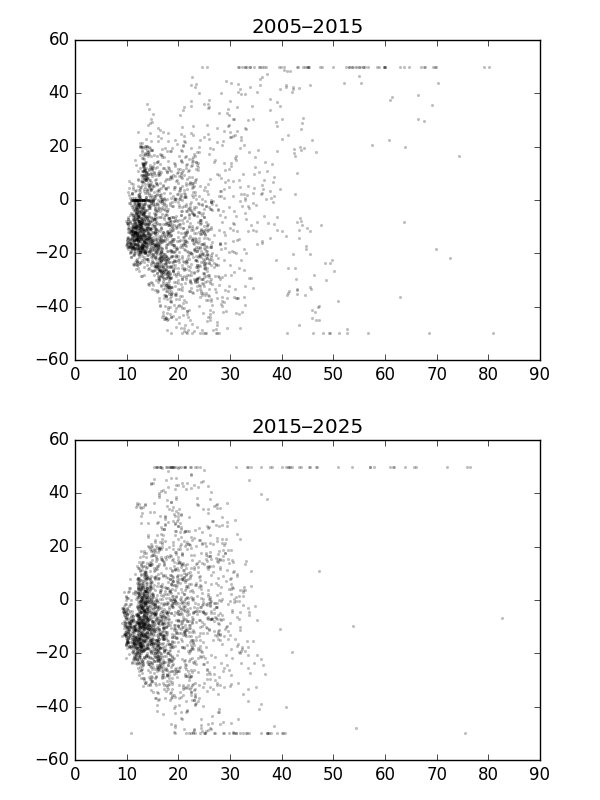
Yes! That's what we were thinking would happen. Let's try plotting this out to understand it better. Maybe a time-series...
Nope, that's an absolute mess. Can't make it look good. So let's try a scatterplot with VIX vs. RISC.
Yes! Look!
Stare at it for a minute. See how many dots there are in the pre-2015 data (top) that are above 35 VIX on the x-axis and with a reasonable RISC between +50 and –50, indicating little tracking error? There's a whole cloud of data there. Now look at the >2015 (bottom). There are plenty of dots at +50 on the y-axis (where realized is much higher than implied!), but there are hardly any examples of RISC between +50 and –50 when VIX is high. It's barren in the middle of the plot!
It'd be especially bad if high VIX tends to correspond with a RISC of +50 fairly often, because that would mean that realized is higher than implied, and this would be the exact thing we're talking about—where VIX as a hedge against realized vol is failing.
That barrenness in the more recent data suggests that when VIX is high (when hedgers need their VIX products to be working for them), VIX tends not to be doing a good job of tracking S&P realized.
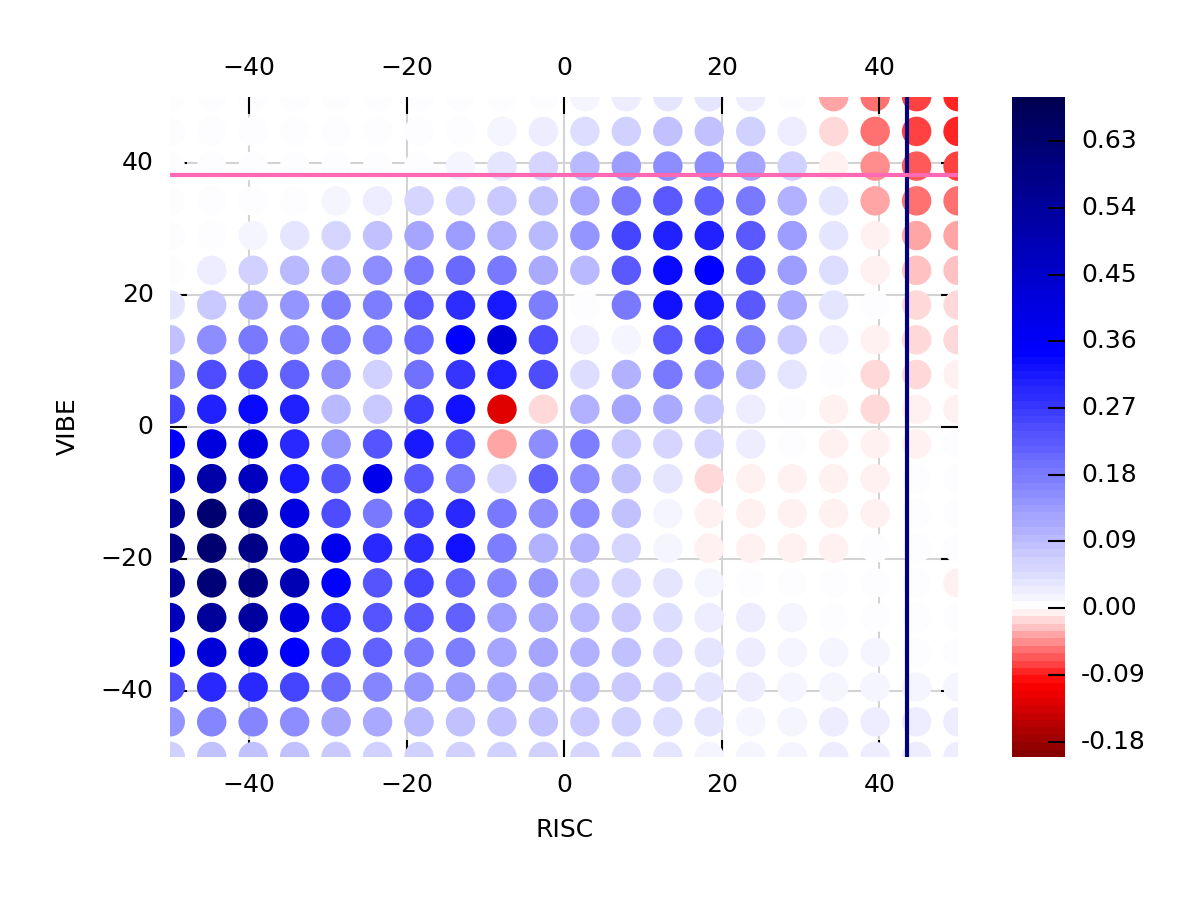
This is what's happening right now. Today. And it's no mystery that high RISC (RV much higher than IV) is itself a bearish signal—that's the whole point. Look at our dot-plot of RISC and VIBE.
When RISC is high (like >40, which is when realized daily SPX vol is 0.40% or higher than the implied daily move), there are no instances of truly great 1-month returns for SPX. It's all neutral to bearish. It's all reddish. And the reason why it's reddish is probably because of what we described above: If investors are relying on SPX vega (VIX, SPX IV) to hedge their portfolios in some way or another (futures, options), this degree and direction of tracking error are problematic, and encourage deleveraging. The hedge isn't working! Not as advertised, anyway.
RISC is over 40 right now, so this is our exact situation, right now.
Ok, so since that data seems to have confirmed our biases, let's allow ourselves to extrapolate.
Cboe has been trying to defend itself against accusations that VIX doesn't work correctly anymore. The folk wisdom is that all the attention is on 0DTE and 1DTE options now, and that nobody's using 30-day options anymore, which are what comprise VIX. This seems partly true, and one of Cboe's responses was introducing a 1-day VIX calculation, which was completely ridiculous, and kinda validated the criticism at the same time ("It's still relevant, we swear!").
Now (in one month) Cboe is trying to reintroduce "variance futures" for the third time in its history. These would give the aforementioned equity hedgers (who want to use VIX futures and options) the opportunity to more closely match the realized volatility of the S&P 500, since the contract value of a variance future would converge on the actual value of the historical 30-day variance. The problem with this is that "variance" is the square of "volatility," so the whole thing where VIX is linear to volatility (which is what a hedger wants) goes out the window. But... if VIX is doing such a bad job of tracking recent realized vol when it really counts, maybe variance is a better bet. It would certainly be more reliable in one sense.
All of this is to say: There's some interesting behavioral stuff to look out for. Equity hedgers are getting a raw deal from VIX lately, and one immediate impact of that appears to be deleveraging in moments when realized is higher than implied (high RISC). Validating the idea that they are, indeed, getting a raw deal, is the fact that Cboe has expunged certain marketing copy from VIX products, floundered with some 1DTE VIX computation, and are re-introducing variance futures.
What does this mean for the future of hedging equity portfolios? It's a big business, it's a huge and dynamic problem, and it's quite possibly the most important thing to understand in order to pick short-term direction in the S&P 500. We don't know The Answer, but we know we need to keep watching this.
Is this an opportunity for short VIX futures (nice, steep contango) with short E-minis (to benefit from potential vol-related deleveraging)? Or maybe—like we were saying before—a relatively cheap strangle really gets us the best of both worlds. We still like that idea. Long gamma.
Enough crank opinions. It's just something to keep in mind, and something that we will inevitably come back to.
Enjoy the week!
The SqueezeMetrics Team