All the charts and data we refer to can be found on the Yacht Club page.
Hey everyone,
Last weekend, we implored the reader to be vigilant for evidence that "disintermediation" is occurring. I.e., that customers are taking opposite positions to each other in the market. This was little more than a hunch, but it seemed worth mentioning because if we're right, the consequences are significant.
Ironically, markets don't work properly when people are actually trading with each other.
This weekend, all we want to do is review the data from the week, and see if any of our fears have been legitimized. Is this actually happening? Is "liquidity uncertainty" increasing? When? How?
This seems like a good opportunity for the ex tempore "listicle" format. So let's just go for it.
1. Price-action
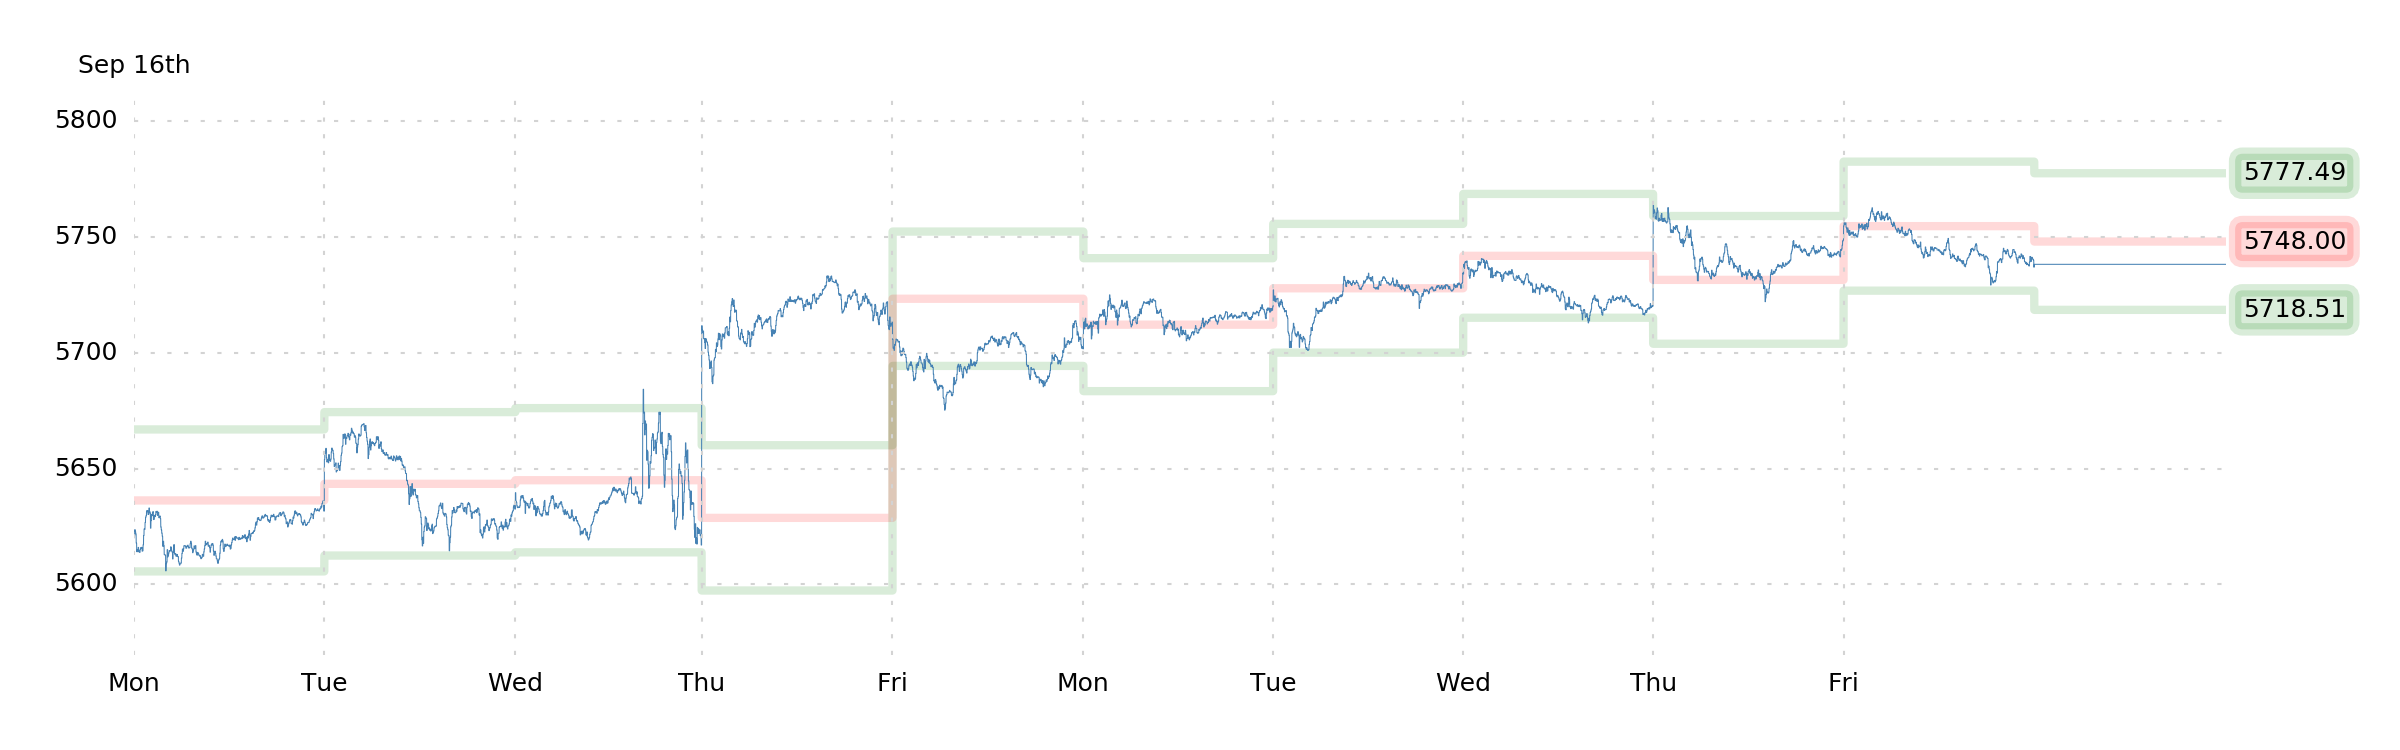
The S&P 500 was flat to up. Last week at this time, Robot Jim's forecast leaned bullish, and it became even more bullish-stable on Monday. Jim saw little room for downside.
Under the surface, outsized performance by sector seemed to boil down to "semiconductors and China." The latter because of domestic stimulus and the former because of some hopeful earnings reports. It was nothing remarkable, really, unless you were long some calls on Chinese companies' ADRs.
One thing that we did note is that the composition of 0DTE dealer positioning was highly variable and choppy. This was one thing that made us think that the market is at odds with itself. On a day-to-day basis, there weren't strong patterns, and what patterns were there were really "spiky," suggesting, e.g., that for every customer who was net long 5750 calls, another was net short 5760 calls.
Thursday, notably, gave us an opportunity to take advantage of some weird, spiky positioning.
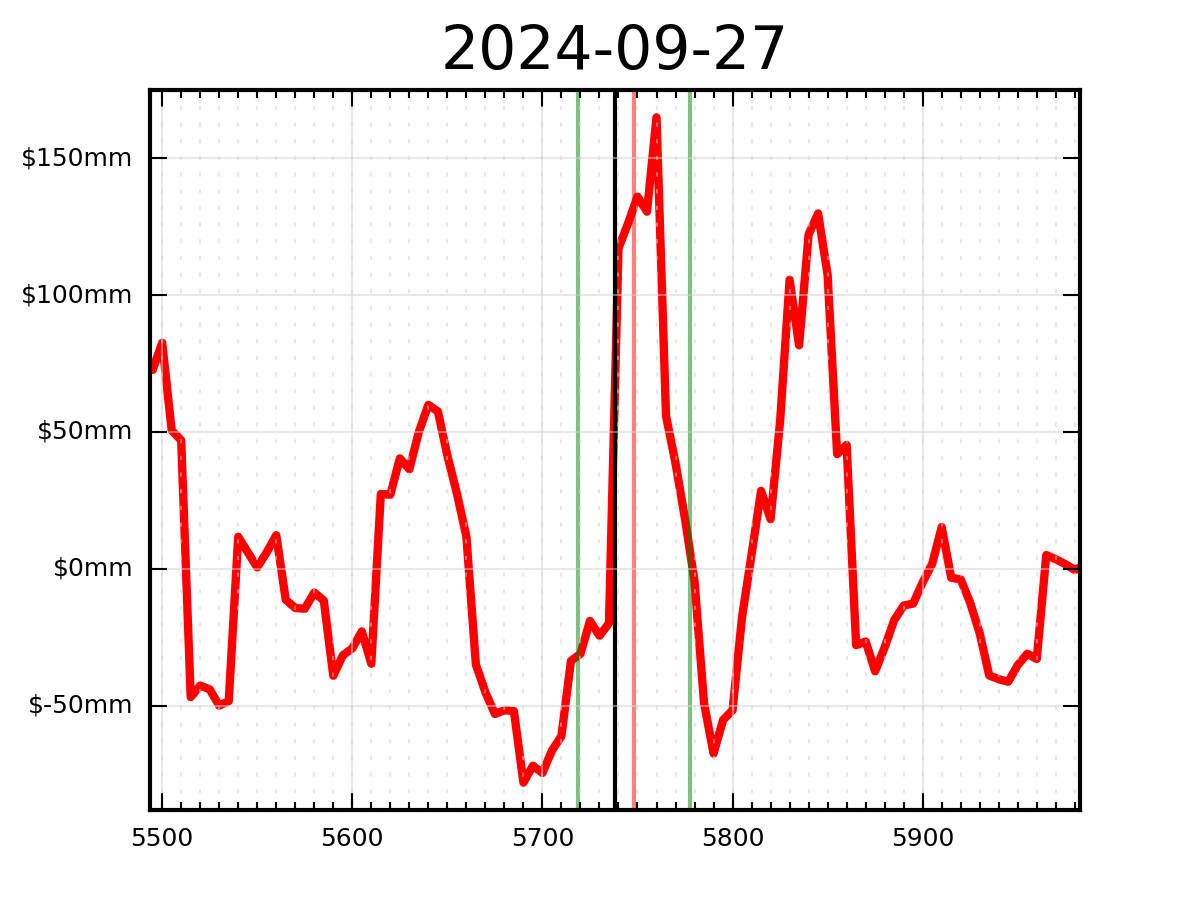
Monday's 0DTE setup looks like it will be fun, too (it's end-of-month). A rally to 5760 almost seems likely, but after that, it's an uphill battle, and you'd expect it to come back down.
Frankly, none of this is too notable, and we can't extrapolate much from it. One thing that we did find interesting, though, was a similar phenomenon in NPD.
2. Net Put Delta (NPD)
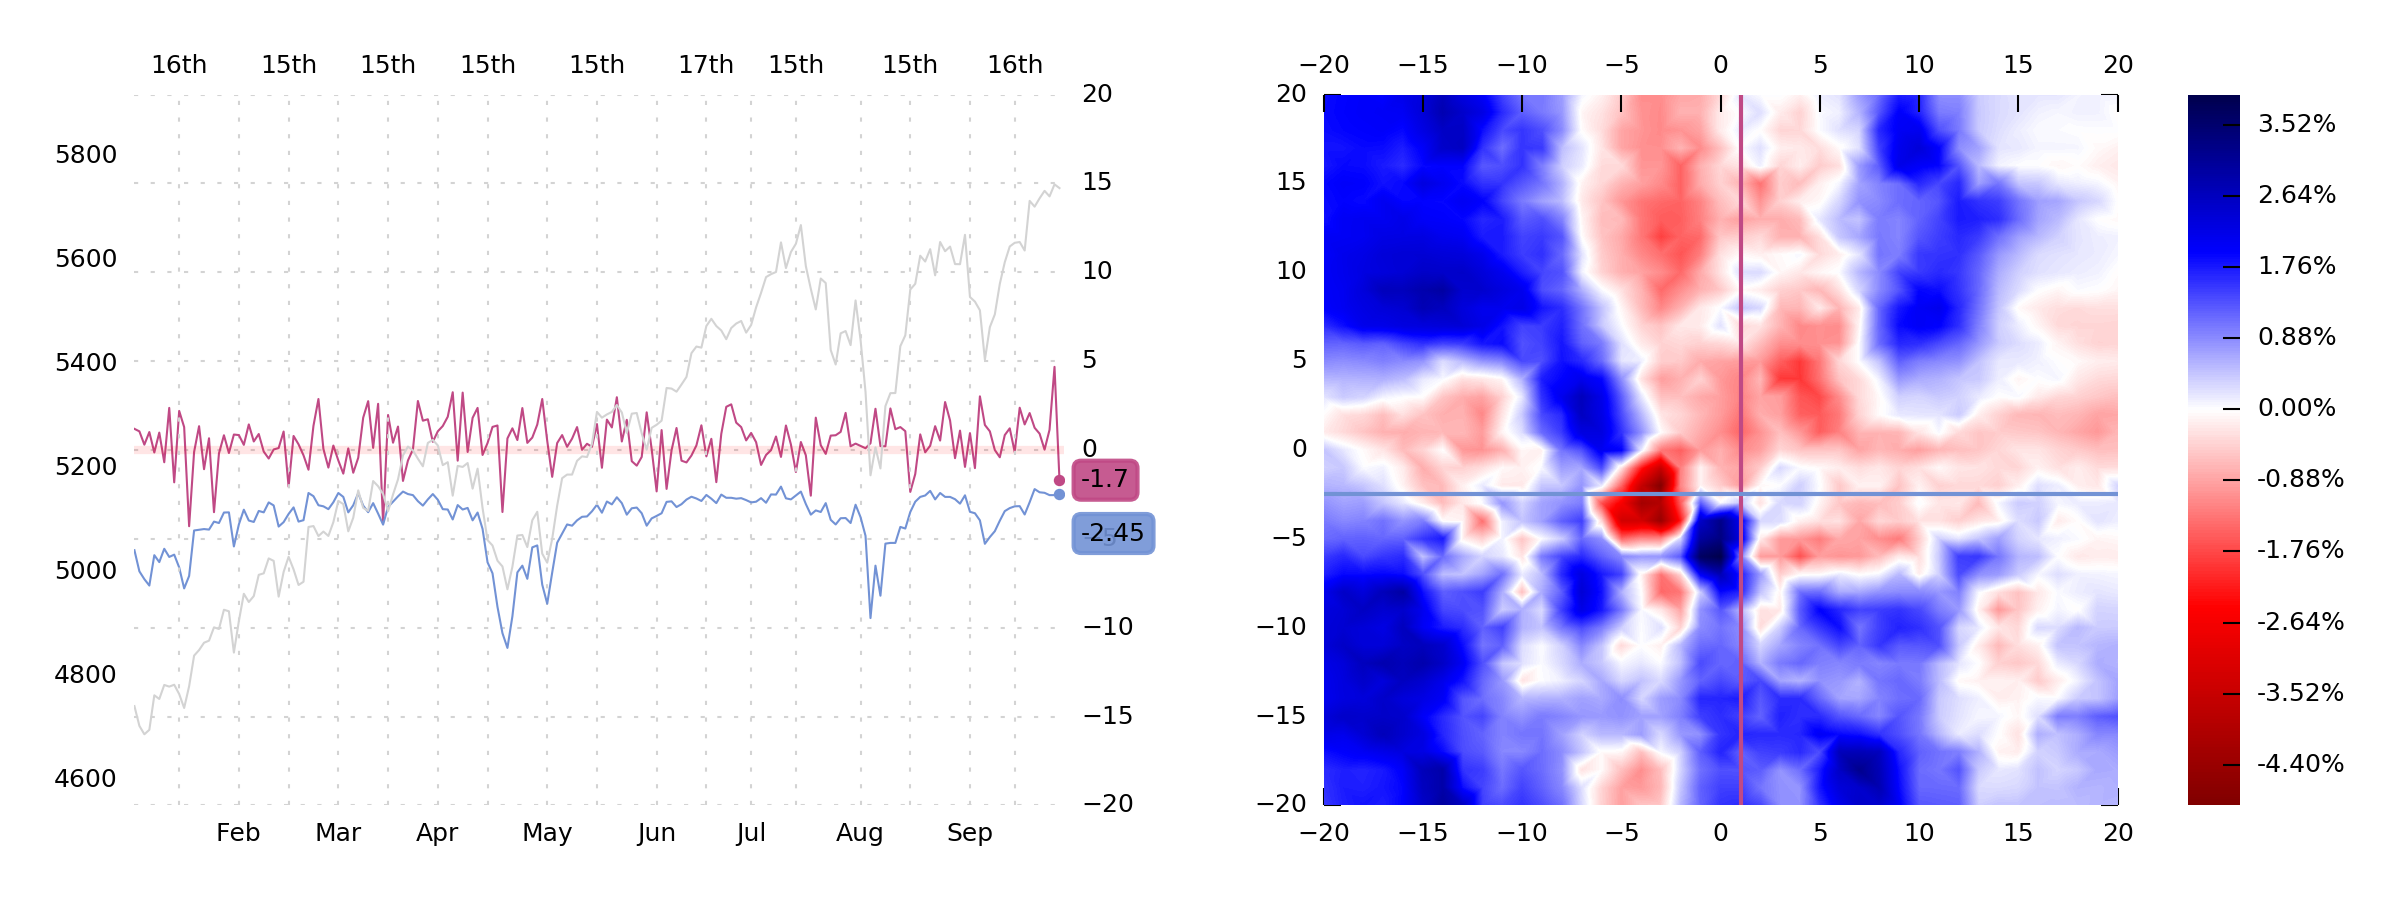
Look at the wine line: On Thursday, there was more net put-selling than you've seen in a long time; on Friday, more put-buying than you've seen in a while. There was also some lively activity in longer-term options (longer than than 0–5DTE), which was interesting.
The fact that all of the net deltas seem to cancel out, day-to-day, makes it all the more interesting from our point of view, since that "swapping deltas" is exactly the sort of thing we're watching for. It suggests that customers are deliberately taking opposite positions. This adds some tension and instability. We're inclined to believe that this could indeed be an indication of what we were looking for.
As concerns immediate effects, though, we still see none.
3. RISC/VIBE
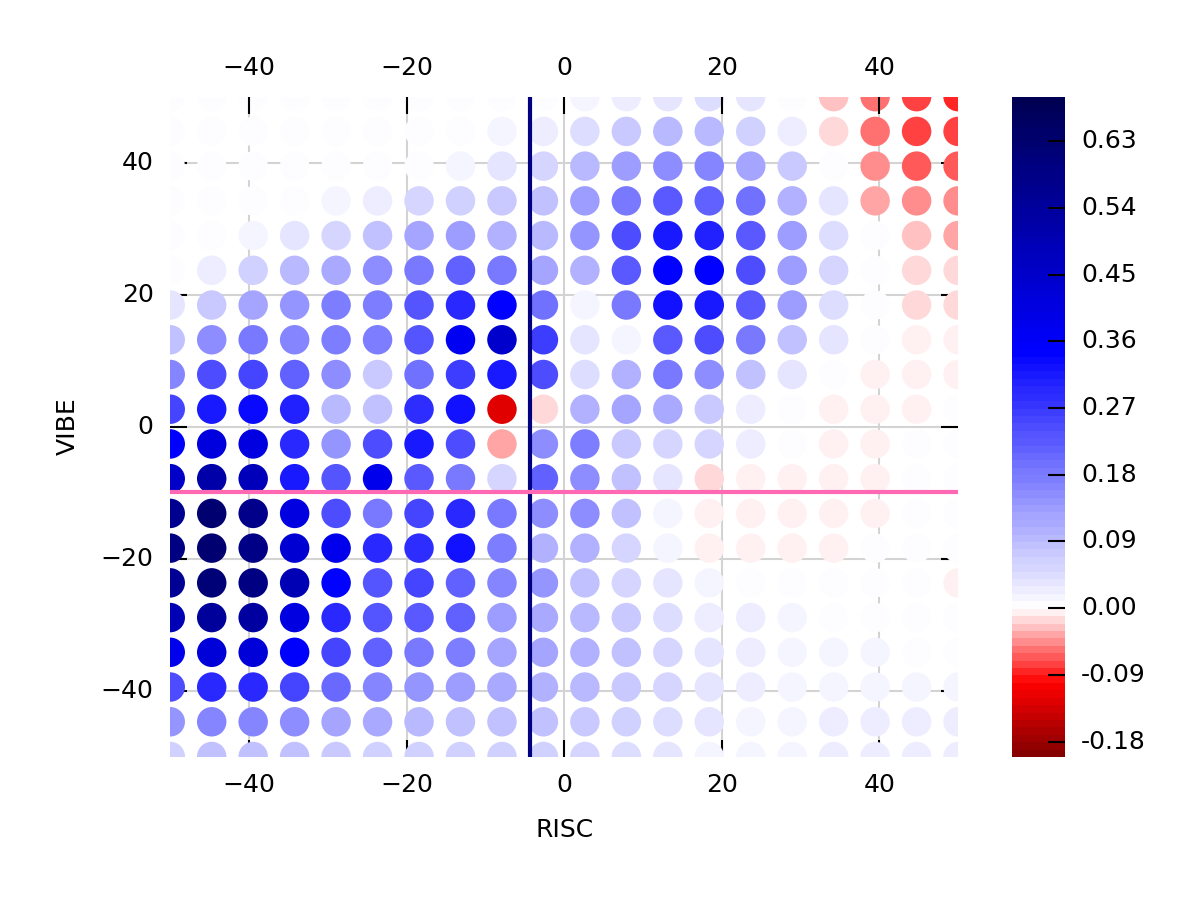
Last weekend, we talked about the "red blotches" that show up on so many of our heatmaps, each of which seems to get at some truth about the circumstances of "disintermediation." One of them was the RISC/VIBE heatmap.
It's worth noting that we've been inching closer to the RISC/VIBE "red blotch."
If VIBE moves closer to zero (i.e., if implied volatilities start wiggling a little bit less, relative to expectations), the crosshairs move into that magical red area of underperformance and volatility. Are we there yet? No.
Next?
4. DIX
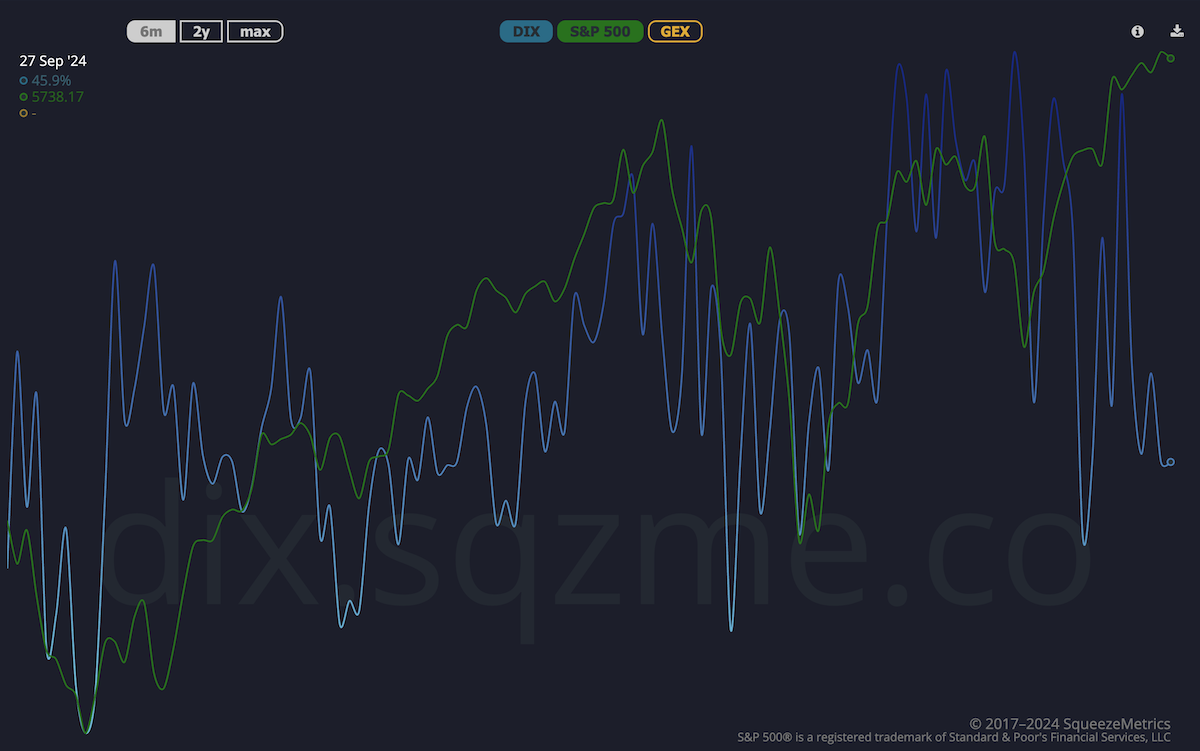
We actually spent a moment last weekend talking about how DIX is itself an indicator of disintermediation when it falls rapidly. When we were saying that, it was 52.7%. A week later, it's printing 45.9%.
Like the opposing positioning in 0DTEs, and like Thursday's price-action, and like RISC/VIBE moving toward (0,0), and like NPD acting funky and volatile—this is the sort of thing we were expecting to see this week. And at this point, enough things seem to be gently lining up with our expectations for "the beginning of disintermediation" that we think we're barking up the right tree.
What's next, though? Like, assuming we're correct, and that "disintermediation" is occurring, and people are trading with each other and taking opposite positions, what's the upshot? What's the trade?
As is often the case, we think the answer comes from somewhere familiar.
5. Jim
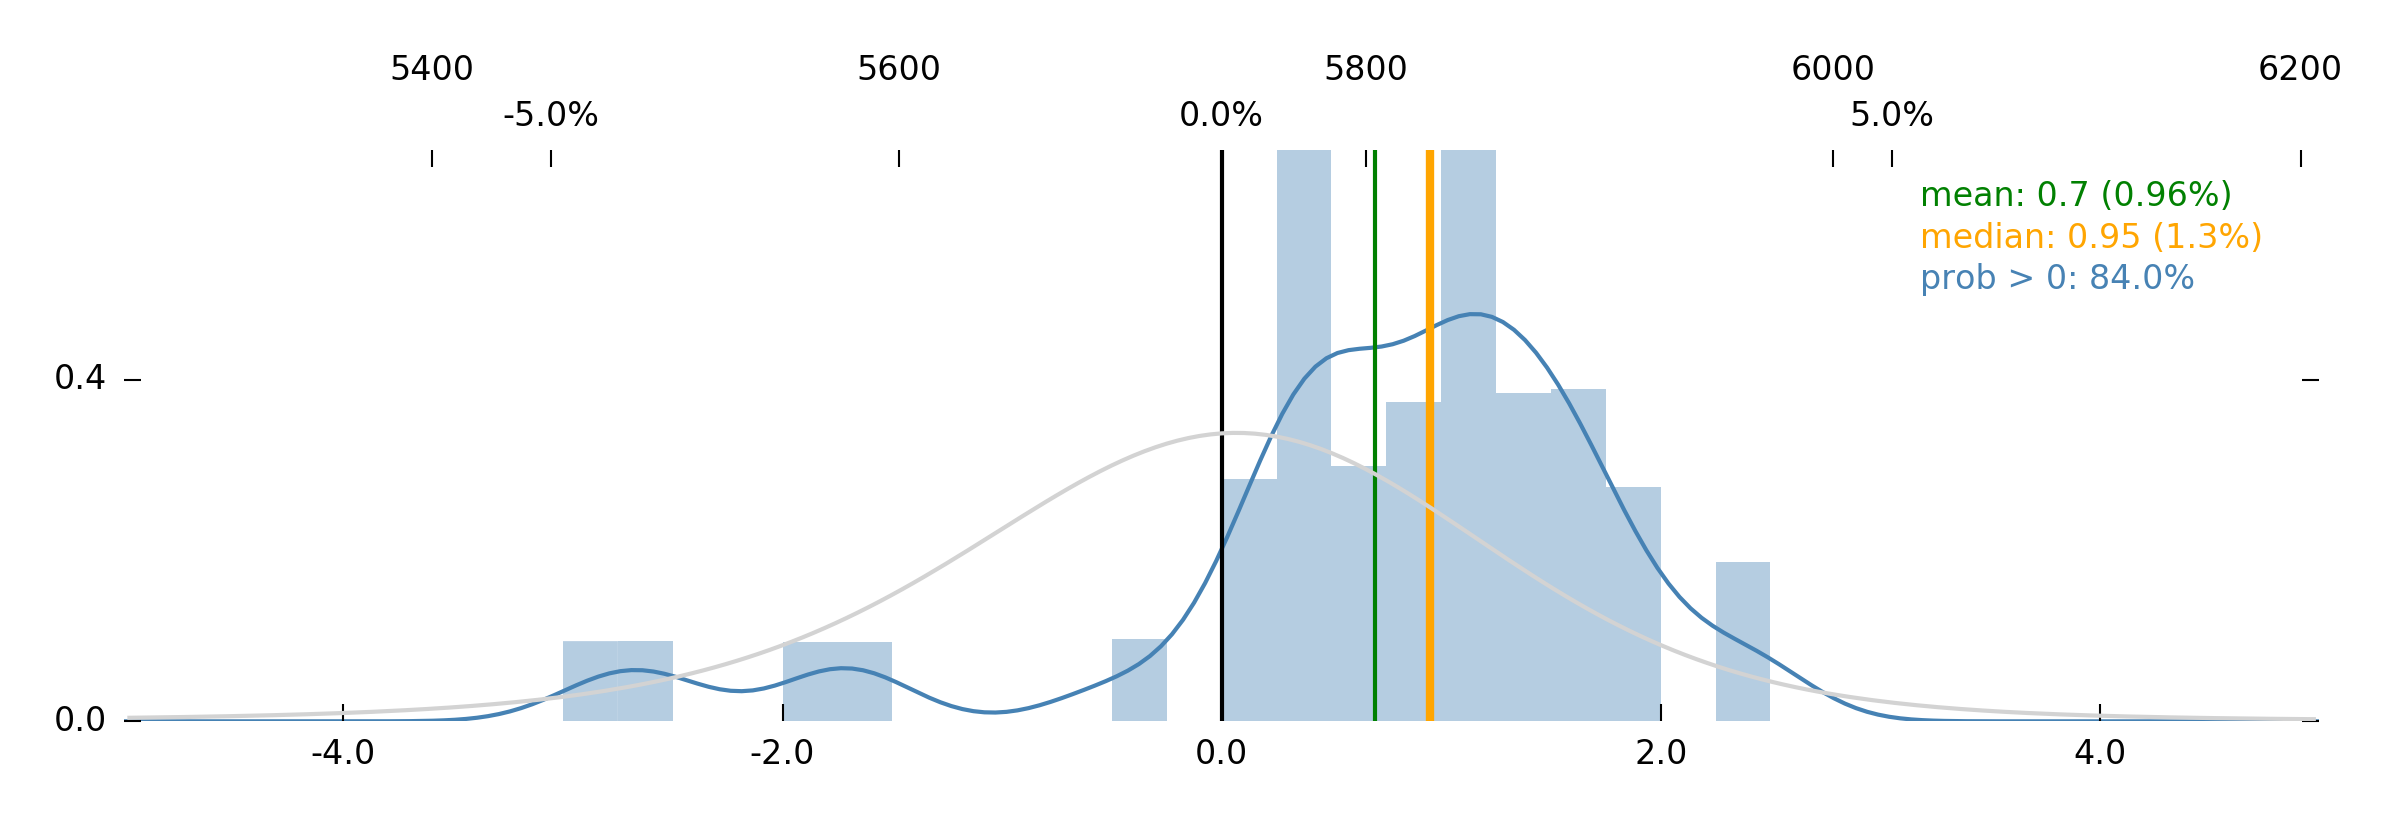
The forecast for the coming week is very, very bullish. Jim says that there is an 84% chance of upside.
And while we believe that Jim is "correct," in that he's associating the current combination of data with several months' worth of historical data that ended up being really bullish, we're always suspicious of the über-bullish forecasts, because they are the most likely to be "discovered" by the market. I.e., if the current data has, indeed, been associated with strong returns in the past, then there is a much higher likelihood that other enterprising quantitative folks have found it, and see the same association, and have already traded or will trade based on it (negating the impact). So we have a hard time just going along with the really, really bullish stuff.
What we really want to take away from the forecast is something slightly different than just "it's bullish." Rather, we're more interested in the conditional stuff, which we can see in the step-forward analysis.
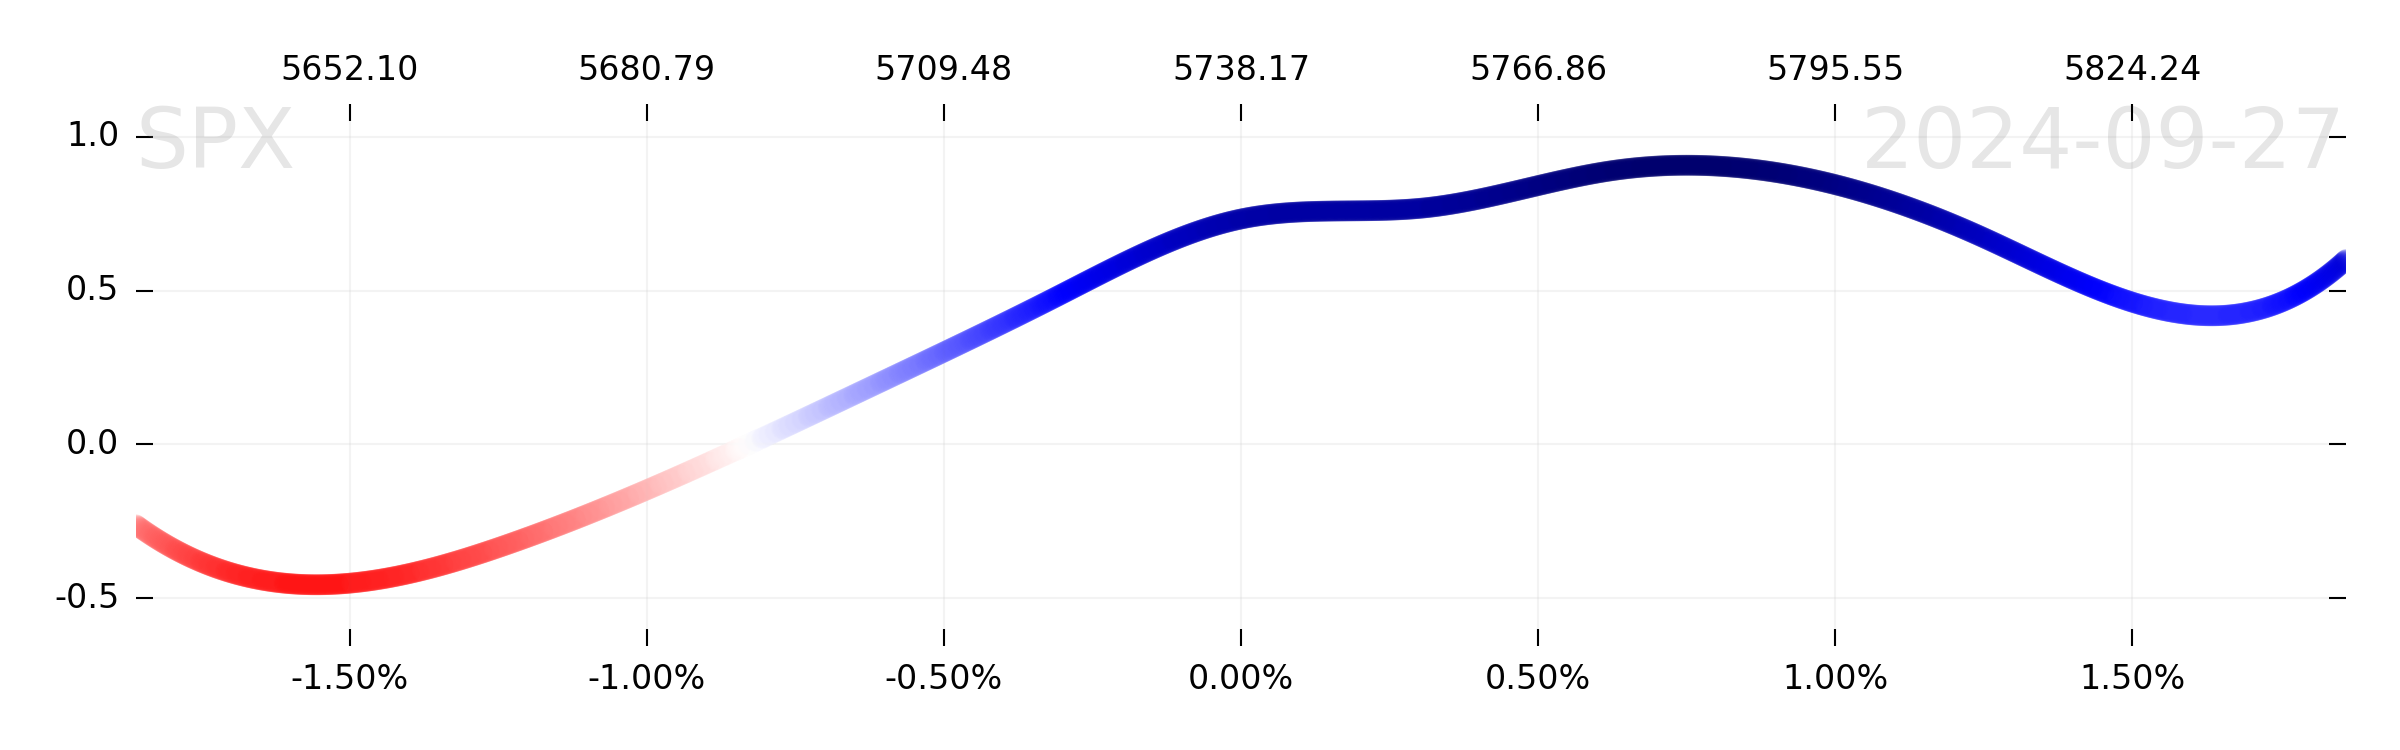
Here we see exactly what we were hoping to see: Uncertainty. Extreme variability.
Note that if SPX stays flat or goes up, the forecast remains excellent. But if SPX falls 1.50%, it's not just "neutral," but quite bearish (a –0.5 MAD mean forecast). This extreme variability in Jim's forecast is, we think, symptomatic of everything we've been talking about. If price goes down enough, dealers won't be there behaving in their orderly fashion and supplying liquidity. Rather, the emphasis will be on customers mashing buttons, sending marketable orders, and yelling about Trump, Kamala, artificial intelligences, oil, gold, inflation, recession, Israel, Iran, and all the other things that so tidily divide traders and investors into opposing camps at the moment.
6. Trade?
How do we get cheap exposure to the possibility that it gets wiggly and discontinuous? That "liquidity uncertainty" takes over?
Probably a wide strangle. Despite a low probability of profit, a wide (150 to 200 points wide?) strangle gives you explosive convexity in the event that we move hard in one direction or another—which seems an underpriced possibility right now. And although we haven't bought a strangle in a really long time, we're always comfortable with the idea, because it's a simple structure with a firm max-loss. And as we've demonstrated with [hateful] mathematics, loss-limited convexity is how you make the big bucks—if you can maintain your sanity in the meantime.
Speaking of which....
7. Other items
We haven't talked about bonds in a couple weeks. We left off feeling vaguely bearish (because everyone wanted to have a toe in the water for the beginning of the rate cuts by buying calls and stuff like that, and then those calls decay and pull price down, etc.), but there wasn't much more to say.
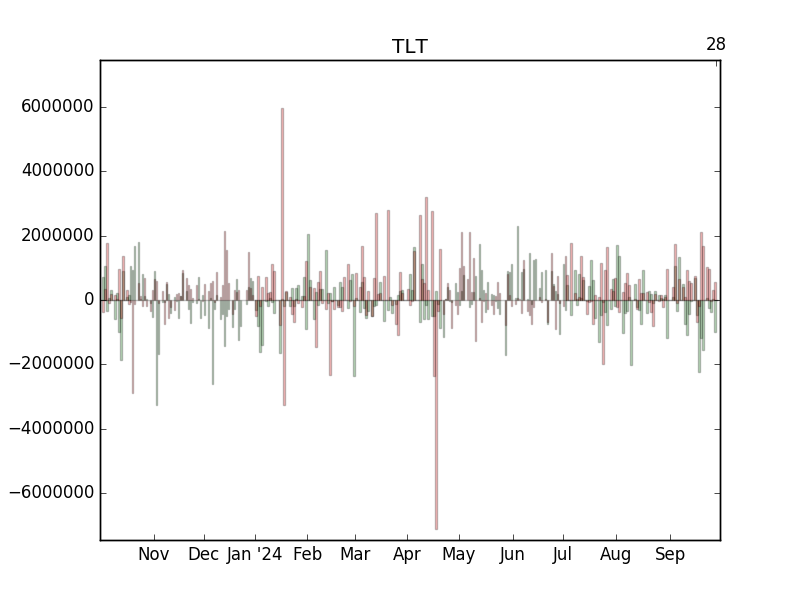
One interesting thing has happened since then, and that's that there's been an accumulation of customer short convexity in TLT options. Look at this.
See how the most recent data is mostly positive red bars (sold puts) and negative green bars (sold calls)? Customers are now betting that nothing happens, instead of betting on TLT upside. This is fun, because it probably makes it more likely that something happens, and as a result, we'd expect that bond volatility is underpriced right now. The "correct" way to trade this is probably a simple long bond option, delta-hedged. Try to capture a couple outsized moves, either up or down.
Since this is a pretty easy thing to get exposure to, we'll probably get long some bond vol. Besides, we're quite tickled by this idea. It's not something we'd usually do.
Speaking of fun, it's
always a good time to consult the Research page and cross-check some ideas with the K-scope. For instance, the top pick on the "Up" tab right now is HNI Corp. (
HNI). When we click through, it looks pretty good, and when we learn about what HNI does (office furnishing), we think it's super cute and thematic. A bet on the counterrevolution against work-from-home. The "Back-to-pants Movement?"
Anyway, the point is: Have some fun while you wait. And we'll be buying some options this week. Enjoy!
The SqueezeMetrics Team