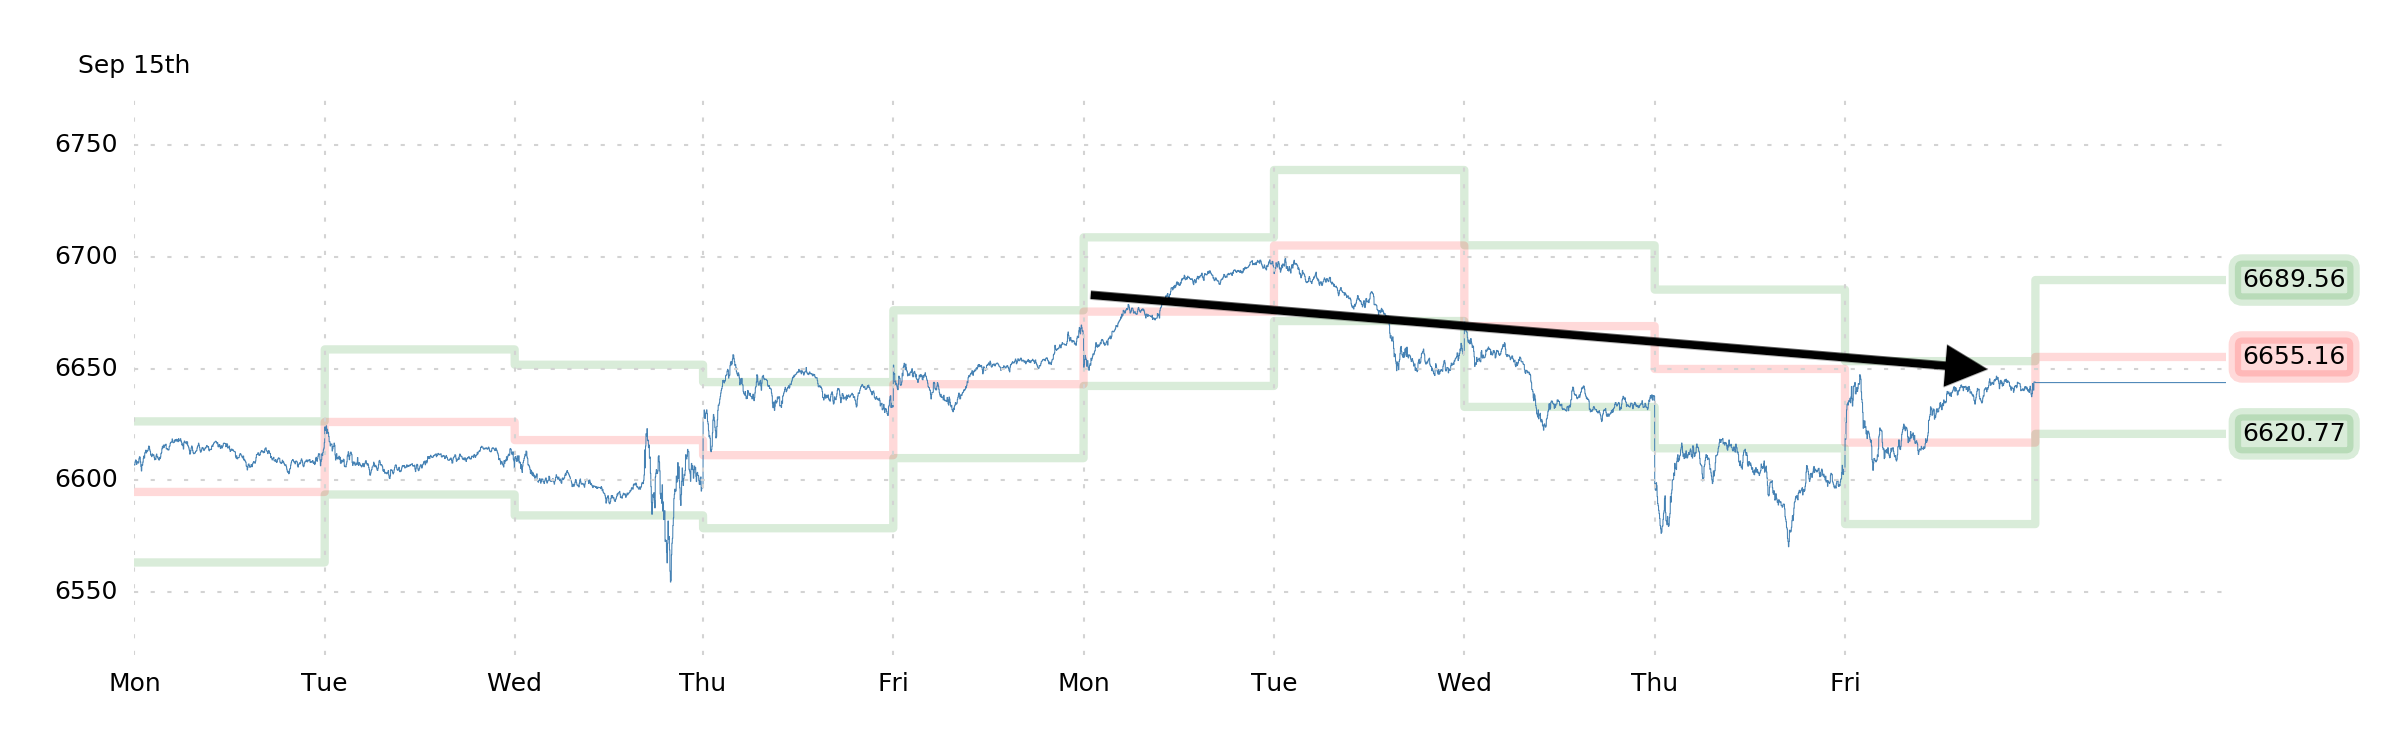
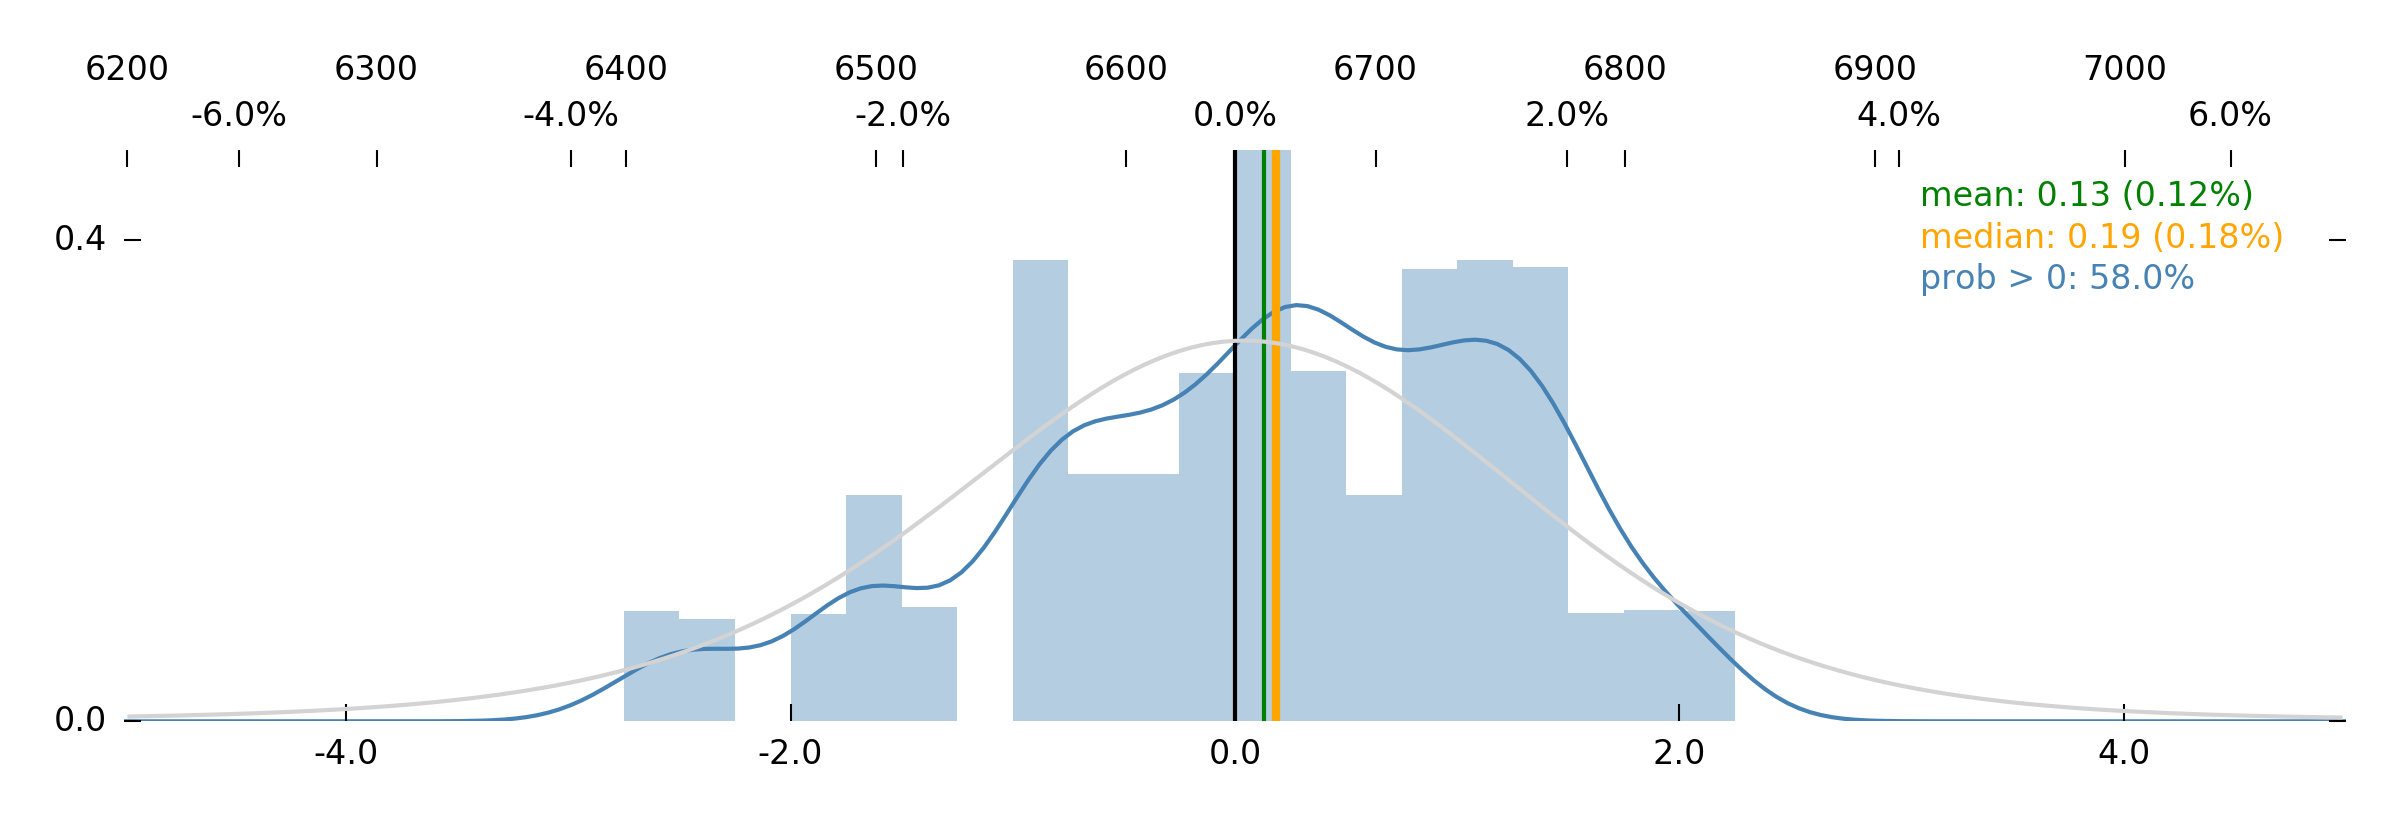
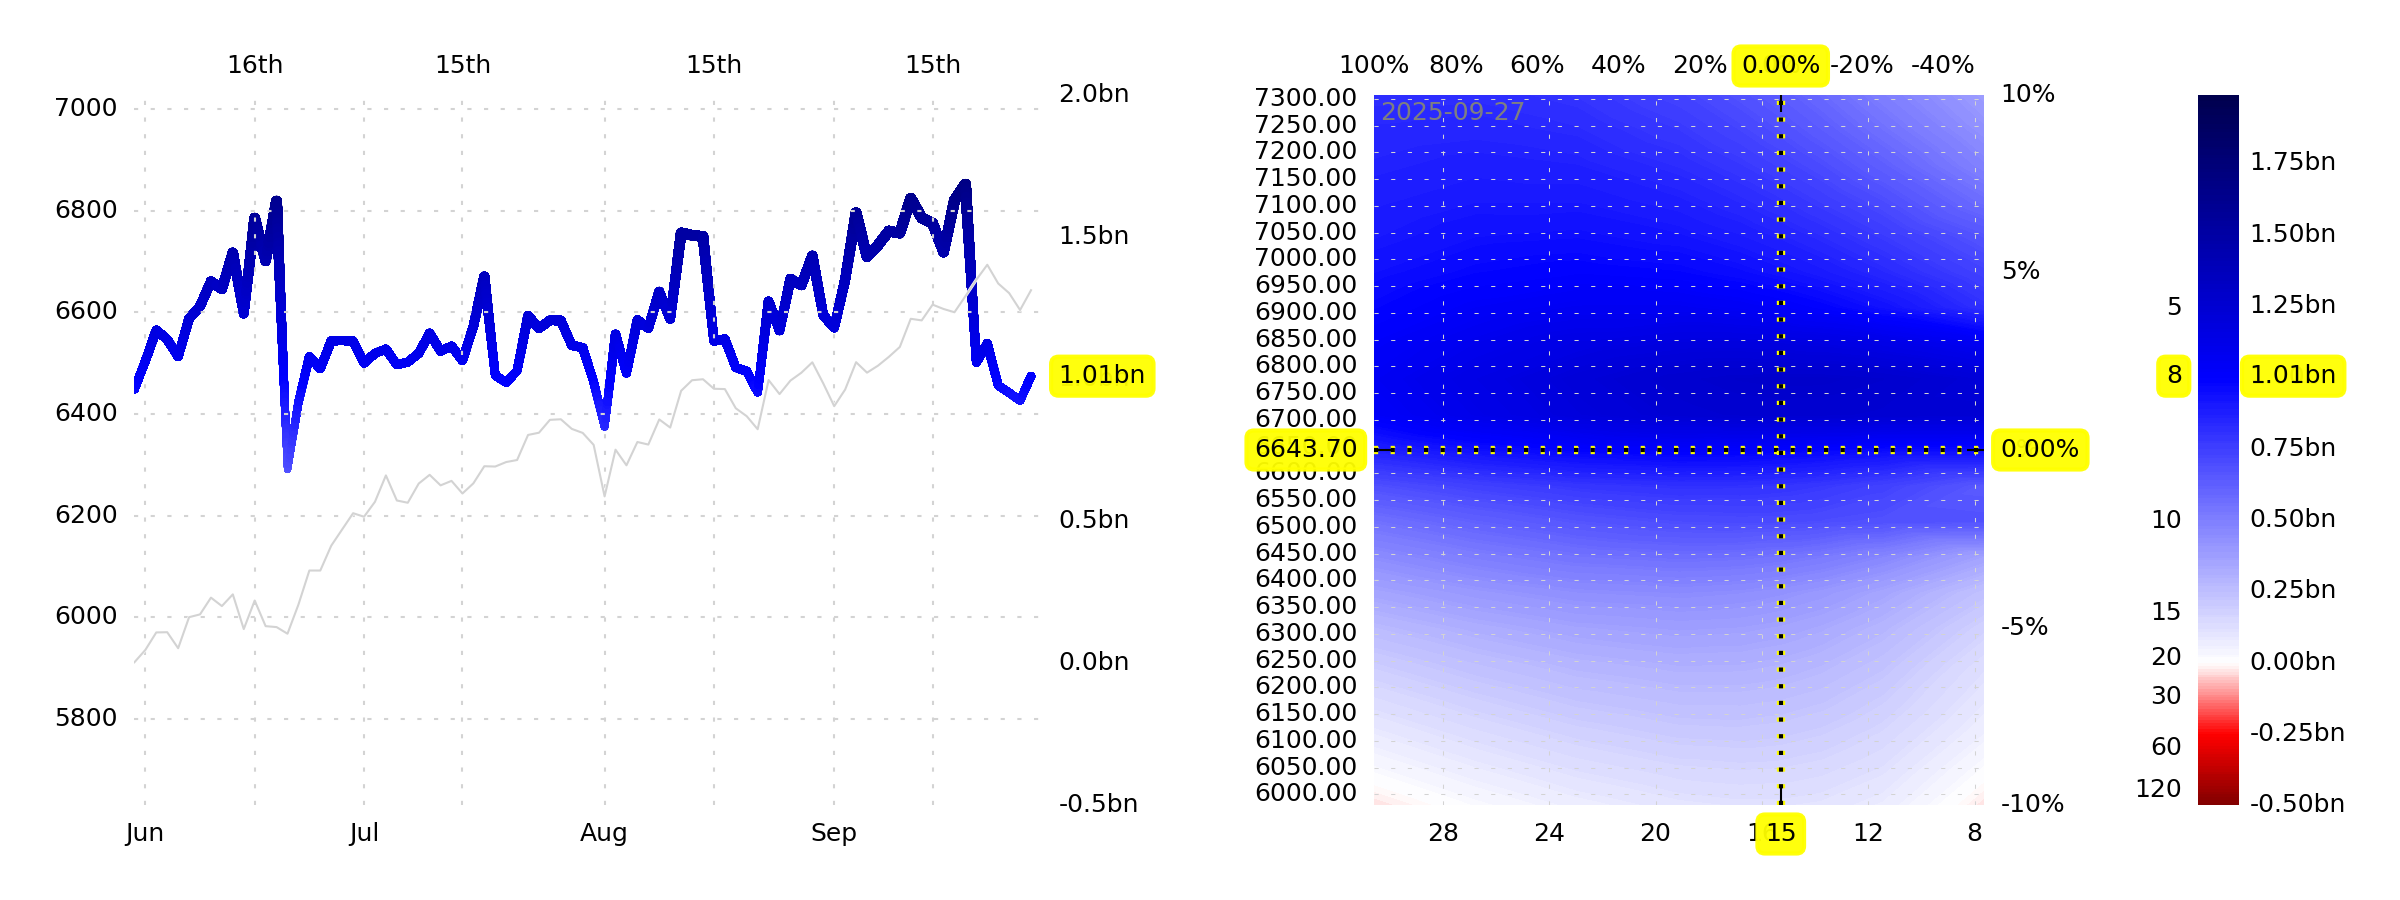
All the charts and data we refer to can be found on the Yacht Club page.
Hey everyone,
We aspire to brevity this weekend.
For real, though.
Like, we're gonna do it. No need to be wordy.
Because there's just no reason to draw this out, but rather, we ought to communicate things in as clear and concise a fashion as possible. And the goal in doing this is... ok, right.
Sorry.
First, let's talk about the past week. Then let's talk about a forecast. Then let's talk about some tickers we've been following and trading. Then, lastly, let's talk about the correlation stuff we're working on. All in the spirit of brevity.
Past
The
plan, this past week, was for some "calm, measured downside."
Does this mean that volatility increases in this coming week? Yes, probably. But it's also probably not going to be super-dramatic. $1bn in buying per SPX point down is still a fair bit of liquidity.
Anyway, this feeds into our idea that what we should be seeing is some fairly calm, measured downside in SPX. But then that's what we were saying last weekend, too, and last week wasn't exactly what we were hoping for.
And we sorta got that (–0.31%).
Tactically, our approach was to weave our gentle-downside assumption into our intraday E-mini trades. Practically, this meant that we were short from the open on Tuesday, Wednesday, and Friday. Ultimately, this worked out pretty well (Friday a bit weak, small loss, bit disappointing).
Cool.
Forecast
Not much has changed.
And that means it's kind of hard to get excited about anything.
Our overriding assumption is still that we're in the early stages of shrinking the AI segment of the stock index pie. And, like last weekend, we think that's likely to tug down on the S&P. But at the same time, there's liquidity.
Note that we're not currently in the midst of the band of high GEX+ (as we were last weekend), but rather below it. So volatility actually rises on the way down, and even though dips will still get bought (like last week), it's conceivable that there will be incrementally weaker dip-buying from here.
Caveat: $1bn in GEX+ is still $1bn, and Robot Jim's expectation that SPX probabilities are underpriced at ~6750 (+100pts) pretty much tracks with a calm upside move expectation into the highest-liquidity region. What this means is that you have to believe in the AI-unbubbling thesis in order to think that there's downside from here. Otherwise, a better default position is a conservative call spread.
From our perspective, the right thing to do is to keep pressing our preferring names (yay tools, boo commodity white collar, yay robots-that-turn-"tooling"-into-"labor"), and to not take a strong stand on the index.
Tickers
Speaking of which, here's a litany of the tickers we've been talking about lately (in the last three weeks) and how they've been performing over the past week (in parentheses).
CRWV — CoreWeave, some sort of weak-moated "cloud AI" purveyor (–3.6%). We have puts. Still not quite working out yet.
NVDA — The big kahuna, symbol and vanguard of the "AI trade," flat to down since we've been yelling about it, but still a bid (+0.9%).
INFY — InfoSys, cheap white-collar services, bouncing off 5-year lows (–2.7%).
CTSH — Like INFY, but slightly stronger, not quite at 5y lows (0.0%).
TER — Teradyne. Robots. A pretty successful trade (+12.9%).
SWK — Stanley. Tools. 'Merica. Trade's fine, but not a great week (–3.7%).
SNA — Snap-on. More tools. Nice. Pushing 6-month highs (+1.4%).
RKT — RocketMortgage, the mortgage refi trade, +80% YTD. We're no longer buying this, or any other "mortgage refi" trades, now that the first rate cut has occurred and it doesn't seem like there's a lot more juice (–4.88%).
And then there were the three long trades from last weekend that the nearest-neighbor algorithm recommended on the Ideas page and that we highlighted. Friday-to-Friday 1-week return is in parentheses.
SPGI — S&P Global. We liked this last week, and we still like it, and so does the algorithm. Down a gnarly 4% since buy-in (–3.9%)! Yuck.
FAST — Fastenal, another tool stock. Looked pretty. Up 3.2% since Monday morning buy-in. Yum (+2.4%).
CRWD — Crowdstrike, software security. Pure momentum. Trade is down 1.8% from Monday morning. Oof (–4.2%).
Not our best selection—but we were trying to be long into a week that we thought the index would go down. Do we get points for that?
A word on S&P Global (
SPGI): We had an argument that SPGI should be insulated from the fallout of financial market data becoming more commoditized due to AI tools, since it's not just a data platform for public markets. We still believe this. The market
disagrees. We don't want to fight
too hard, but... we're gonna buy some more (we will loudly complain or gloat about this, depending on the outcome).
Now let's talk about a tool that, hopefully, will save us from making bad decisions and catching falling knives in the future.
Correlations
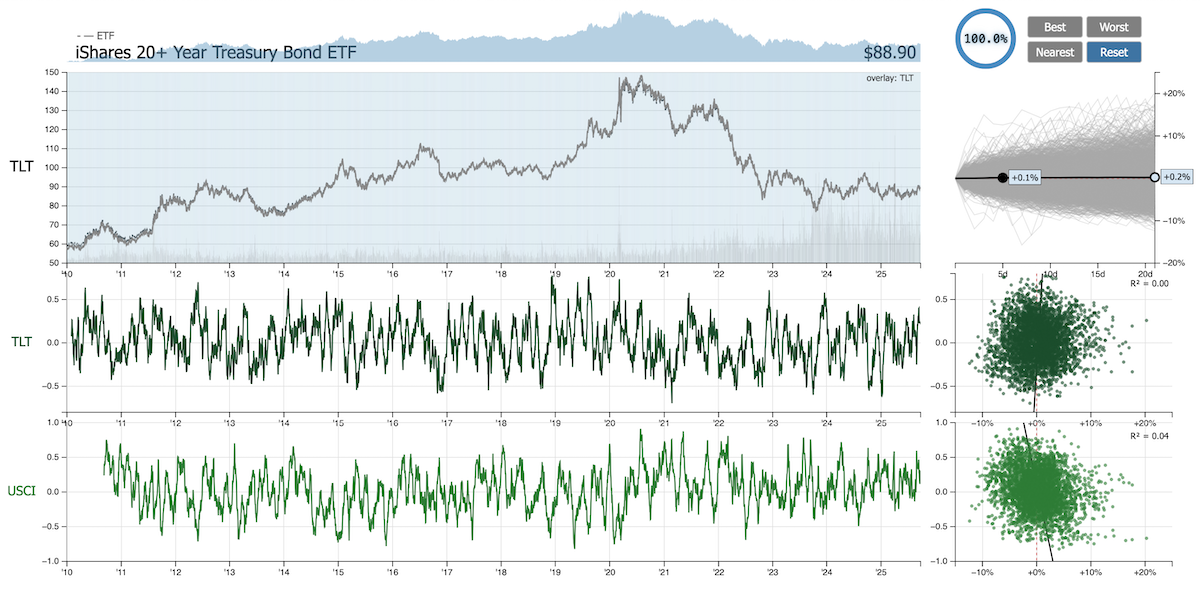
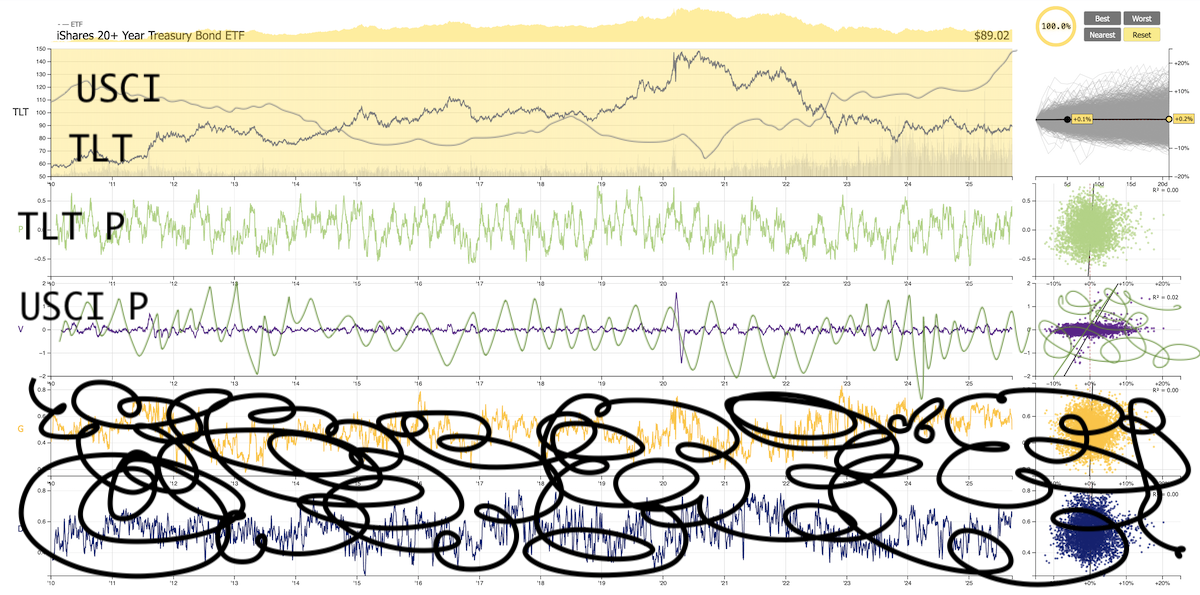
We don't know what to call it yet, but it lives where the old k-scope lived (click on the tab at the top of the page)—and it looks like this:
We were trying to make it look like our sketch from last weekend, and actually, we think we did pretty good!
On top, you have an interactive chart with a context plot above it, both interactive. Then, in the slots below, you have (instead of P, V, G, and D) the price-trend indicators from whatever tickers you want. Click and add them yourself.
Note, in the screenshot, that we're displaying one of the many cutesy relationships that we found over the past few months (TLT <- USCI).
Try looking at some others that we mentioned, like CENT <- EPC, or XLU <- NLR (which is timely). Unfortunately, we're not at all done with the "user experience" for this tool, so we can't give you links to these—but it'd be nice if we could. Gotta work on that.
Gotta work on a lot of things.
But in the meantime, please try playing with this new k-scope-for-correlations. Tell us what it needs. Also, tell us what to name it (P-plot? P-scope? CorrChart?).
And in the meantime, enjoy what remains of the American Republic, and what remains of the warm season. Both can be enjoyed to the fullest from the veranda, in quiet meditation, with a drink in hand.
Enjoy the week!
The SqueezeMetrics Team