All the charts and data we refer to can be found on the Yacht Club page.
Hey everyone,
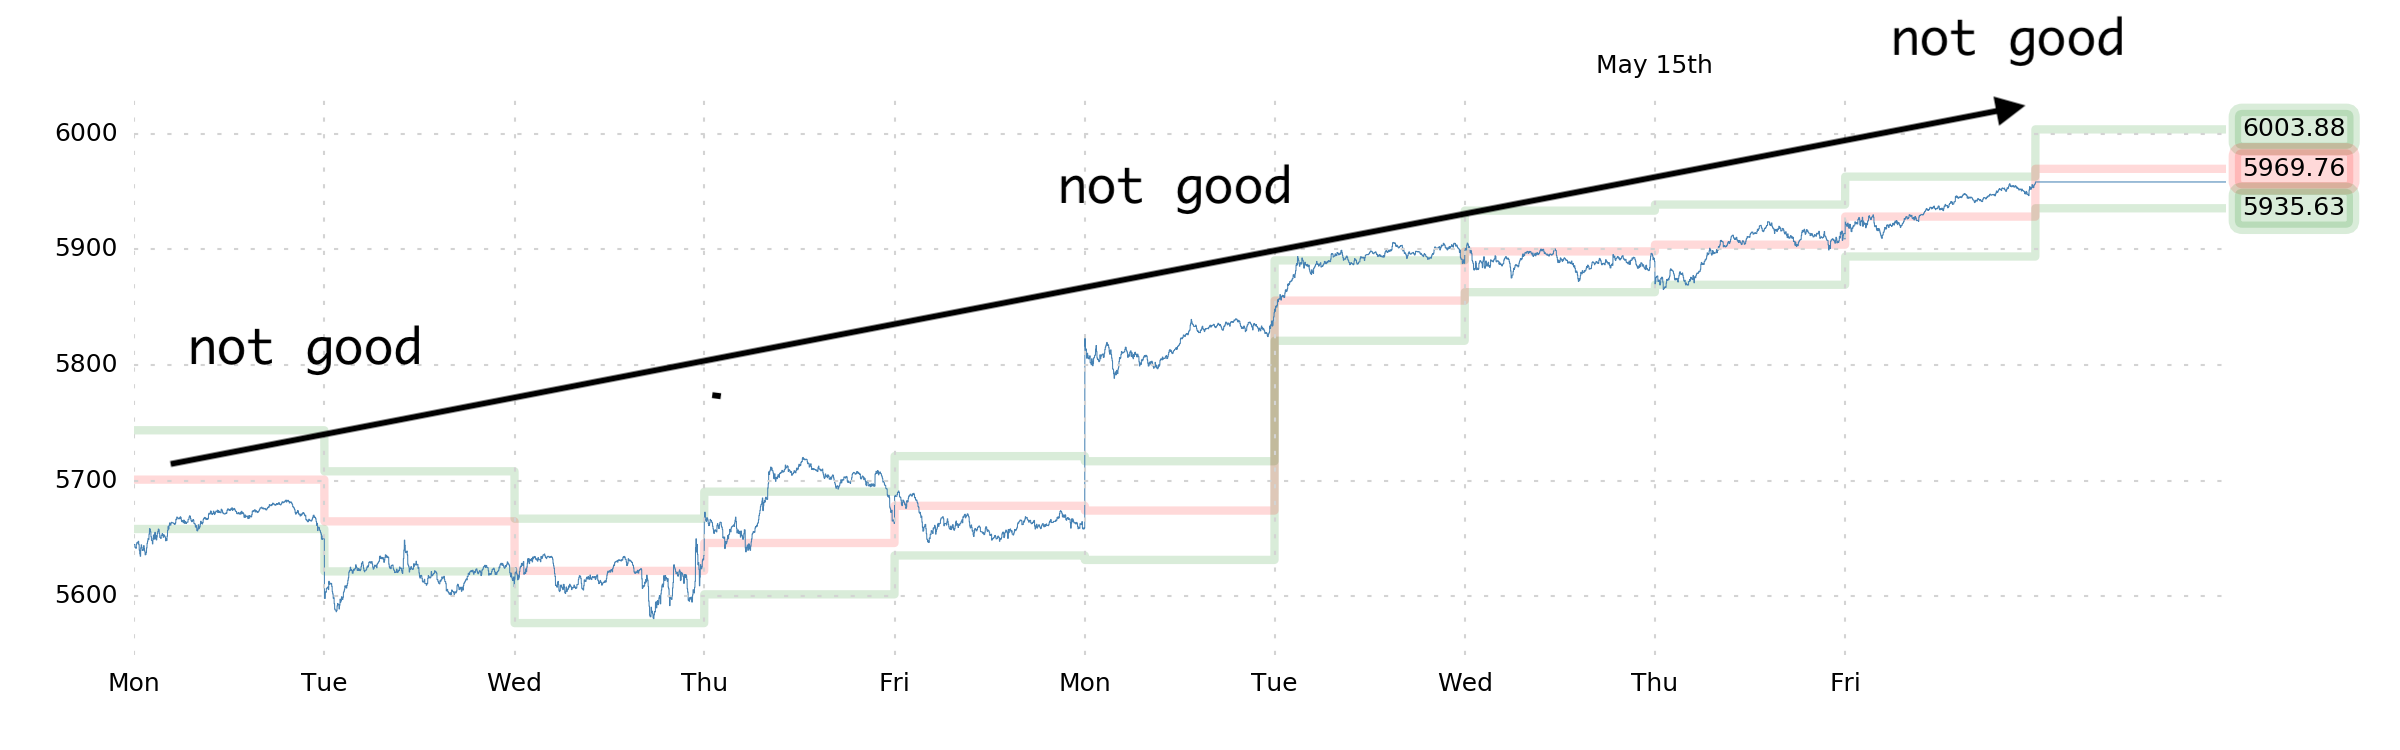
For two weeks now, we've been leaning long S&P 500 volatility and short delta by way of SPX puts and/or VIX futures. Let's check in with the chart to see how that's been going.
Hmm.
Not good.
Our puts are worth zero. Our VIX futures are flat. Granted, this is not the worst thing that could happen (thank goodness for fixed-risk bets), but as we frequently despair about—it always feels bad to be wrong. Even if you expect to be wrong more than half the time it feels bad to be wrong. And right now, we've been wrong.
Sorry about that.
But maybe we shouldn't be sorry, because being wrong is the fundamental necessity behind seeking out logarithmic bankroll growth. You have to be willing to be wrong a lot.
Speaking of being wrong, last Sunday we said we'd "discuss something slightly more edifying next weekend," because we're tired of talking about The Donald and "games" and "fear" and all that n-dimensional chess stuff—but this was a lie. We are going to talk about garbage again.
Sorry about that.
But maybe we shouldn't be sorry, because it's really hard to suss out information and forecasts from historical data when the most fundamental data relationship in the market—that which arises between price and volatility—is absolutely singular right now. It's off on its own. It's in uncharted waters.
Seriously.
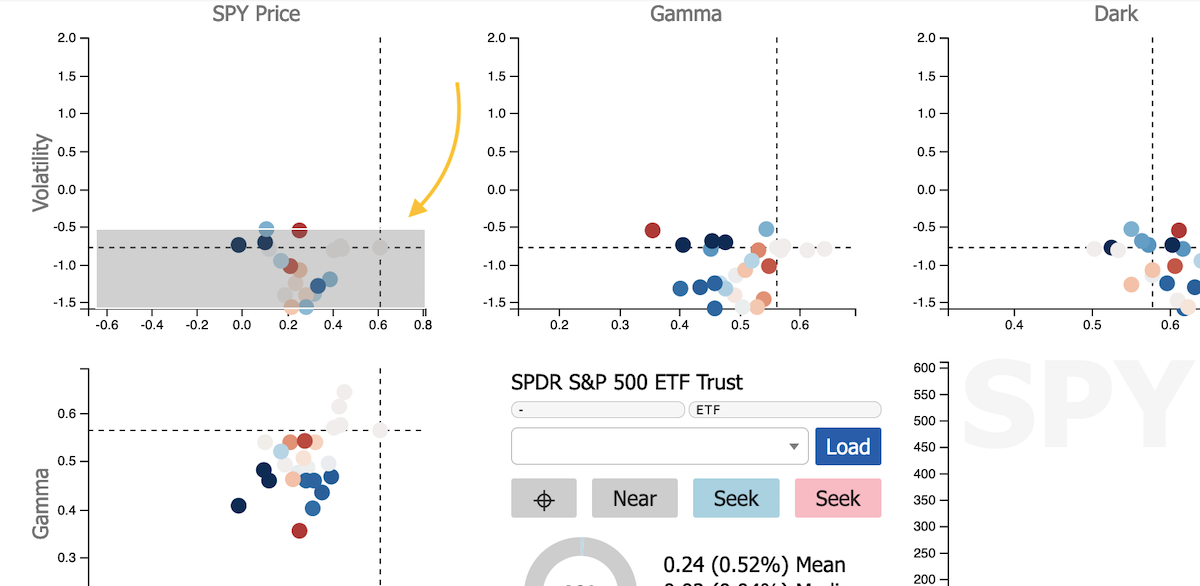
On the Price-to-Volatility dot-plot of the SPY Kaleidoscope, we are currently experiencing something for which there is no remotely close historical analog. The Price indicator is at +0.80, which means that the average day in the last month has realized 80% of its expected move to the upside (only about 4% of historical data has ever been higher).
That's interesting in its own right—but then there's the Volatility indicator at –0.75, which means that 1-month realized average daily moves have fallen by 0.75% (less than 1% of historical data has ever been lower).
This collapse in average daily moves is only comparable to the weeks after the COVID crash, which, you may recall, was a real crash, with circuit breakers and 80+ VIX and everything. The fact that the vol-normalized Price appreciation in the past month simultaneously far outstrips the immediate post-COVID-crash period suggests that you have just witnessed perhaps the most impressive 1-month performance period in the recent history of the S&P 500.
Why does this matter?
Well, for the last couple months now, we've been coming back to realized volatility (and its relationship to other things) as one of the most important factors to explain what's going on.
- In late March, there had been a lot of realized vol, but not enough of a response in implied vol to "cover" it, which made us think that portfolio managers were hurting (vega hedges weren't working) and would need to degross. They did!
- In mid-April, realized vol was objectively high, and we thought that an "ugly rally" could commence (especially since put-sellers had showed up), drawing vol-sensitive portfolios back into the market at higher prices. It did!
These extremes have now given rise to another extreme here, in mid-May, where volatility (realized and implied) has been pummeled. In a month, VIX has fallen from 35 to 17. (And VIX was in the 50s just before that.) Average daily ranges in this past week were under 0.50%—but we were doing 2.5%, 6%, and even 9.5% per day very recently. Wow.
This sequence of events, and their magnitude, are insane. The "vol of vol" is breathtaking.
Where does it leave us?
Well, right now, we believe that there are two or three fundamental "fears" gripping market participants.
- Fear of volatility, visible in steady re-grossing into lower index volatility.
- Fear of losing, visible in a surprising amount of put-selling in SPX (see NPD).
- Fear of missing out, visible in retail trader buying stats and high DIX.
And if you believe that there are marginal short-sellers out there (we don't get the sense there are many, but the ones who are active are indeed in some pain here, and are aggressors on the offer), you can add them to the FOMO list, as their impulse is much the same—a pit-in-the-stomach fear of missing a move higher.
How do we resolve all of these fears?
We wish the answer were an explosion in volatility, of course, and hundreds of points in SPX losses—but it doesn't really look that way.
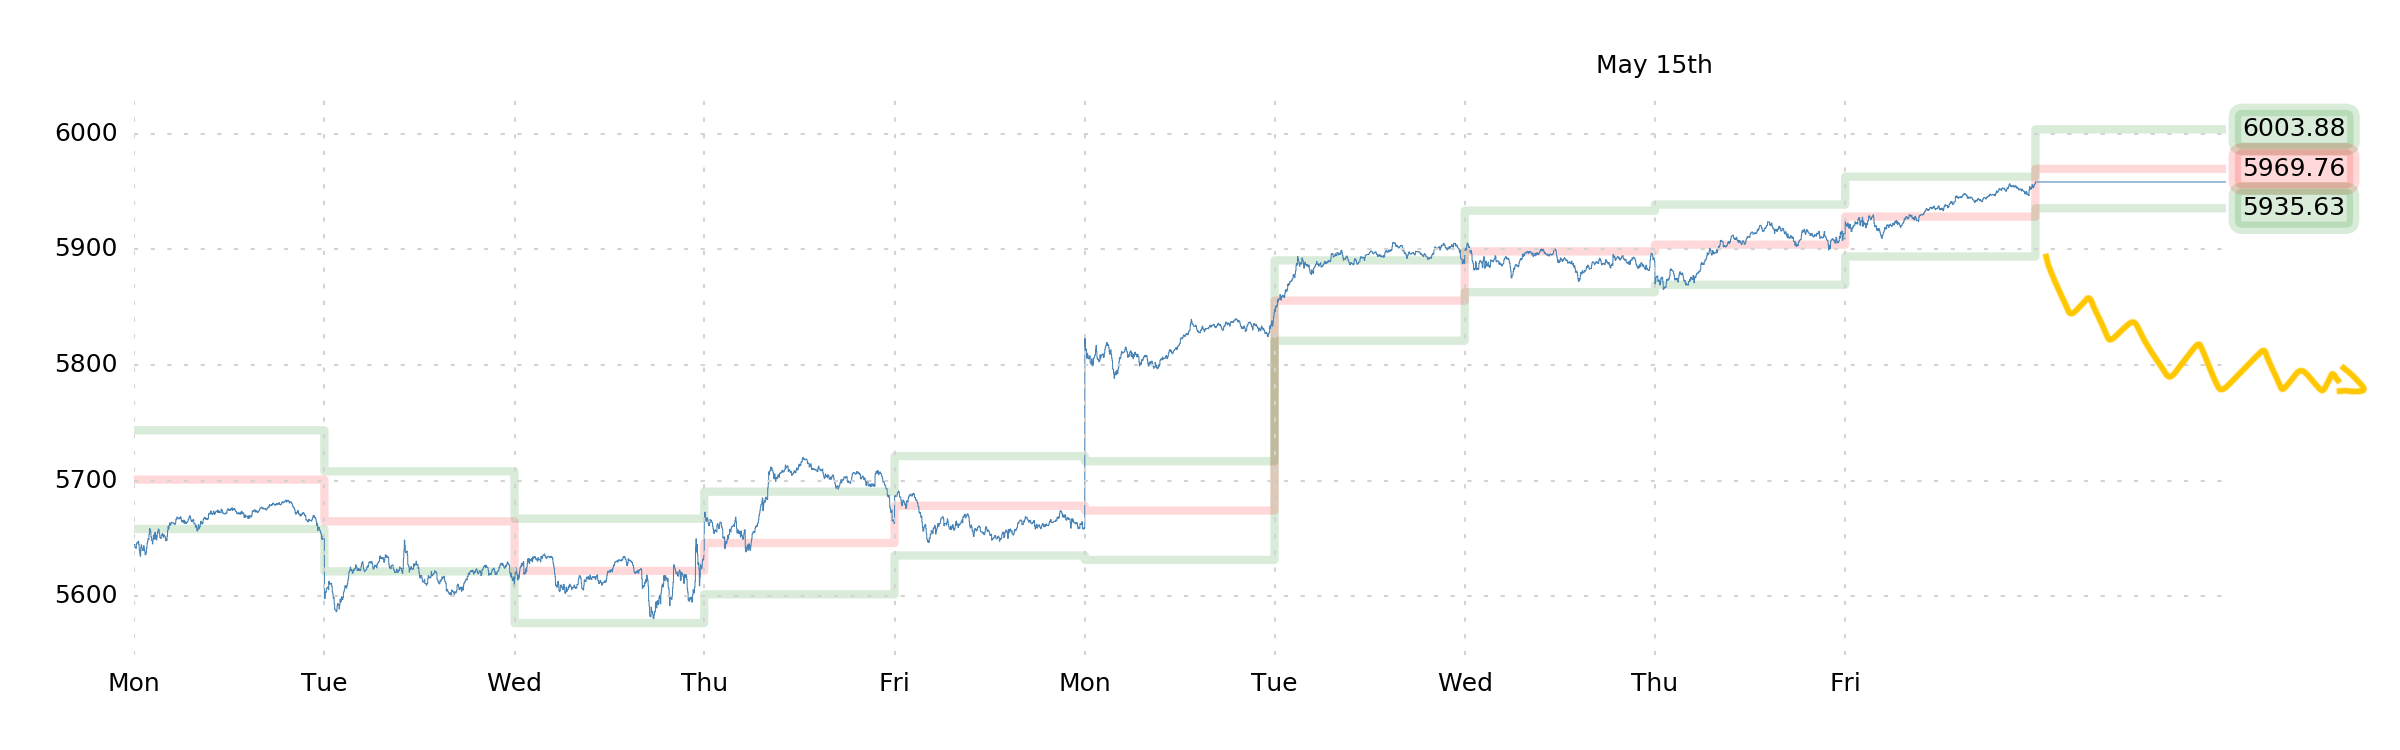
If the S&P 500 trends down gently, or "retraces" this past week of action...
- The realized-vol-sensitive traders can keep gently re-grossing in SPX, and won't experience the volatility they're afraid of.
- The put-sellers can still win, or at least not lose too badly.
- The FOMO traders can feel at ease.
So if we were to "thread the needle" on all of the stock market's apparent fears right now, it might look something like this:
A noncommittal move back down to, e.g., 5800. Frustrating, right?
Could circumstances change this path? Of course! And we've been arguing that at this juncture, The Donald has demonstrated a loss of control of the "game" that he's been playing with the market. Indeed, at the current juncture, we're told to believe that Walmart is supposed to "eat" the tariffs, the Chinese are supposed to "eat" the tariffs, American children are supposed to have two dolls instead of thirty (i.e., eat the tariffs), we're unilaterally instating more tariffs on the whole world very shortly, everyone is itching to sign deals with America, and, uh, everyone should buy stocks because they're going up... et cetera. It's muddy. We've lost the plot. It's all quite incoherent now.
(This is kind of a shame, actually, because it was kind of fun watching Trump shrug off that 20% loss in SPX while playing golf... he was doing so well! Dominating the scene. It was impressive.)
And as long as we become squelched deeper into this quicksand of incoherence, it's increasingly difficult to believe that the completely unresolved issue of Trump's tariffs is worth 0.50% average daily moves and hovering a few points from SPX all-time-highs. Indeed, the situation right now looks worse than it did a little over a month ago, because at least then it was coherent (if economically problematic).
Which is to say—you would be forgiven for owning puts right now, with the belief that maybe, just maybe, we'll have a moment of collective clarity and fall below SPX 5800.
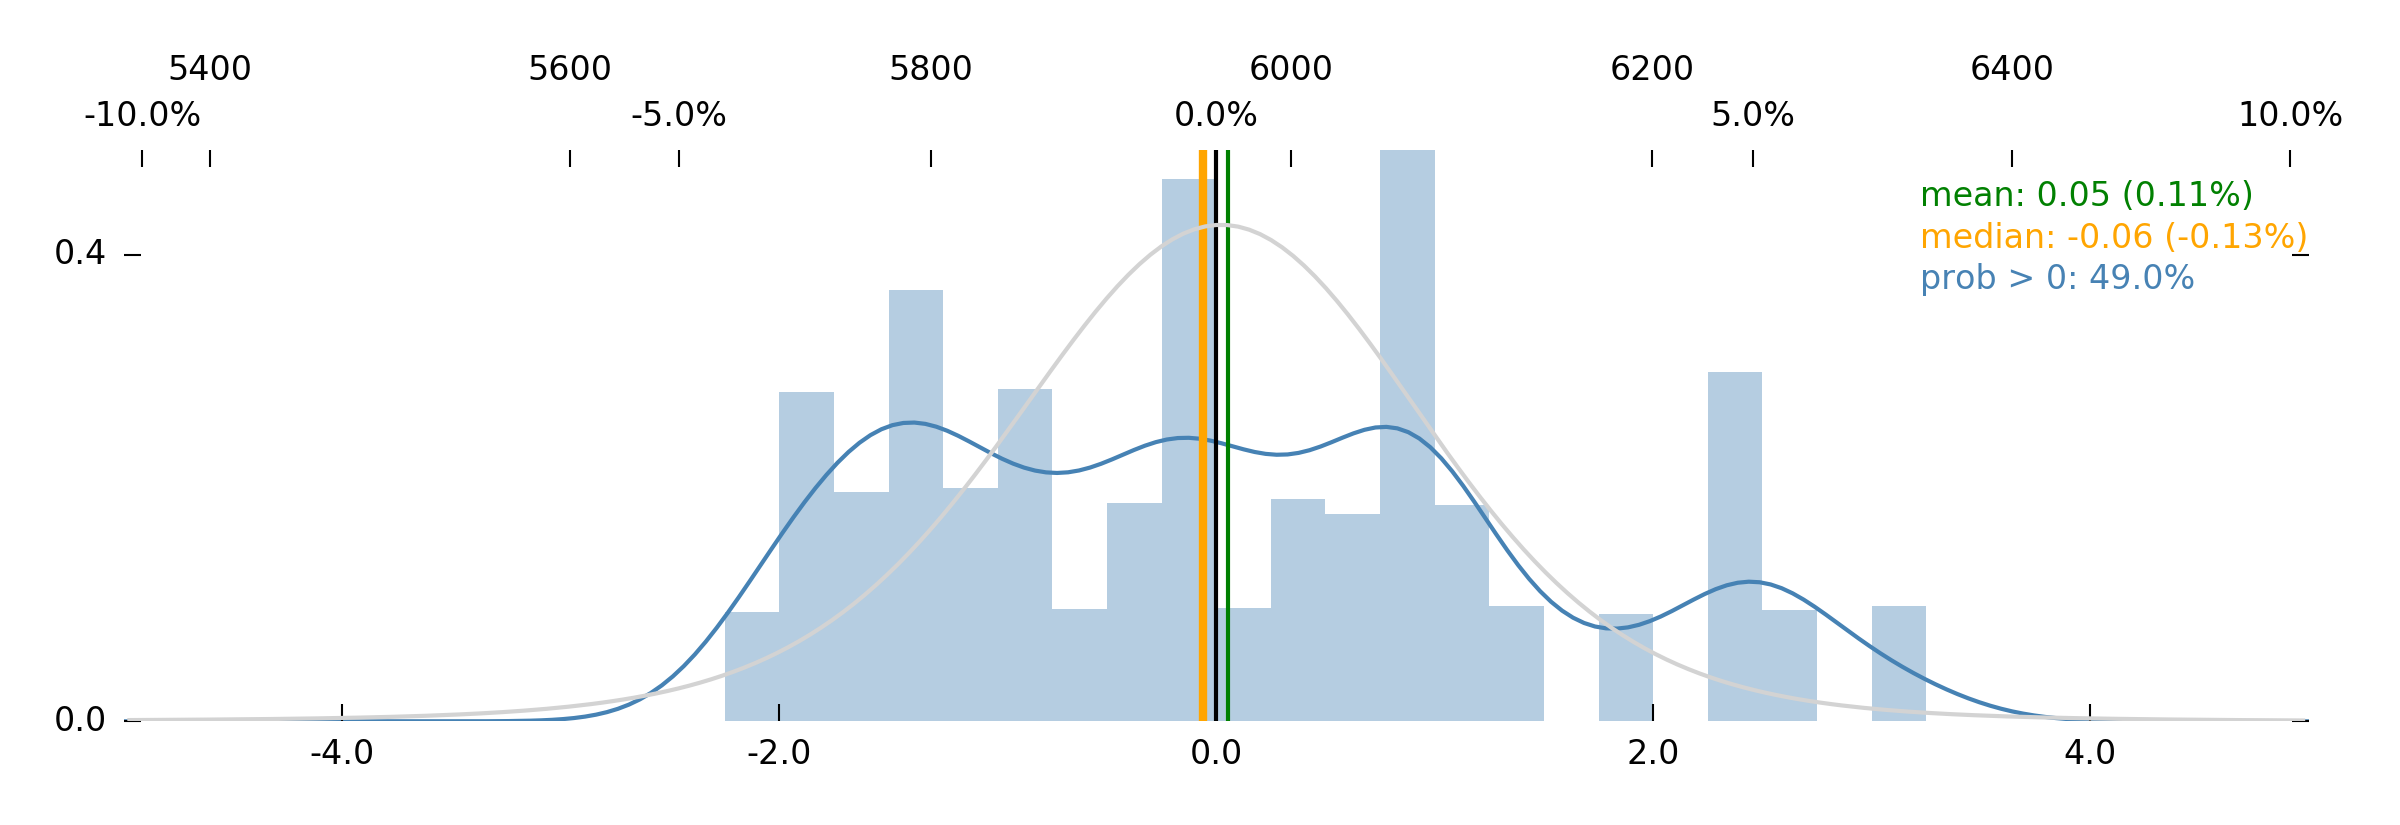
A word from Robot Jim on the subject:
He's neutral. He thinks long puts on a bet that SPX touches 5800, or lower, is a good idea. He also thinks that some deep OTM calls is an interesting bet. Let's take a moment to appreciate that Jim has been encouraging long [1-week] volatility and has been rather bullish for the past couple weeks; and he's been absolutely, horribly, disappointingly right. We were wrong to doubt him.
And so although we can't get behind the idea of betting on SPX 6200 right now, we think he's absolutely right about seeing an edge in a move to SPX 5800 or a touch below. So yeah, that's our bet for this week. Lines up perfectly.
Maybe we'll be right this time? It's nice to be right occasionally.
A word on bonds: TLT is now 5% below where we bought. Moody's downgraded U.S. debt. We assumed that this would happen, and we actually don't think it's a bad thing (akin to the inverse of buy-the-rumor–sell-the-news), especially as we believe inflation is withering and recession probability stays high, both of which keep a natural bid on bonds (absent worsening fiscal chatter). So far, we've been proven wrong on this bet, but we're quite pleased to ride it out, as the data still feels good.
It would be nice to be right occasionally, though...
Enjoy the week!
The SqueezeMetrics Team