One notable aphorism survives from the Aegean coast of Asia Minor in the 6th century, B.C.: "No man ever steps into the same river twice." The idea is that the river (and the man) is in a constant state of change—everything changes. Nothing stays the same, even from one moment to the next.
The "philosopher" who wrote this down was named Heraclitus. He was, it seems, a cranky rich guy who had the time and inclination to write a book of proverbs about metaphysical concerns. Normally, we're suspicious of old, cranky, and pseudo-scientific wisdom, but there's a reason this became a beloved adage: It's clever, and at least in one sense, it's true.
Why do we appeal to this provocative Heraclitoral wisdom? Because the year is drawing to a close, and it's time that we start reviewing the things we've done right, the things we've done wrong, and the things we haven't done at all. And as we are always, indeed, responding to a state of constant change—there are a lot of things that we inevitably leave unattended.
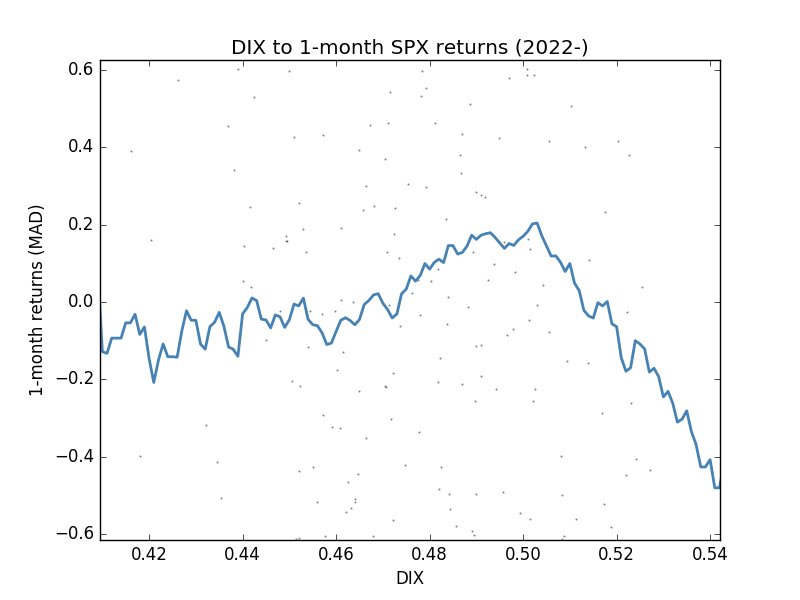
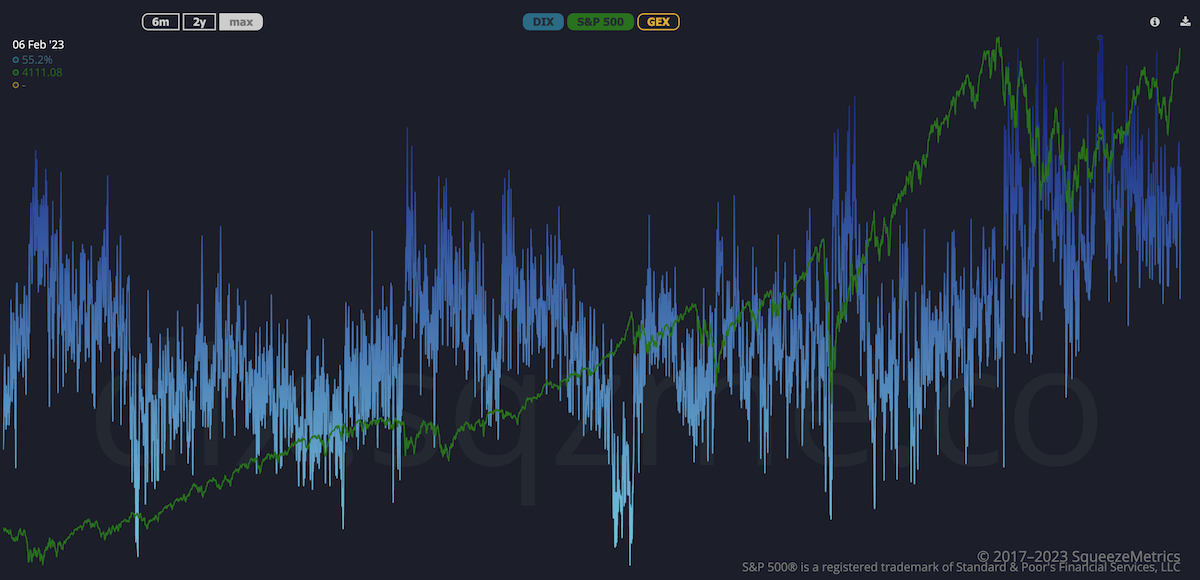
This is the association between DIX and S&P returns over the last two years.
There's certainly something wrong here. High DIX is supposed to be bullish. There should be a clear positive correlation here. So why hasn't there been?
But first...
We had a lot to say last weekend, but the conclusion was rather dissatisfying.
Nor, even in retrospect, do we believe that being long SPX into a CPI, a Treasury auction, PPI, and FOMC (with vol at 12) made sense. We didn't have any signal to lean on, except perhaps that "gentle upside" seemed in keeping with historical expectations (that's what Robot Jim said, anyway).
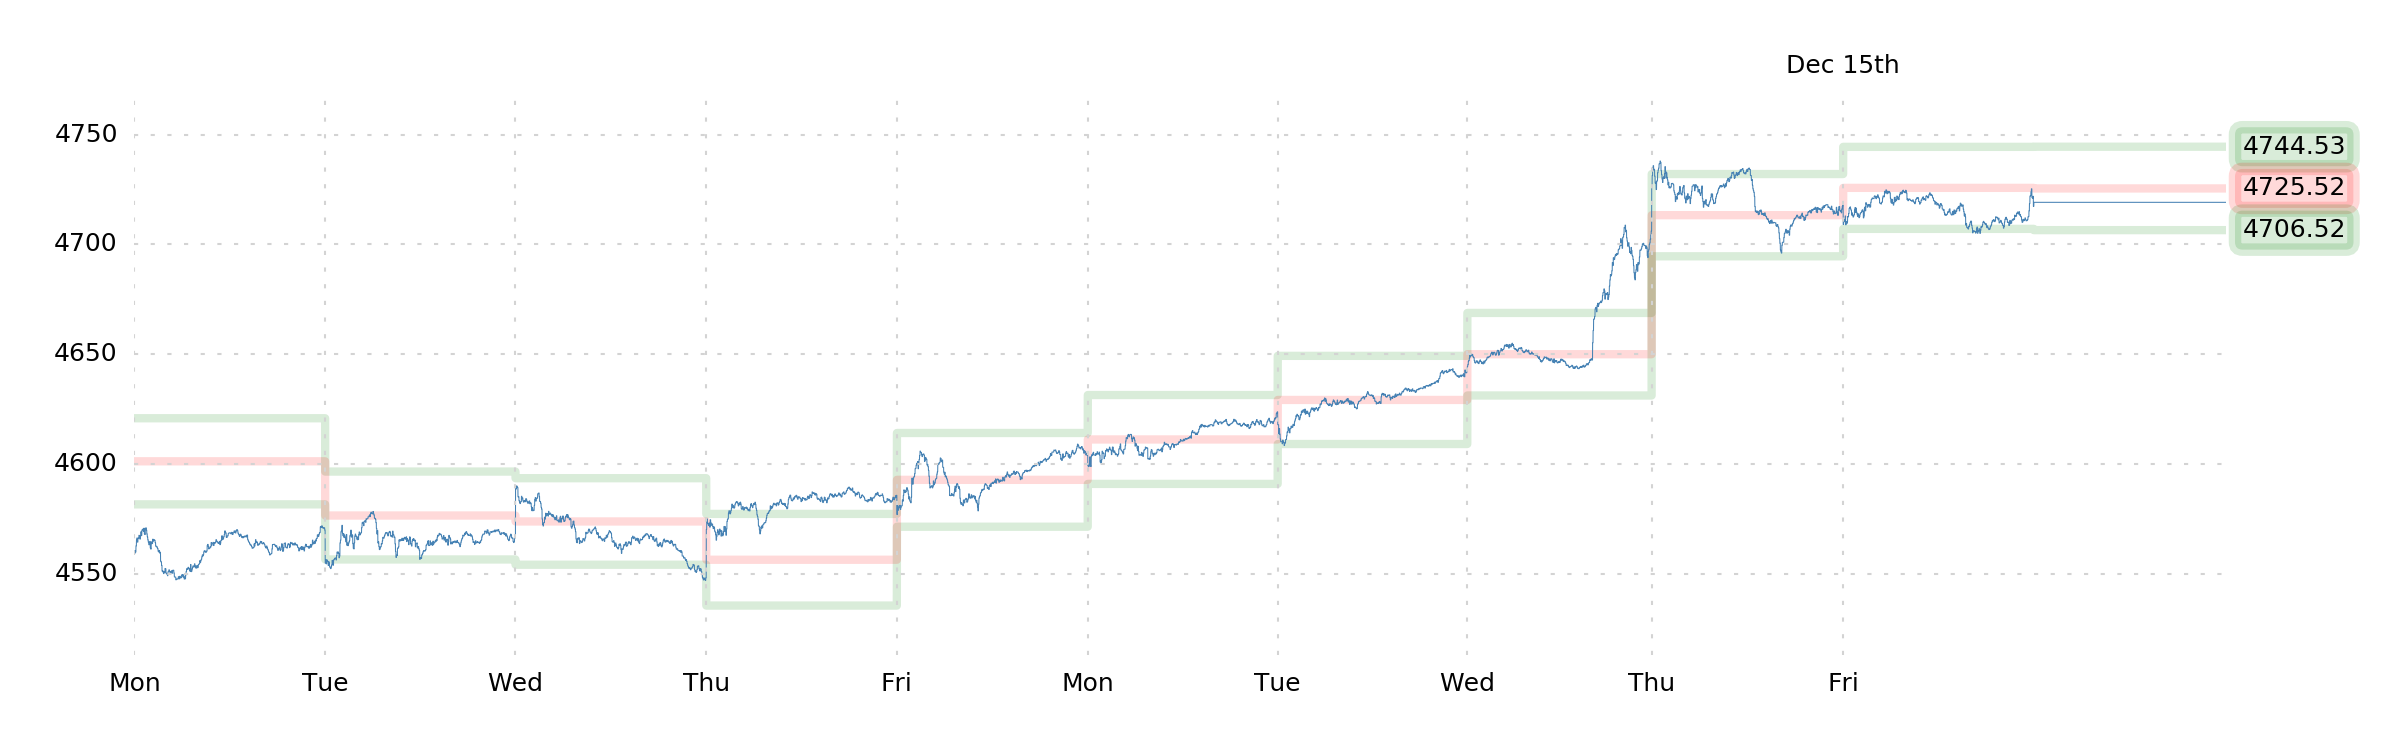
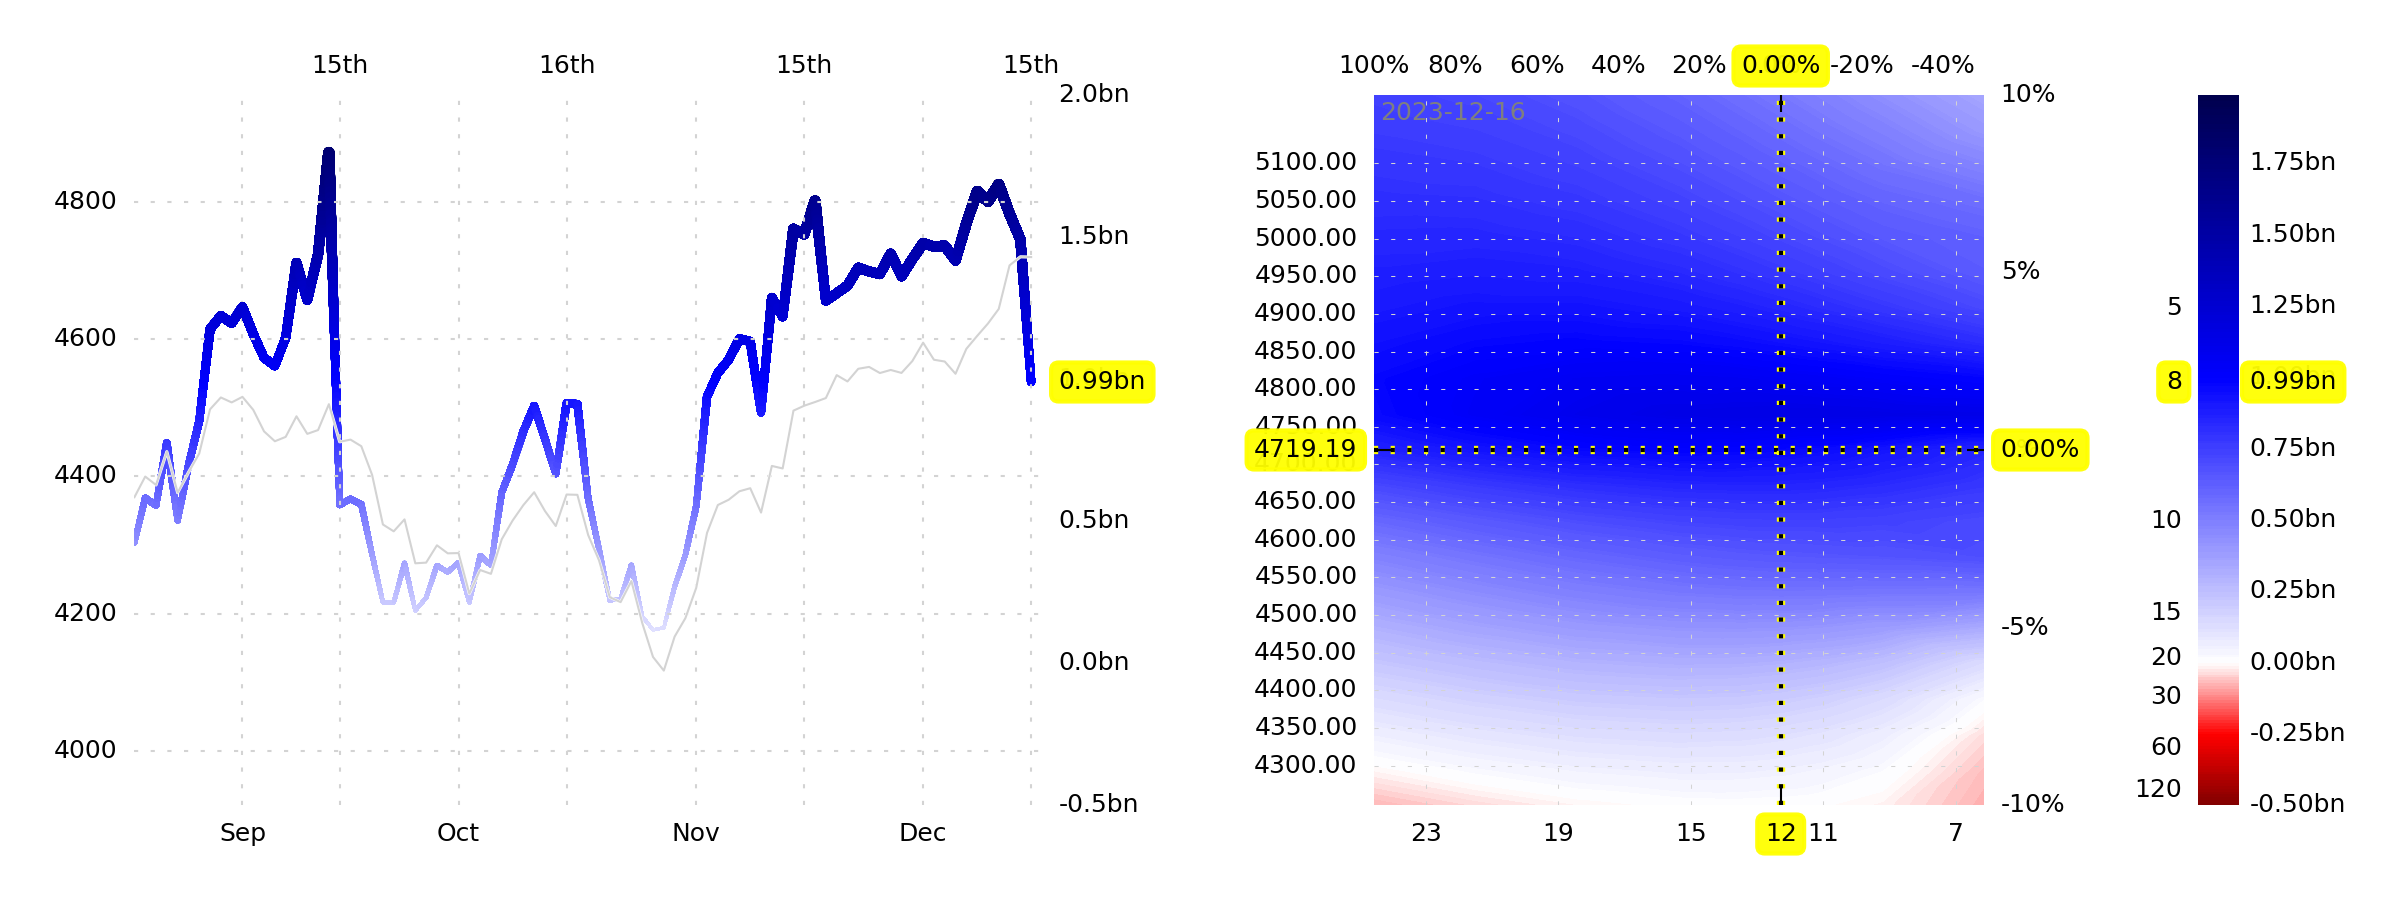
But on Friday morning, after watching flows throughout the week (which appeared to include some cutting/rolling from call overwriters, hence the squeezy behavior), we thought we'd re-evaluate the post-OpEx gamma-vanna landscape. And indeed it had changed.
This, at last, compelled us to take a position—the position we wanted to take, but could previously find no justification for: Yes, we bought some puts. For the time being, those puts are slightly OTM, and expiring in early-to-mid-January. We have both delta and vega. We don't have a lot.
Since, even within our own minds, this acquisition has been a contentious process, we're keen to justify to ourselves the suitability of a bearish position. Let's try our best to be even-handed and objective, though.
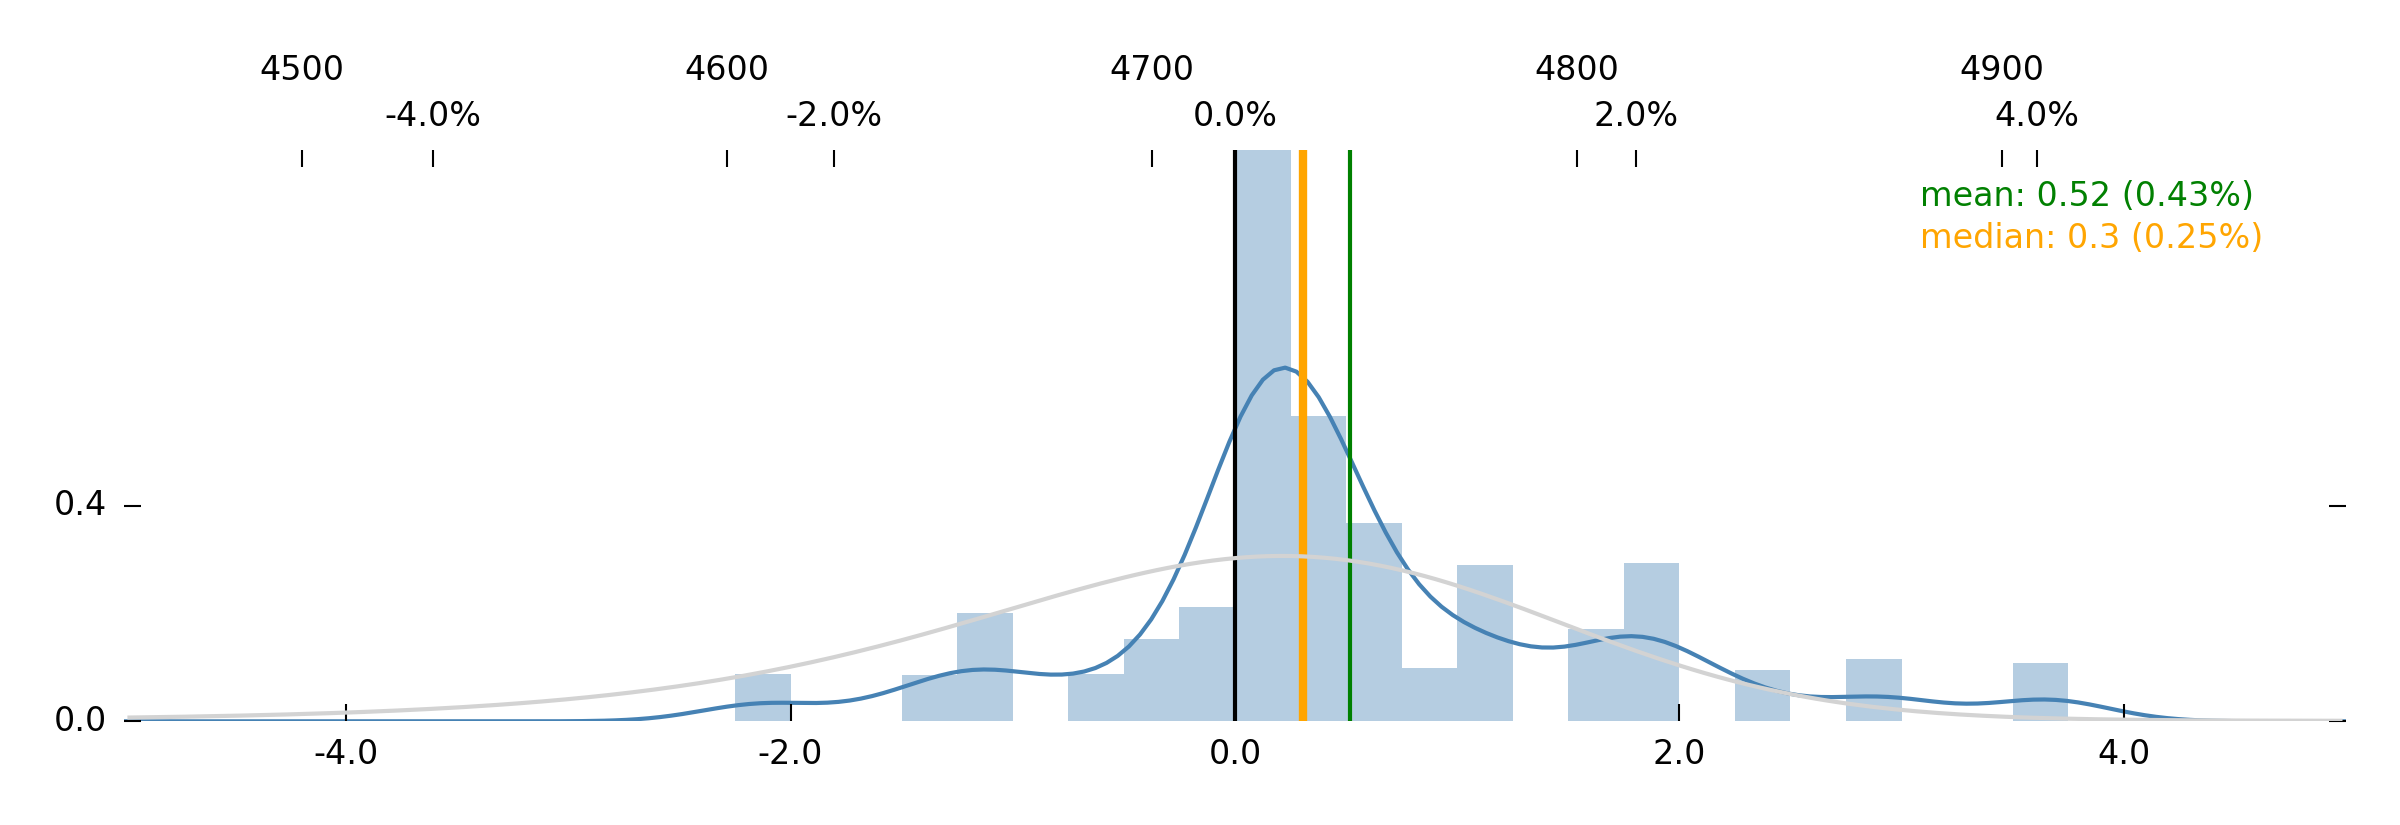
Well, apparently, we're not going to find any consolation from our Robot friend. He sees a good probability of stability, with small potential for large returns.
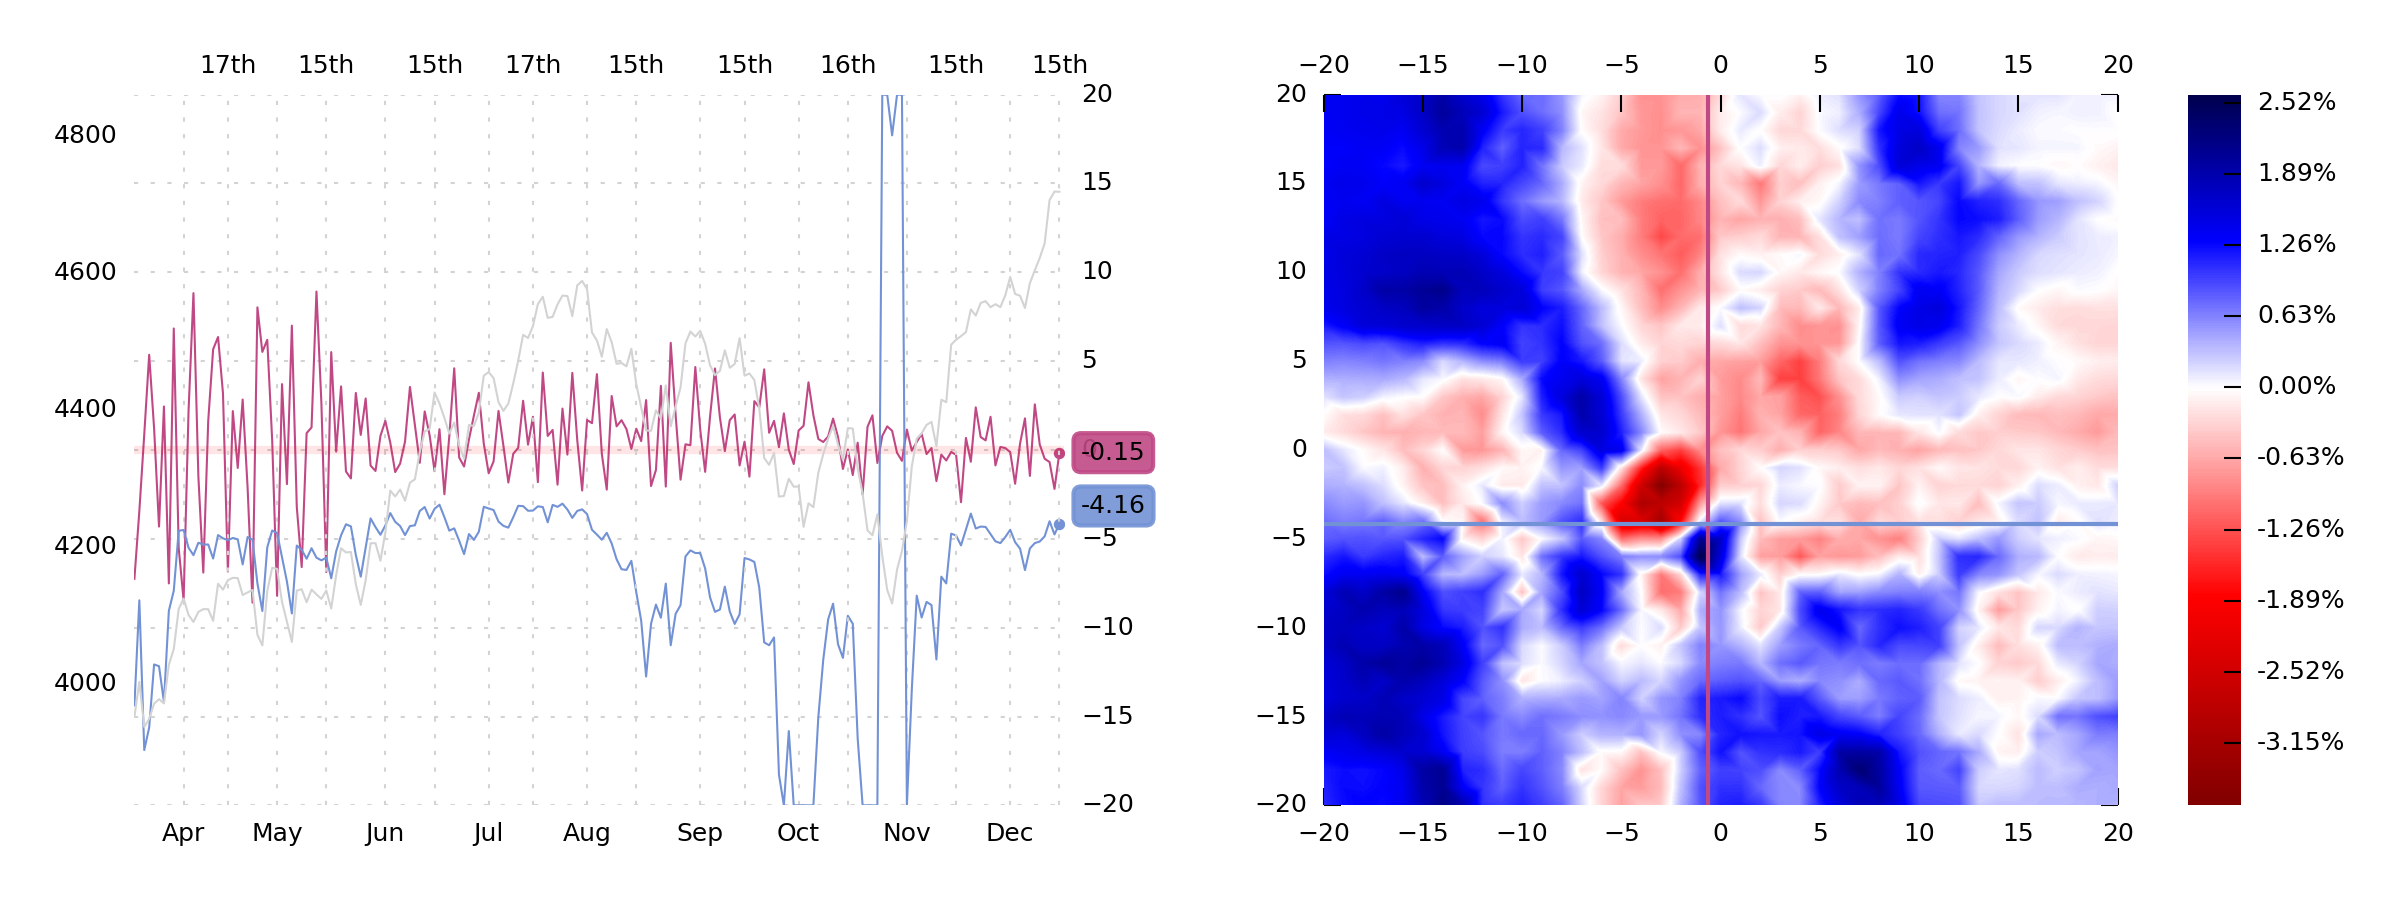
And the data coming from NPD and VGR—which we are always eager to consult for such things—is inconclusive, with the crosshairs on the heatmap precisely straddling the deep blue and deep red regions of 1-month SPX returns. What are we to make of that?
The rational position, it seems, with only this information, would be to bet conservatively (in a fixed-risk fashion) on upside. This has essentially been the case for weeks. And Jim has been right the whole time.
The only thing that's new, right now, is that instead of saying "expect more boring-ness" and "oh, it looks like there's some support here" like we have been since April or whatever—we feel like a bit of inevitable volatility is actually drawing near. Again, this is all muddy, shaky, and out-of-focus, but it feels like there's actually some room to move.
Then, too, GEX+ had just fallen a great deal, we were suspicious that bonds were going to go down (and take stocks with them), and we'd been [correctly, but reluctantly] betting on stability up to that point.
It is strange to us that something as simple as OpEx dynamics were important in September, and it is strange that they are important now. It is equally strange that we continue to justify our positions based on our feelings about bond returns, and the persistent stock-bond correlation.
But in September, we made a pretty penny getting short SPX for a couple weeks. Might we get so lucky again? Perhaps, to bolster our argument, we can revisit some of those bond factors that, actually, have done a great job of guiding our positioning. In case you don't recall, those factors were (1) Jim's forecast, (2) Trend, (3) CFTC CoT dealer data, and (4) TLT option flows.
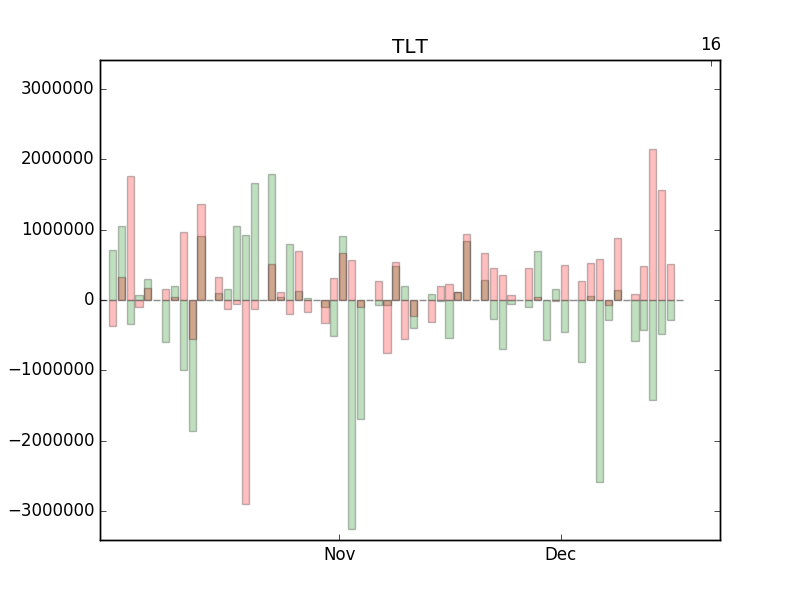
Jim's forecast? Neutral to bullish. Nothing to write home about. Trend? Up, obviously, which is usually associated with more upside (within reason, of course). CoT dealer data? 84k Ultra contracts held short by swap dealers. Neutral to bearish (especially after a rally). And then our favorite, TLT option flows?
Wow! That's a lot of put sales in the last three days! And therefore, quite a bit of customer net long delta.
Customer net long delta is an expression of good sentiment. Good sentiment, expressed in the option market, is usually a bad thing for the underlying. The interpretation has worked wonderfully so far. (See where that big green stalactite indicated tons of call selling at the beginning of November? That was the beginning of this durable rally in bonds—and we haven't been bearish since then.)
So there—at least there's some data coming up in our favor. As long as the stock-bond correlation persists (and at the moment, it looks like it will), then we should finally see some pressure on bond returns here, and that helps us a great deal with our bearish SPX bet.
At least let's keep telling ourselves that. Because we want to be bears right now.
Now let's talk about our long-lost love.
DIX: The Reckoning
Is DIX dead?
No, it's not. But we have to tell a story to get you to understand that. And there's a lesson in the story, too, so it will be fun and edifying.
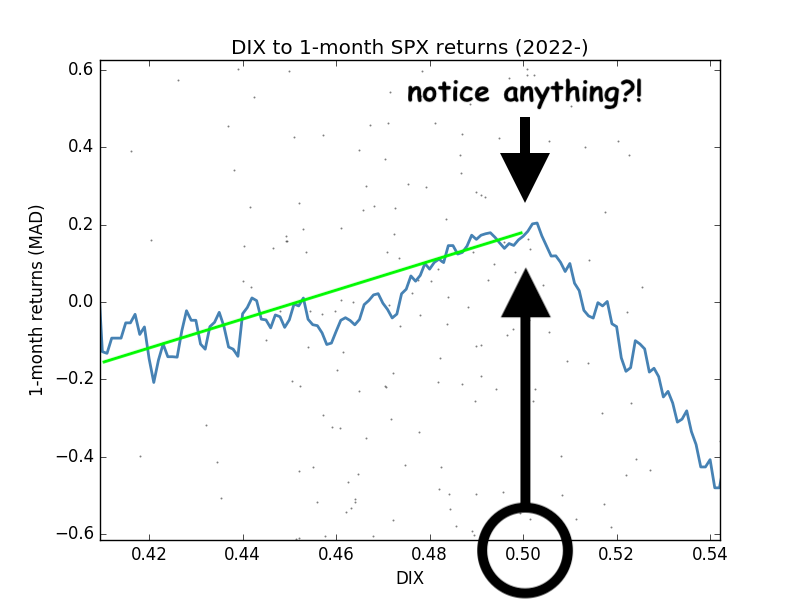
You already saw this plot, of DIX-to-SPX-returns. Here's the same plot, with some obnoxious annotations.
So, what you're supposed to notice is that the green line (a chi-by-eye approximation of a best-fit regression line) is positively sloping, and exhibits the behavior (though weakly) that we expect of DIX: When DIX is higher, subsequent SPX returns are higher. But above a certain reading of DIX, that correlation rapidly breaks.
What is that DIX reading where it breaks?
50%.
Why is this interesting? Because a 50% DIX reading is extraordinary for two reasons: First, because it's really, really high. Like, it pretty much never happened until 2022. Second, because a 50% DIX reading technically means that half of all dollars of dark / off-exchange volume in the S&P 500 were marked "short." And if we go all the way back to our original
"Short is Long" thesis on dark pool short volume, it would be pretty weird to expect 50% of transactions to be short, and it would be
very weird to see
more than 50% of transactions short. Indeed, our rule of thumb was that 45% DIX was "very high," and that 45% DIX predicted some pretty good S&P returns.
Ok, so what does it mean that so many DIX readings in 2022/3 were 50% and higher?
Logically, it probably means that there was a lot more than just transactional, market-making short-selling going on. It means that some people were actually short-selling stock deliberately, in huge amounts.
So, whereas a normal day's breakdown might involve 12% of volume crossed with both parties long and the other 88% split between buyers (buying from dealers who short-sold) and sellers (selling to dealers who [long] bought), culminating in a total market dollar short volume ratio (DIX) of 44%—in order to believe that DIX would get much higher, you'd either need to believe that crossing networks and customer block trades all died in 2022, or you'd need to believe that an unusual number of the people who were selling to dealers were short-selling.
And it was, of course, the latter. There were indeed a lot of short sales across the market.
Alright then, that's confusing. Why were there gobs of short sales? And why did that only start in 2022? And why did those short sales not show up in a hugely elevated short interest (gross shares held short, as reported biweekly), market-wide? Why didn't all the stocks of the S&P end up with 5% or 10% of their floats short if there were so many discretionary short transactions occurring in stocks?
Take a deep breath and remember Heraclitus. Everything is in flux. The market is an ever-changing river. It ebbs, it flows, it is never the same from one year, or even one season, to the next.
We know that the most notable thing that changed in 2022 was that very short-term rates got jacked by inflation. What could rates have to do with short-selling?
Well... consider that when you short-sell a stock, you receive cash from the sale, and you can now do something with that cash. Something like, maybe, buying T-bills with jacked yields. Certainly, yes, you must pay to borrow the stock, but (despite the rapidly increasing sophistication and reach of the Securities Lending Mafia) the cost of the borrow does not automatically adjust to the risk-free rate—it's a market like any other, and there's a ton of interest in stock lending (even Robinhood does stock lending now, and do you think they get their customers a rate that even resembles the rate on T-bills?). As a result, there's a substantial opportunity in short-selling a basket of stocks and collecting, with the received cash, a tidy coupon.
Yes, these are the deep, dark recesses of securities finance, and we don't know any of the implementation details that make the Magick happen, but when you think about it, it's actually quite obvious that there are market players who would be downright chuffed to roll a dynamic, diverse portfolio of short stocks (involving many short sale transactions), and turn over that inventory in such a way that keeps the cash available, but avoids holding the same things in the same amounts, and avoids reporting requirements at the same time.
Indeed, for many market players, this would be as simple a move as saying, "Let's just be more willing to hold short inventory in stuff that offsets other long inventory that we'd like to be holding for [some operational reason]."
That's it. That's why this started when inflation started, and when rates went to the moon. That's why it's still going on, too. There's a huge market for stock lending now, and while it's more transparent than it's ever been, it also has a lot of demand (where "demand," here, is coming from people who are obliged to hold shares and would love, love, love to juice their yield by lending them out to short-sellers).
And that, too, is why DIX has been logging over 50% so often. Honest-to-goodness short-selling. And it's why those really high readings aren't associated with positive subsequent returns (because it's an artifact of a rates trade, not of actual demand for stock being met by dealers).
What does this mean for DIX? We're not sure! The problem is that there's really no clear-cut answer. If rates go down, that probably means the securities finance / lending arb dries up; but if rates stay high, that doesn't necessarily mean that the trade stays this large (because as the market becomes more efficient and the supply of financiers willing to bring the stock borrow rate closer to the rate on short-term cash rises, there will probably be less volume in this trade). So it's not clear how much, and how long, this continues to distort "short volume" data in OTC transactions.
We can walk away with one heuristic in the meantime, though, and here's where the "lesson" comes in: Whenever DIX is well above 50%, that's probably not a bullish thing. Why? Because it obviously means that there are short-sellers galore—real ones—doing some big finance trade. And that's not what DIX is supposed to be about. What's the lesson here? Don't obfuscate your own data!
We mention this because we've toyed with the idea, over the years, of "smoothing," or normalizing, or z-scoring DIX. Of, e.g., turning it into an index with a domain [0, 100]. We never did, because we always thought that we should keep a little window into the raw data—that we shouldn't entirely lose sight of what the number is tracking. And this is why. Because you can see it right there on the chart, at 50% DIX. That's where things start getting funky, and there's a good reason for that! It's logical! We should find it odd when more than half of the S&P 500 dark volume is short-selling. But if we'd normalized the data, we'd have never seen that.
What shall we conclude, then, from the aforementioned Heraclitoral wisdom? Sure, things change, but it doesn't do any good to obsess about it. Rather, it's our responsibility to navigate that river despite its change, despite its dynamic unpredictability. We should thrive in the state of constant change. That's the goal. (And the lesson is to always make that as easy as possible.)
Long live DIX. (Despite its recent inadequacy.)
Enjoy the week!