Hey guys,
It's now been over a month since we launched the new site, with the Jim-centric charts, PDFs, and spreadsheets. For several months prior, we'd been performing exceptionally well trading a market-neutral portfolio of single-name tickers using a combination of the PIVT data, with the usual DPI and GEX.
The hope was that we'd be able to do the same or better (and to make the process easier!) with this update.
Success.
You don't have to agree, but we think it's been a pleasure to poke through a few charts (starting with the Research page) to get a cursory idea of what might make a good long or short, assemble a list, then execute on a few at once that we feel fit together into vague pairs or sensible combinations.
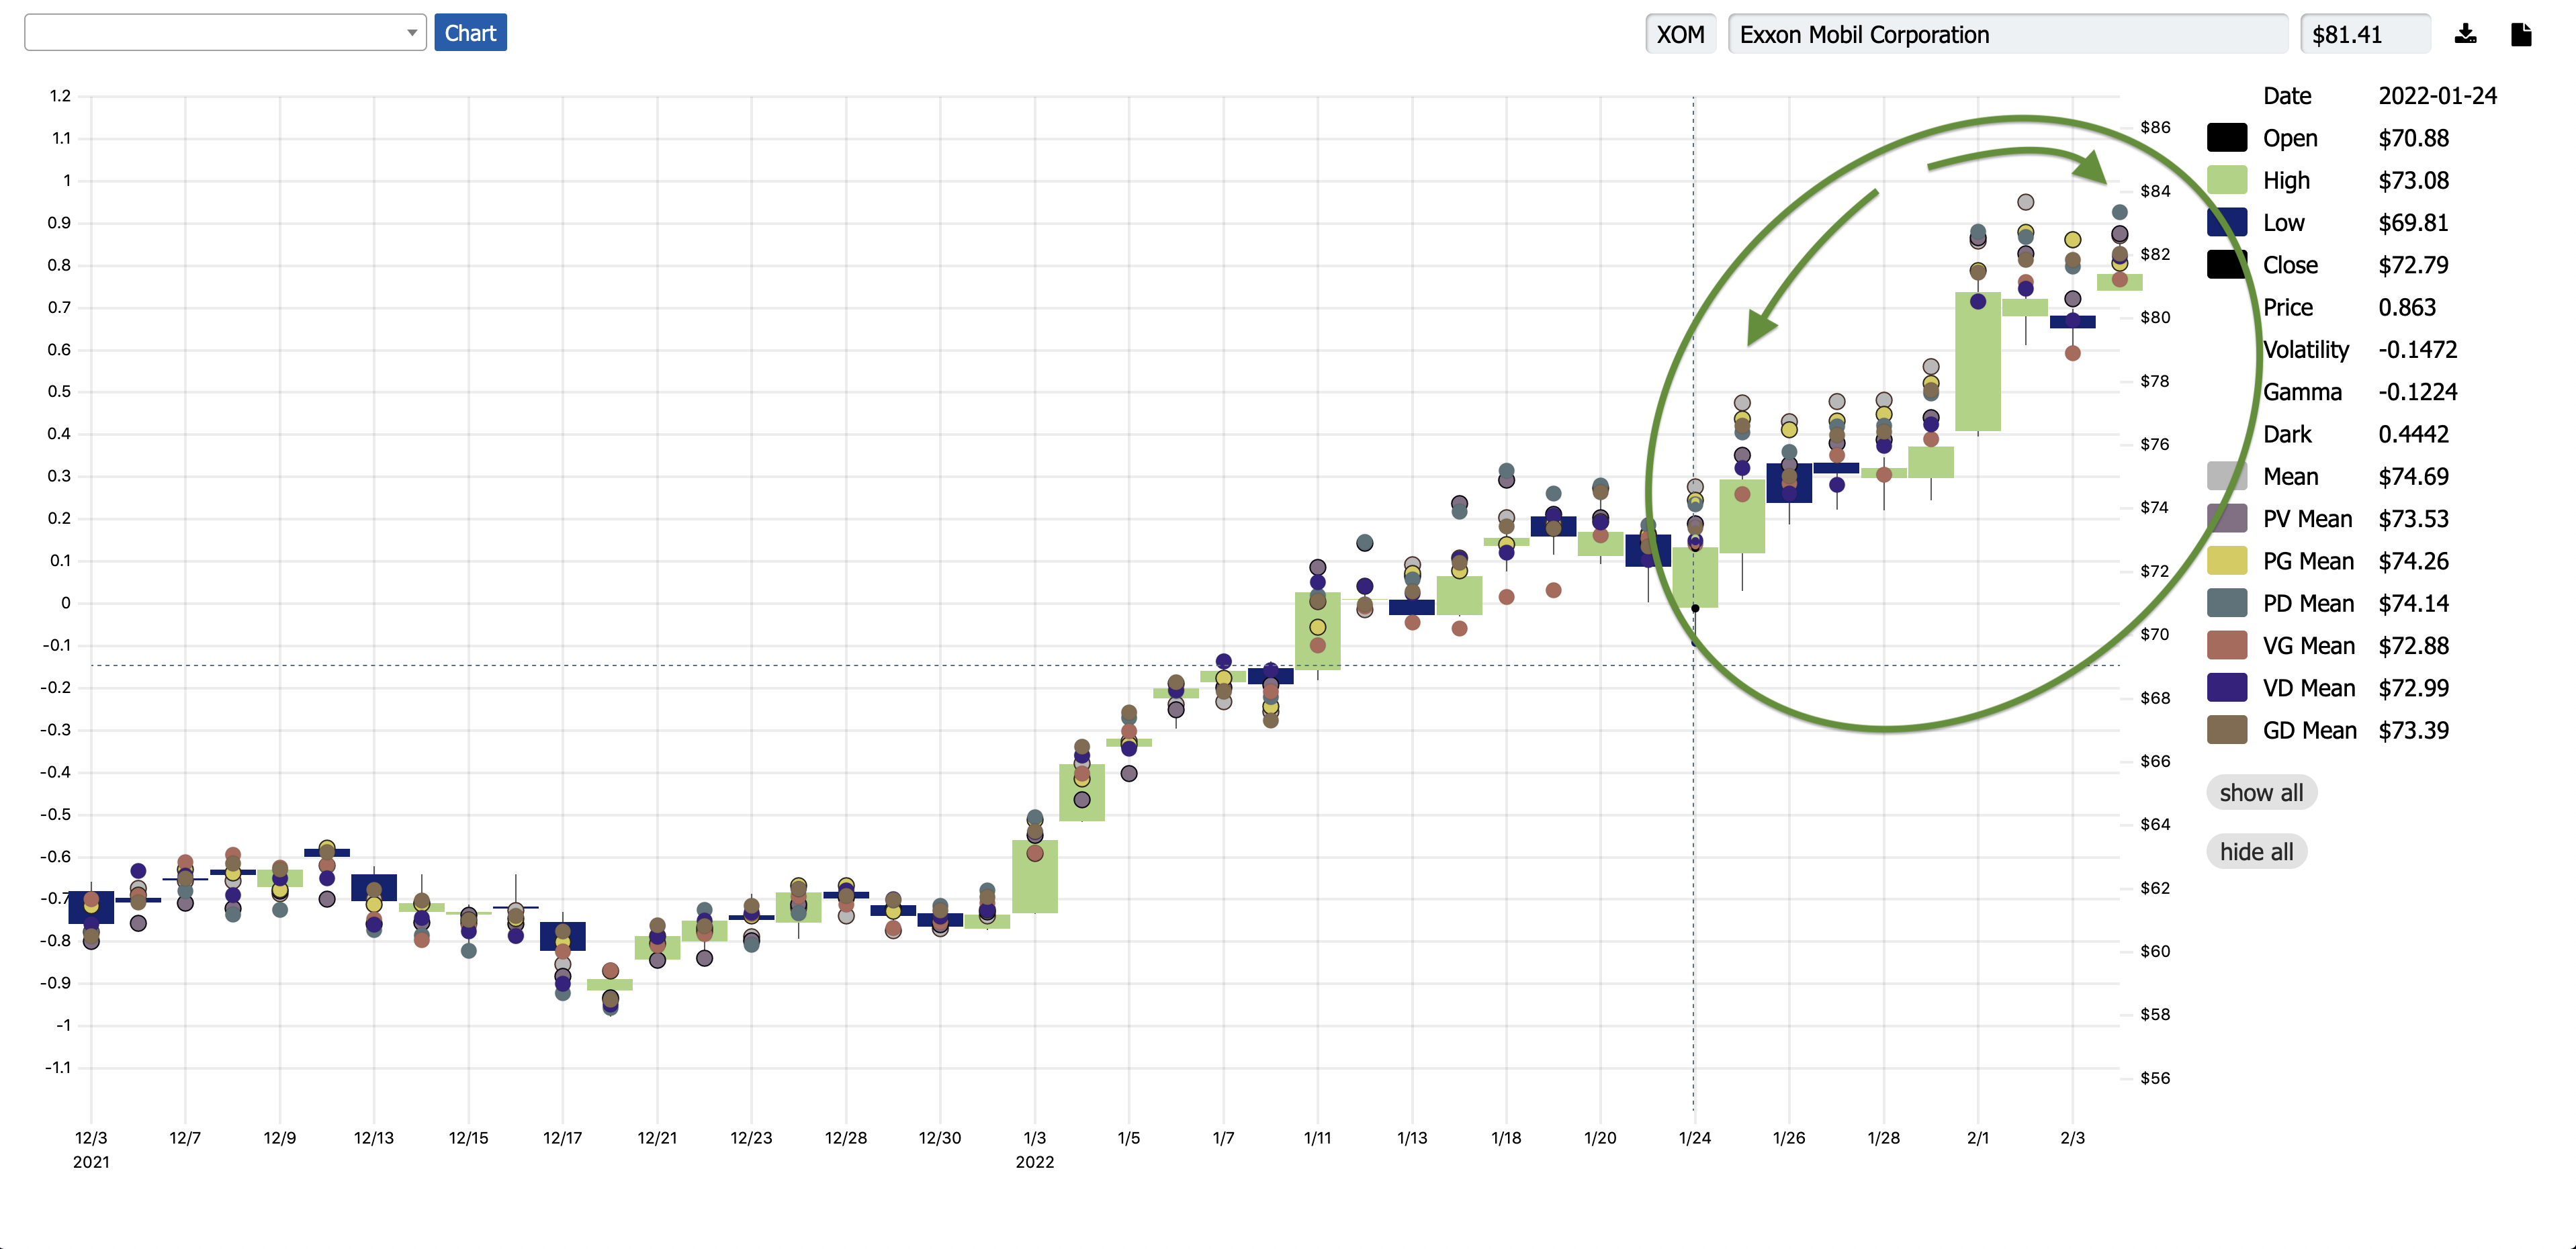
As an example, we've been long XOM recently...
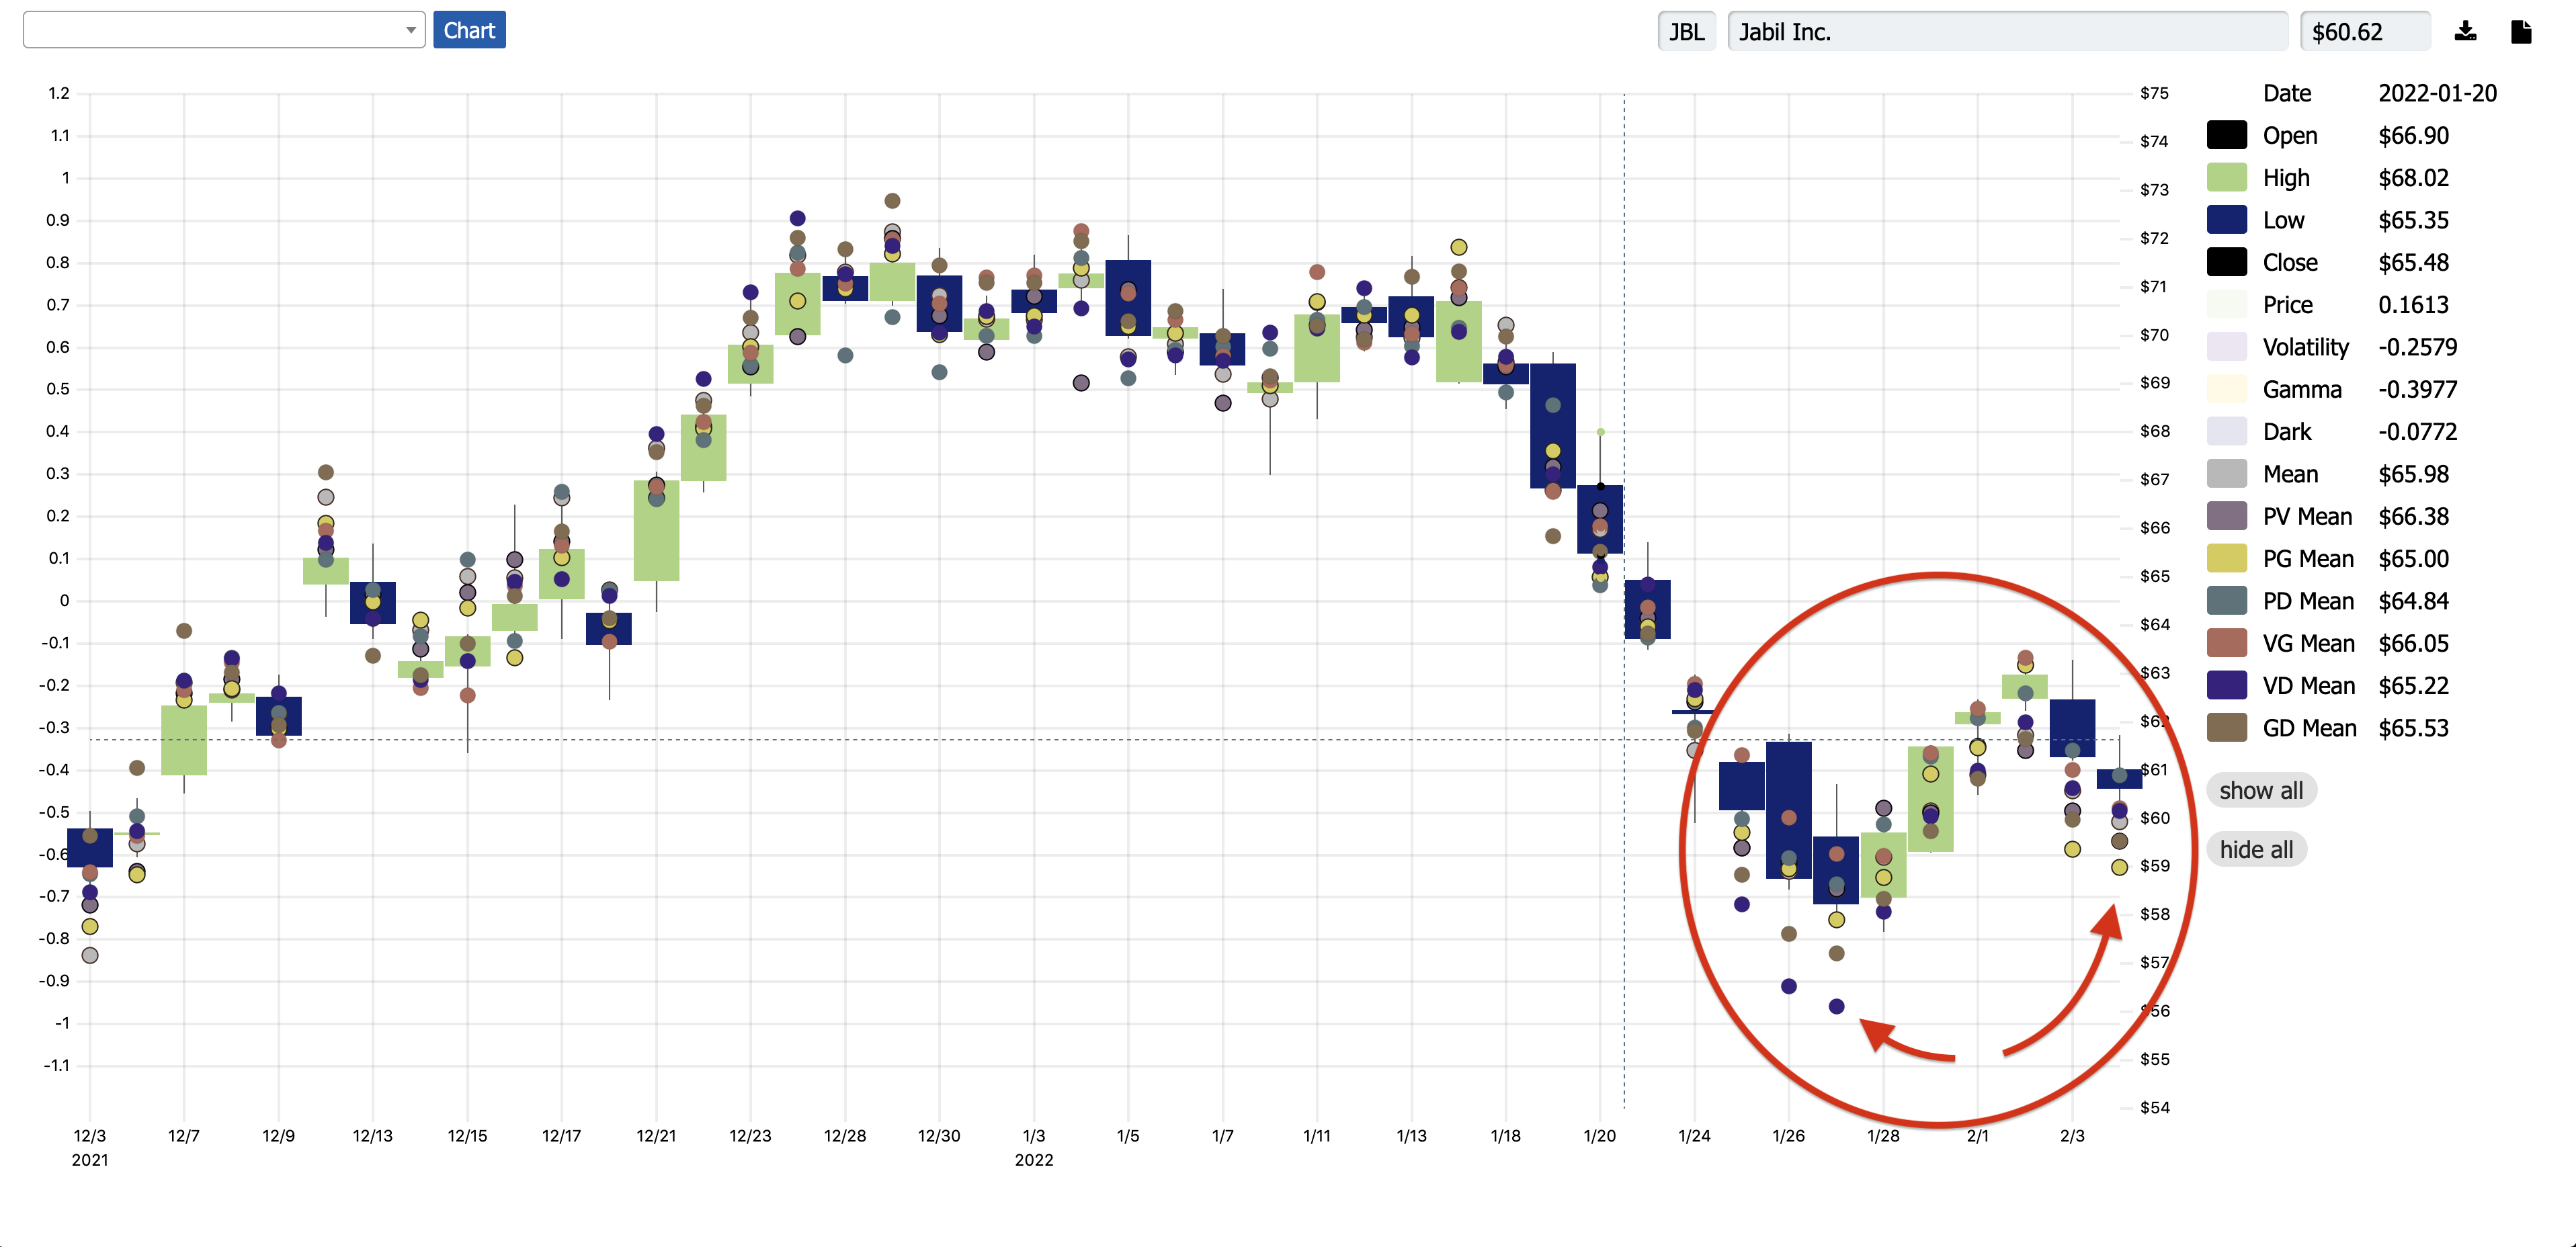
...and around the same time, short JBL.
The long has gone up some 12.1%, and the short has gone down 1.6%. For a short-term trade, this is a staggering return, and so far, we've been able to replicate this success repeatedly. And while we look to see if there are any binary events (e.g., earnings) or relevant news items on the horizon that might nuke a trade like this, we've been able to keep the process pretty dumb otherwise.
This is exactly what we were hoping to be able to do, so we're downright chuffed. And it's especially pleasing to be playing in this space, with this unusual market-neutral strategy, because by golly—it looks like it's going to stay weird out there.
To the extent that one can be "nimble" and "uncorrelated," now feels like a very good time. Fortunately, this week was a good week for our S&P 500 trading as well, so let's get into that—but let's also ponder why there are so many smart people (and Jim!) who are telling us to be cautious.
-1 week
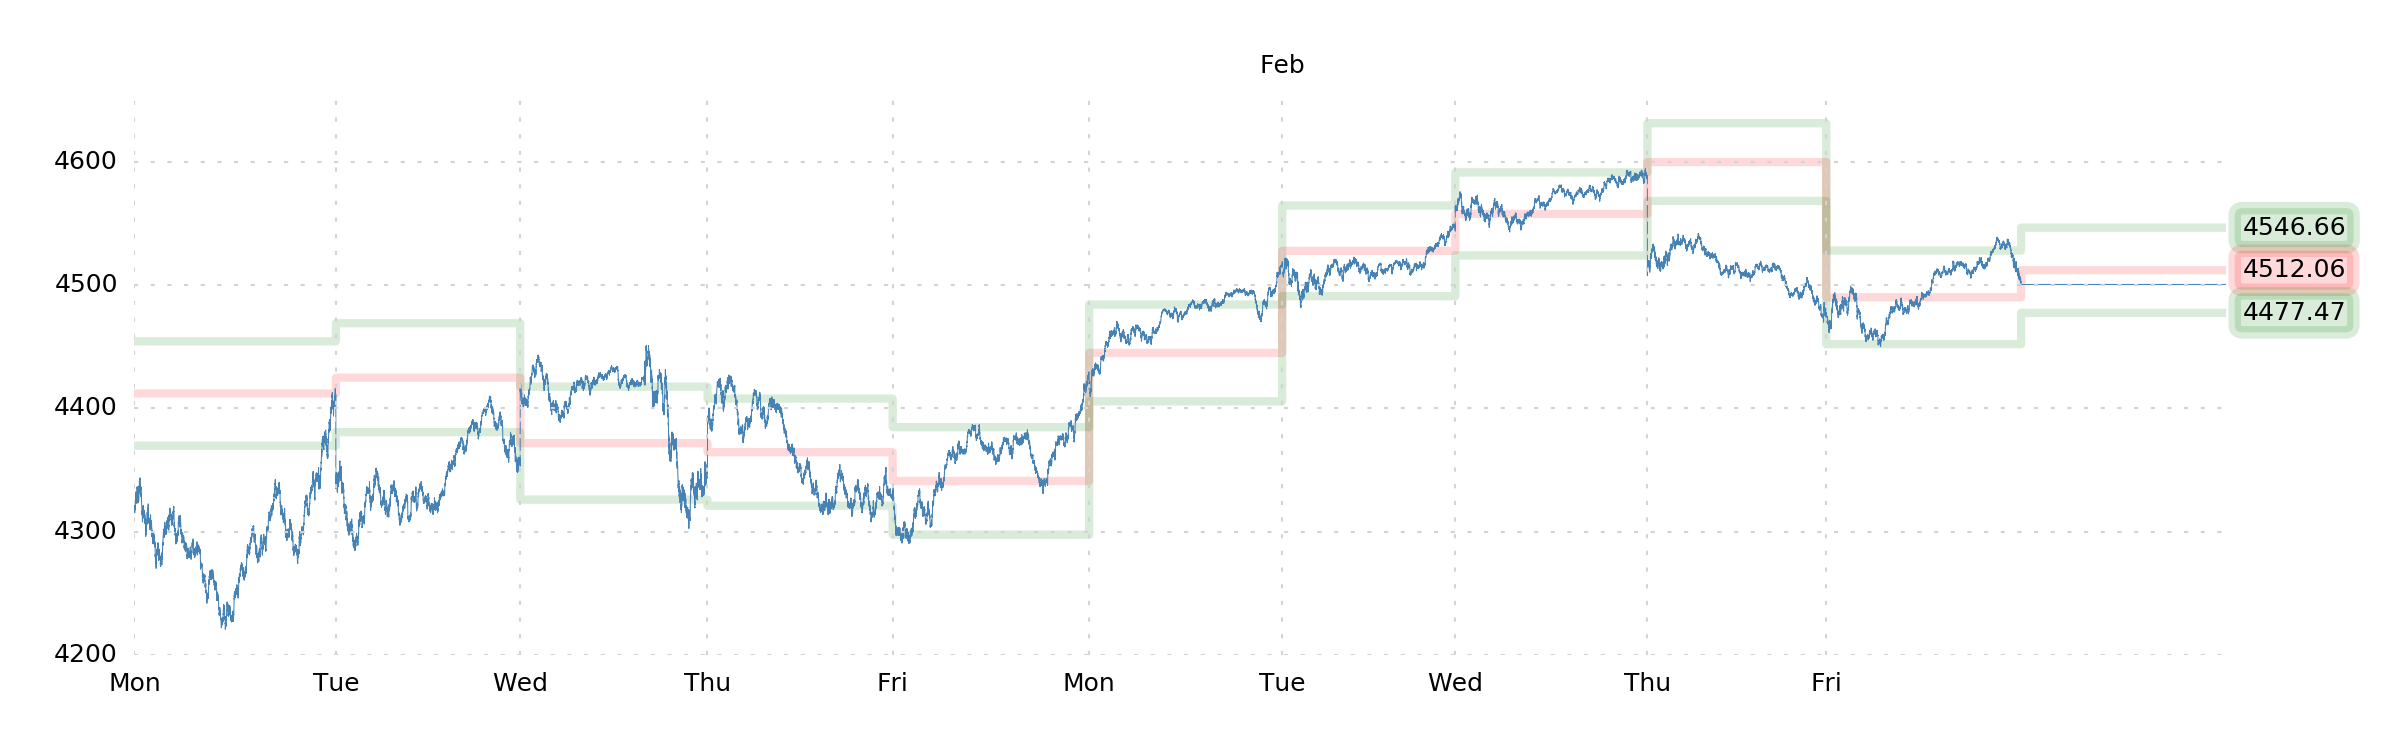
We started the week heavily leaned into some call positions. Very heavily. From last weekend:
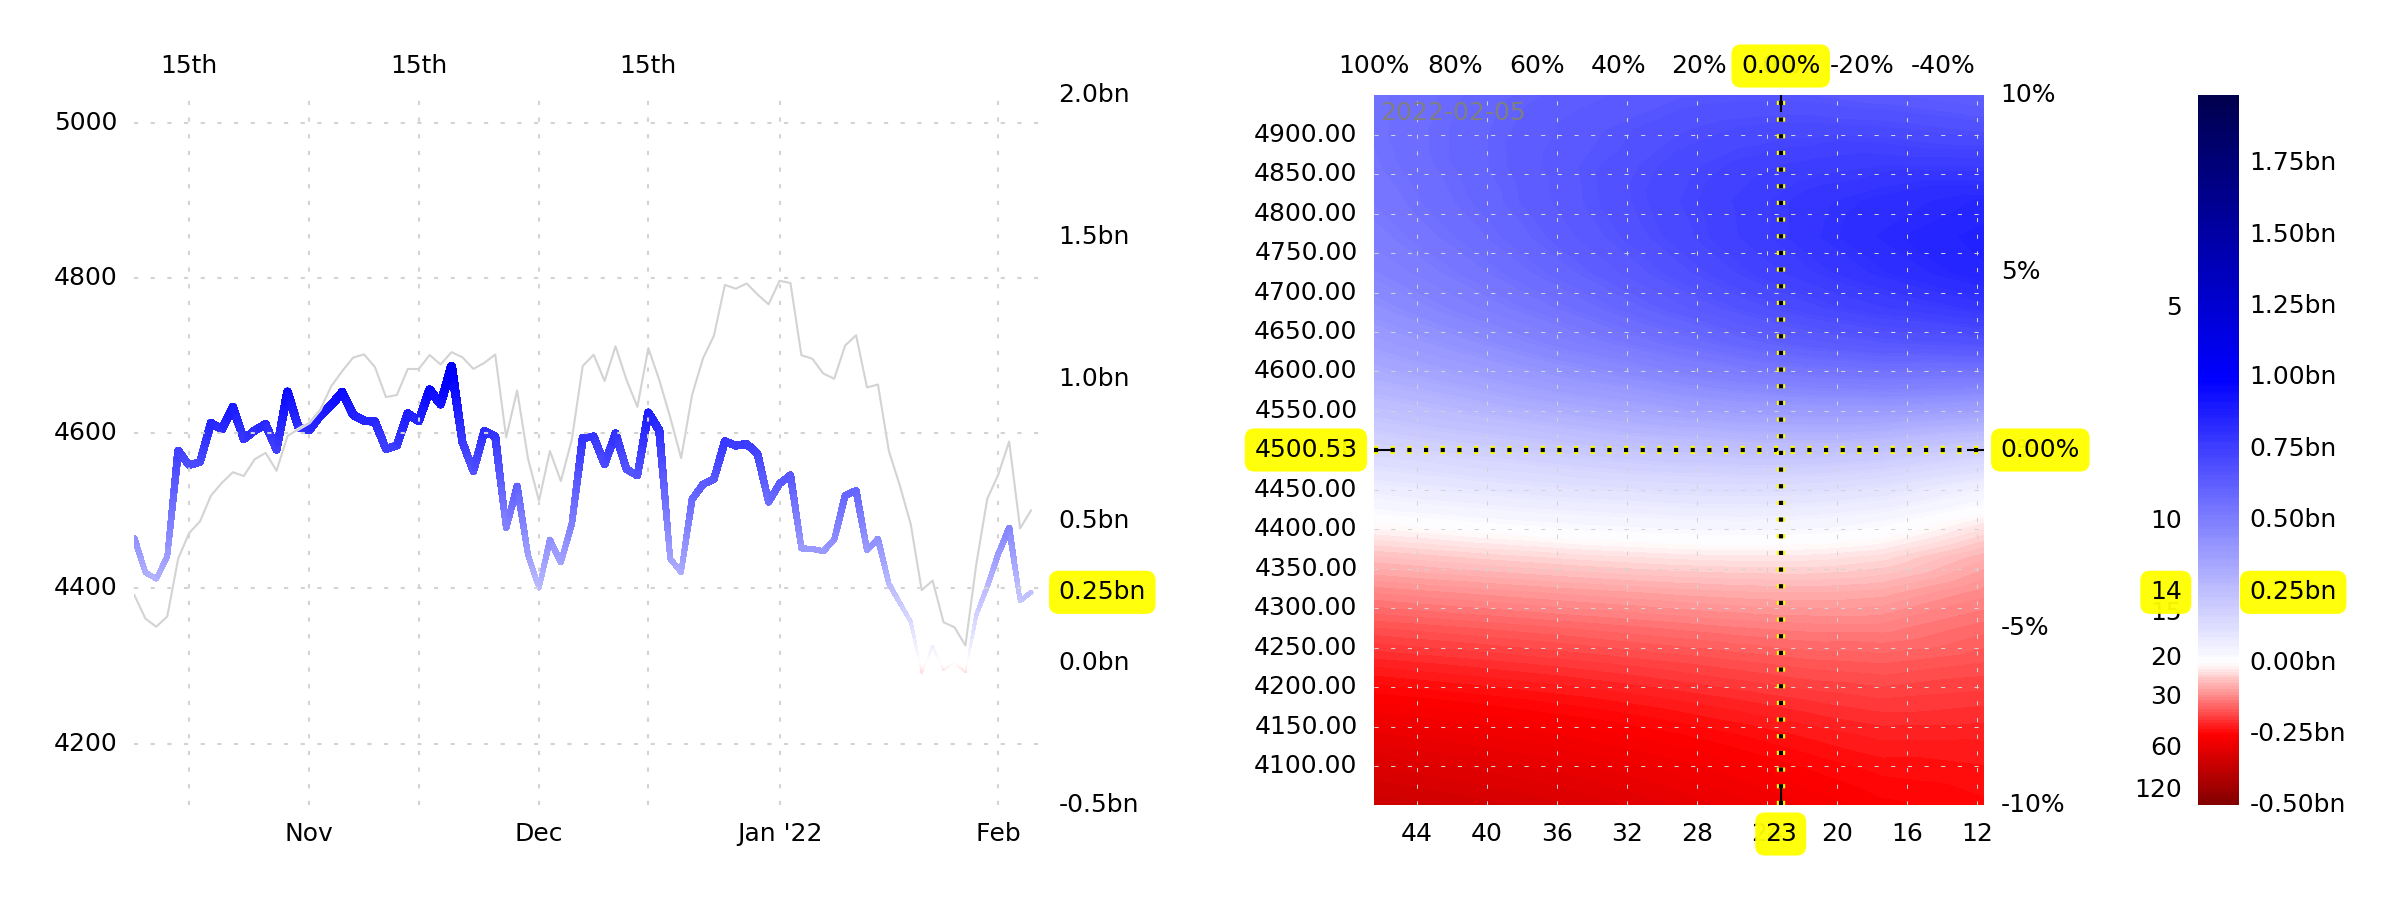
Jim's distribution confirmed this uptick in bullishness—and at least for the next 6.5 market hours, this turned out well enough. Which is good, because... we have a lot of calls.
But how will those calls fare this coming week?
[...]
Yes, it obviously leans bullish, but no, our positioning is not correct right now. Our mess of calls—what we were holding during the week and what we added on Friday (recall that we "dialed it up as high as we'll go")—is now a bit too aggressive.
So the plan, regardless, was to trim exposure into Monday. And for the remainder of the week, our attention was going to be on NPD, which was a much-needed source of stability.
So NPD is still a big wildcard here, and that means we're going to need to take this day by day, just like we did last week. Although the bid from DIX, and the rather safe volatility situation, are very nice to have—the stabilizing (and bullish follow-through) impact of bought puts is unparalleled.
Overall, Monday morning gave us a great opportunity to cull some calls and spread the rest.
Leaving us very comfortably nearer our sold call strikes, and benefiting from any bullish-to-neutral moves through the end of the week (until Friday, anyway, when we sprung for some OTM calls in the AM).
Both DIX and NPD followed through very well, with obvious dark pool buying and SPX put-buying continuing. But despite this stability... Jim never actually became bullish. Indeed, relatively speaking, Jim encouraged us to exercise caution—indicating only modest mean and median gains throughout the week.
And we can't blame him for that, since it seems he was right. But we still weren't expecting Jim to be so muted and cautious, and we take his caution seriously—since he sees things we can't.
Is he still feeling that way?
+1 week
It's worth clarifying that, yes, we have an OTM call position now (which was doing great, by the way, until the last half-hour on Friday), but an OTM call position is a fundamentally cynical bullish bet. It's a bet that there will be an illiquidity problem above spot, leading to an unstable, outsized move upward. It says, "I'm not bullish, but I don't want to miss out in the unusual event that this thing ramps."
Our remaining call spreads are by no means aggressively struck or sized. So we've been taking Jim's advice, by and large.
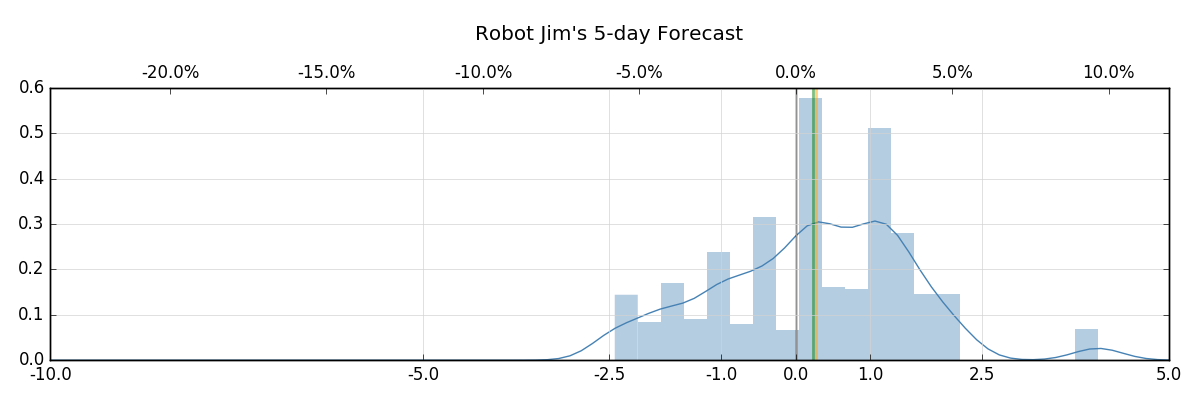
As it so happens, he hasn't really changed his mind, either.
As on Friday morning, it's a platykurtic distribution (peak at 0.3, broad shoulders, flat top). This encourages fairly big, broad moves, up or down. Sadly, the right tail has weakened, so we may ease out of some OTM calls—especially into strength (always a matter of luck with these things).
Altogether, this is very... noncommittal. Weak mean and median and broad shoulders are a recipe for biggish moves that get interpreted by the rabble as meaning something important, when really, it's entirely to be expected.
Given the strong DIX and NPD data recently, we don't see any malice in that left shoulder, so we'd probably ease into longer delta if the index falls (it seems likely that Jim sees GEX+ being low and expects liquidity, overall, to stay iffy—hence the broader distribution).
Perhaps the most important thing to express, then, is that we'd totally plan on buying the dip, if we get one. The combination of high DIX and negative NPD are still stabilizing, and Jim definitely doesn't have a left tail in there. Nor is Crash Risk getting worse—it's still at 2.00x, which is safe.
But absent that, it's hard to figure what to do with the way the week plays out—and as such, we will once again be taking it day-by-day. It was another good week for the ol' PnL (owing to the aggressive positioning into Monday), and we can't complain.
Though to be honest—we're still in the hole from the mid-January selloff (which was, in Jim's estimation, a left-tail event). So we can't pat ourselves on the back too hard.
2s 10s
You may recall that, back at the end of October, we brought up our misgivings about the future of S&P 500 returns. It seemed like smart rates people (the "STIR crazies") were getting uncomfortable, and that always makes us tingly—especially after a year of absurd returns immediately following a global crisis.
We brought this up again recently as we got thumped by a wave of index selling. It felt like the beginning of a slightly different market.
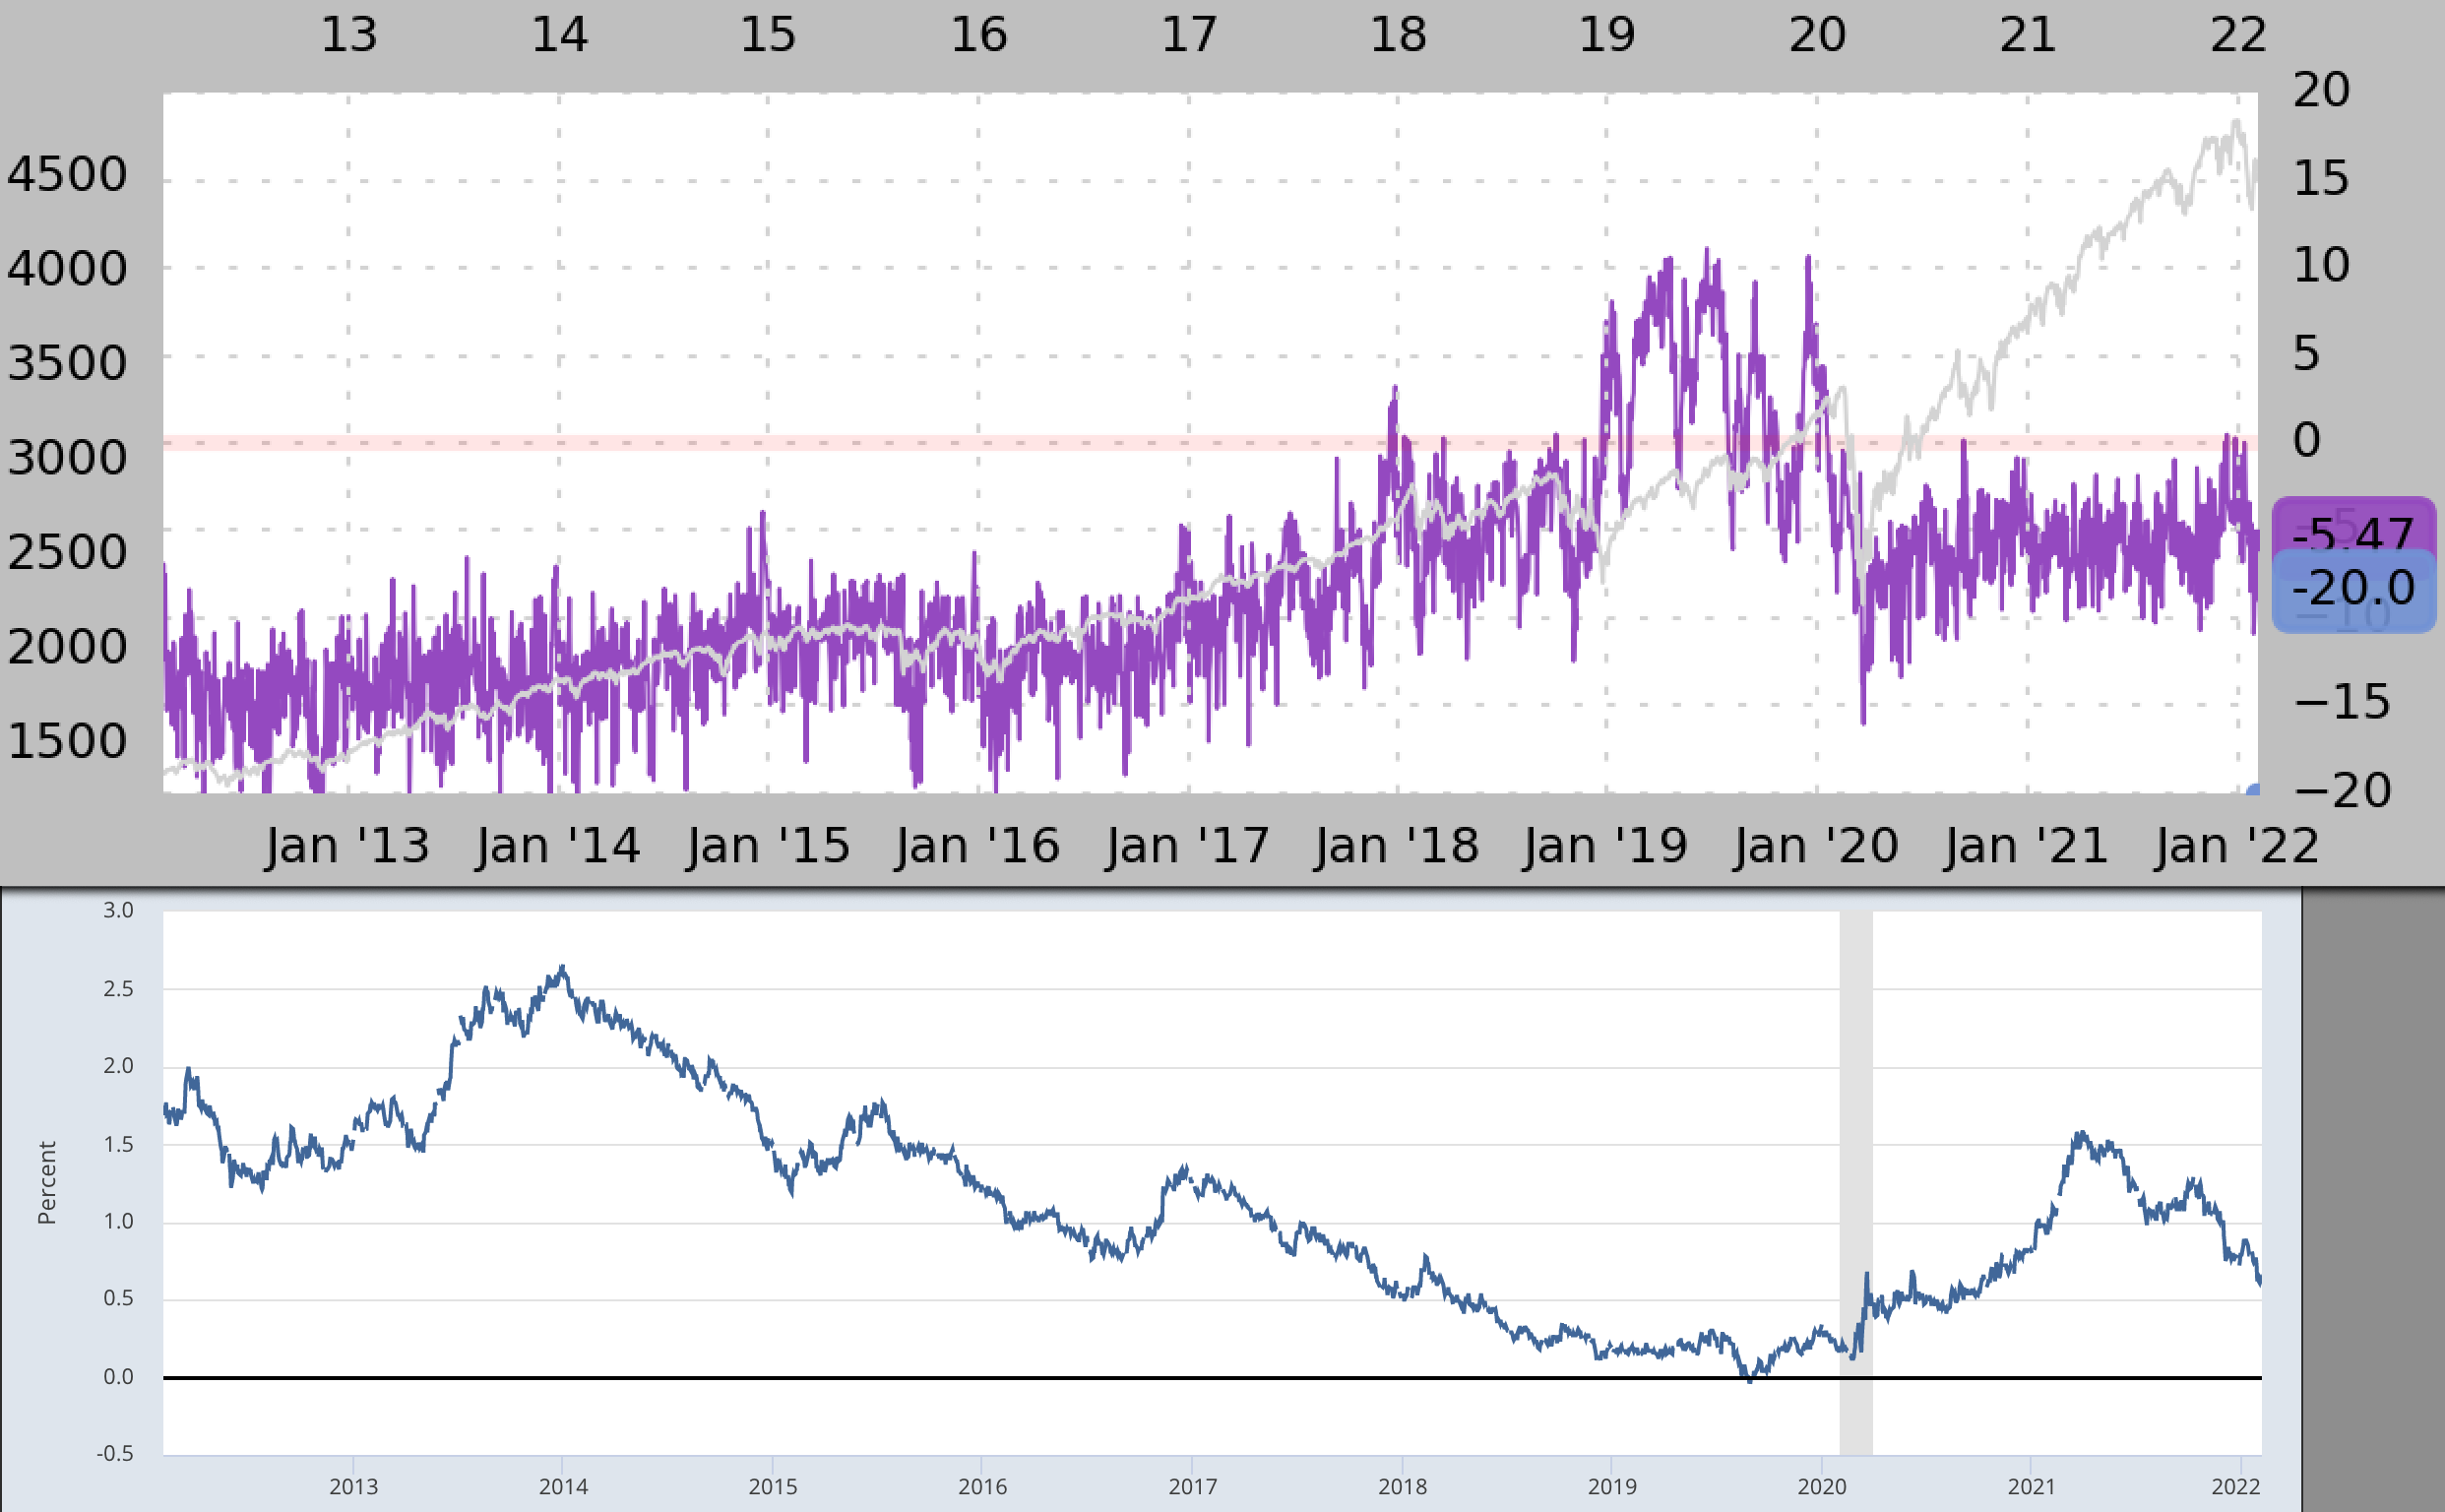
And to pay just a bit of homage to those clever people who talk about interest rates and yield curves, we stuck these two plots next to each other:
Above is Net Put Delta (NPD); below is the infamous 10-2 Treasury yield spread.
It is not difficult to imagine that they are, and ought to be, related. Put-selling (NPD > 0) is a carry trade, and net put-selling across the S&P 500 is a sign of desperation among market participants—which seems likely to coincide with a drought in carry trades elsewhere (like, e.g., in "riding the yield curve").
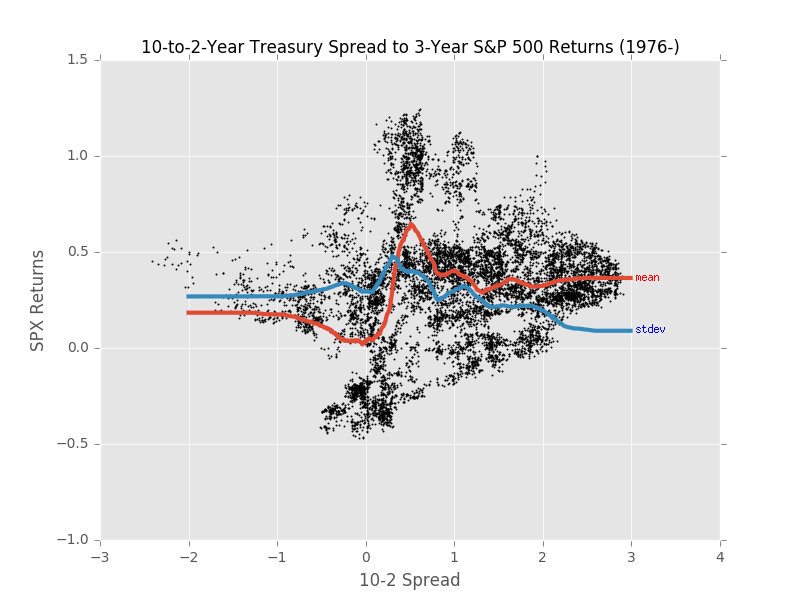
And while we haven't done fixed-income or rates analysis of any kind, we are still quite fond of this plot below (though a statistician would argue the overlapping periods are too long), because it tells a pretty clear story about SPX volatility and the 10-2 spread.
So, with recent moves in short-term rates, and with the threat of the Unknown with respect to inflation and central bank policy, it seems like we're going to stay in Limbo with respect to the broader "carry trade regime," and that—as a corollary—NPD probably isn't going to go full-blown put-buying. Marginal investors have de-grossed instead of buying puts.
That probably means VIX stays mostly in the 20s, and SPX remains comfortably moving in broader swaths, and in directions that aren't Gently Up And to the Right. That also means that Jim's frequent input will be indispensible if we want to have success trading SPX.
And there's one other thing that it might mean: We'd have never even considered going down this rabbit hole before we had Robot Jim... but with the benefit of an elegant way to handle multidimensional data—should we consider feeding some rates and curves data to Jim and generating some weather maps?
Our plan for this year was to streamline the data pipeline, flesh out the S&P 500 Robot Jim data, and eventually do a bit of research on VXX while we get used to this new way of looking at data.
But should we squeeze some rates 'n bonds stuff in there? Maybe just a wee bit? (This is what we said before completely derailing our 2021 research schedule, too...)
We'll see.
In the meantime, enjoy the week!
The SqueezeMetrics Team