All the charts and data we refer to can be found on the Yacht Club page.
Hey everyone,
Let's try not to belabor the point that it's a "big week" coming up. Yes, CPI, and yes, February OpEx. Yes, we still intend to be long SPX puts through all of this.
Instead of talking at length about what everyone else is talking about, then, let's briefly talk about the way that they're talking about it—then let's get distracted by something else.
But first...
- Jim laughs
- Vanna rallies
- Single-name shenanigans
Jim laughs
As you know, Robot Jim has been telling us repeatedly that we do not have a directional edge on the 1-week timeframe. He's told us to wait.
Credit where credit is due: We started gently getting short (via end-of-February puts) two weeks ago, and then sized up as SPX topped 4160. And that hasn't turned out all that well so far.
But we still feel that our reasoning for the position is sound, and our strongly worded forecast from
last weekend, expecting some chop pointing flat or down, proved useful.
Regardless, anyone who's wishfully thinking that the S&P is in a bull market, for any reason, will get a rude awakening. 'Cause with the current composition of flows, it can't just keep drifting up. We're going to get some chop no matter what happens. Indeed, the higher-probability bet right now is simply to be long vol / gamma.
Long gamma indeed. Tuesday, Wednesday, and Thursday were paydirt, and the day-to-day direction of the index has been discernible in part by continuing to view the 0DTE dealer positioning. That's been enormously helpful.
So we're definitely doing better than we should, in light of snubbing the Robot, and all of our "Strategic" concerns about investors' portfolio composition and inflation expectations still stand.
Vanna rallies
There's a lot of excitement in the coming week. First, there's the Tuesday morning CPI print, then theres OpEx Friday. The first one threatens to shake up narratives, and the second threatens to shake up positioning.
There is a hyper-awareness around these events, so it's almost entirely pointless to think about "what the print will be" or "how much open interest there is." Everyone is thinking about that. It's much more interesting to pay attention to two other things: (1) flows and (2) justifications.
In terms of (1) flows, we see very clearly that investors are not hedged in SPX. The average NPD of the past five trading days is positive, meaning that puts are net sold (but barely). There is, for the most part, a fair market for SPX put delta; a buyer for every seller. This means folks are not hedged.
In terms of (2) justifications, the implied volatility of Tuesday's expiration is markedly higher than Monday's (2x, in fact), which seems to suggest that there's a great deal of event premium priced in. The implication, at least if you hadn't been directly observing those (1) flows, is that people are indeed hedged! And this is the narrative that we've seen overwhelmingly bandied about in the last few days. (This is not how event-risk pricing works, though.)
Thus, a rational-lite interpretation of the CPI print is that it will be absorbed readily by the equity market regardless of the outcome, as the market has hedged itself amply in preparation. Hot print? An orderly, expected selloff. Anything else? "Vanna rally." "Relief rally."
If there is anything worth understanding about this coming week, it's that this interpretation is wrong. This is what happens to event risk in a bull market, but it is not what happens in a bear market. The reason for a "vanna rally" is that when vols collapse post-event, the net long OTM puts held by customers quickly lose deltas, and dealers have to buy back those deltas (long SPX). In bull markets, this leads to sustained rallies, because in bull markets, people are very long stocks, and long puts/vol to hedge.
But right now, there is no mechanism for "event risk" to translate into "relief rally." Again, this is because of current (1) flows. So even if you get an in-line or cool CPI print, and the "un-flation" narrative is sustained, there will be no forced buyers.
In other words, there is no reward for being long SPX, or short VIX, into this week. There is no real risk-premium, only an imaginary risk premium. Let's not fall for that.
There's not much else worth mentioning. Data remains largely the same as it has for a couple weeks now. NPD hovering around zero encourages choppy markets and vol-of-vol (reason enough to own puts), and while a really high DIX means that people are desperately buying stocks, the data tells us this isn't really a good thing.
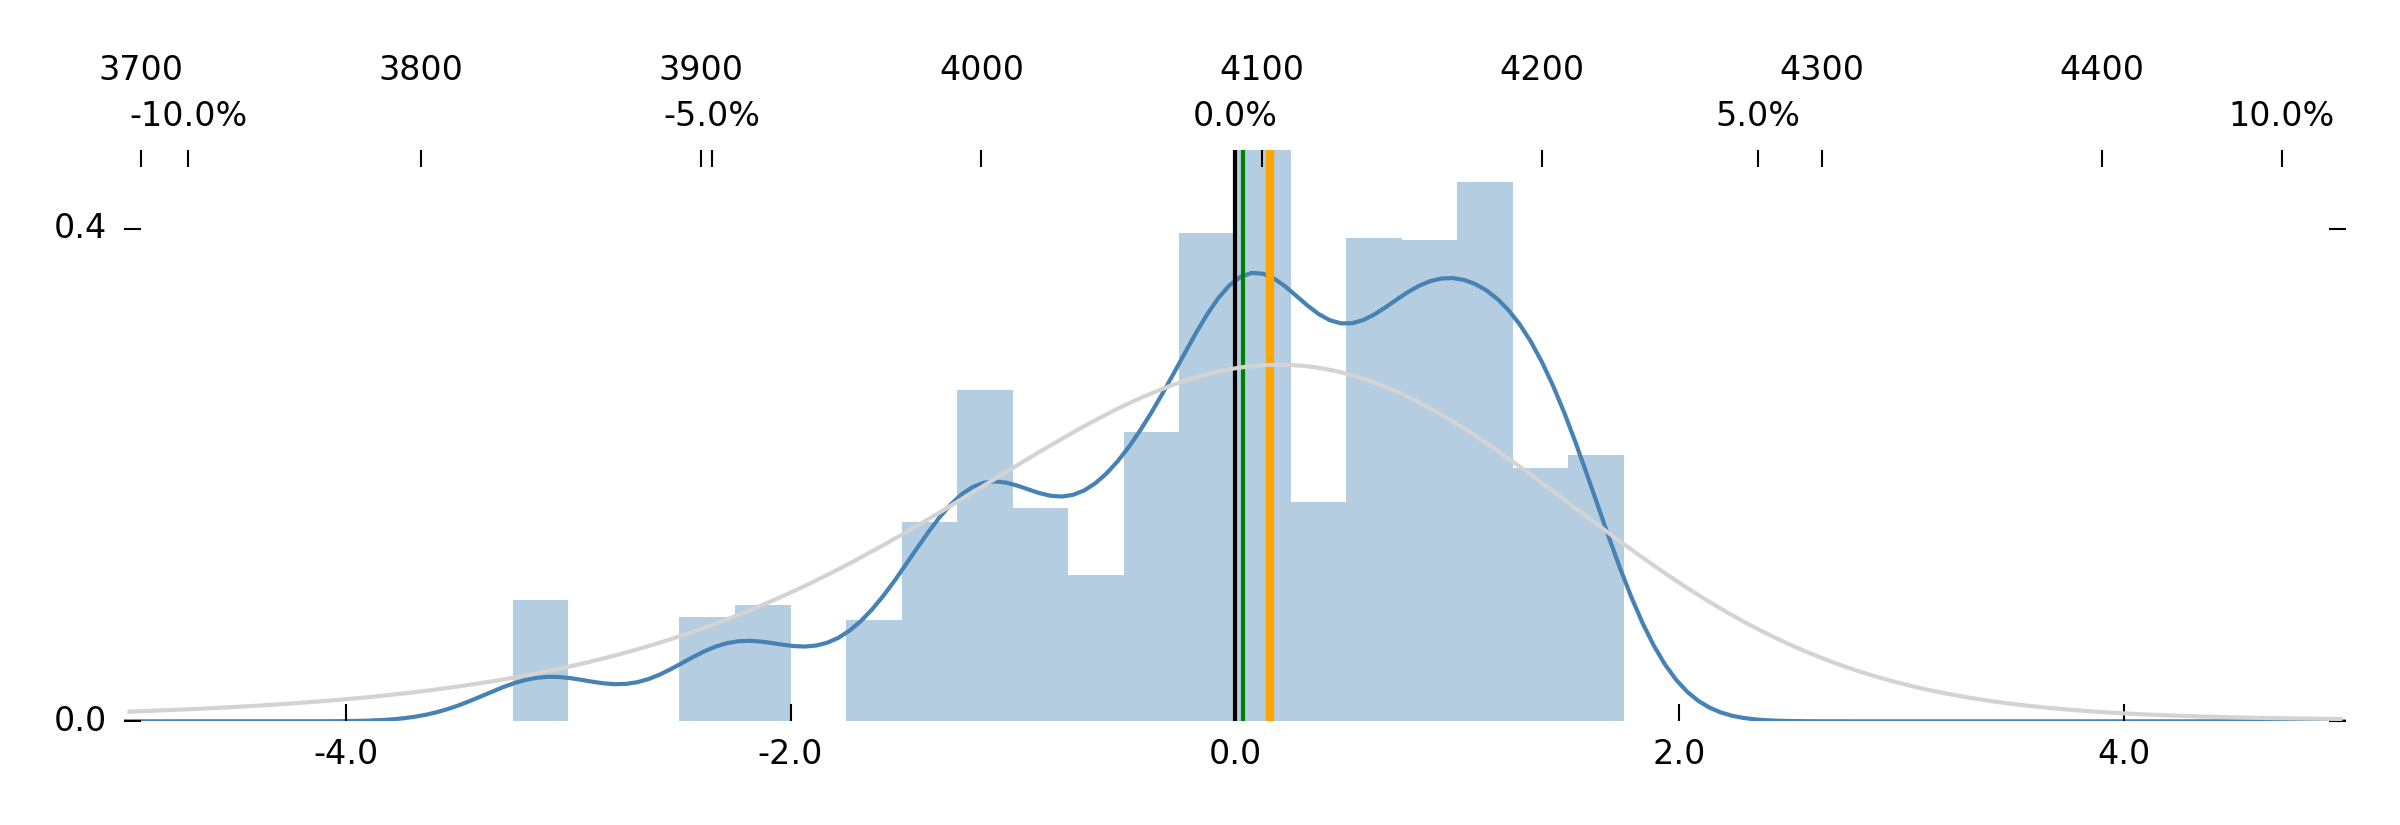
Jim, meanwhile, tells us much the same as he was before. I.e., we have no directional edge (mean [green] at 0).
However, note that he sees an advantage in betting that SPX rallies to around 4160 again—something that would be captured with a call spread (e.g., long 4050, short 4150).
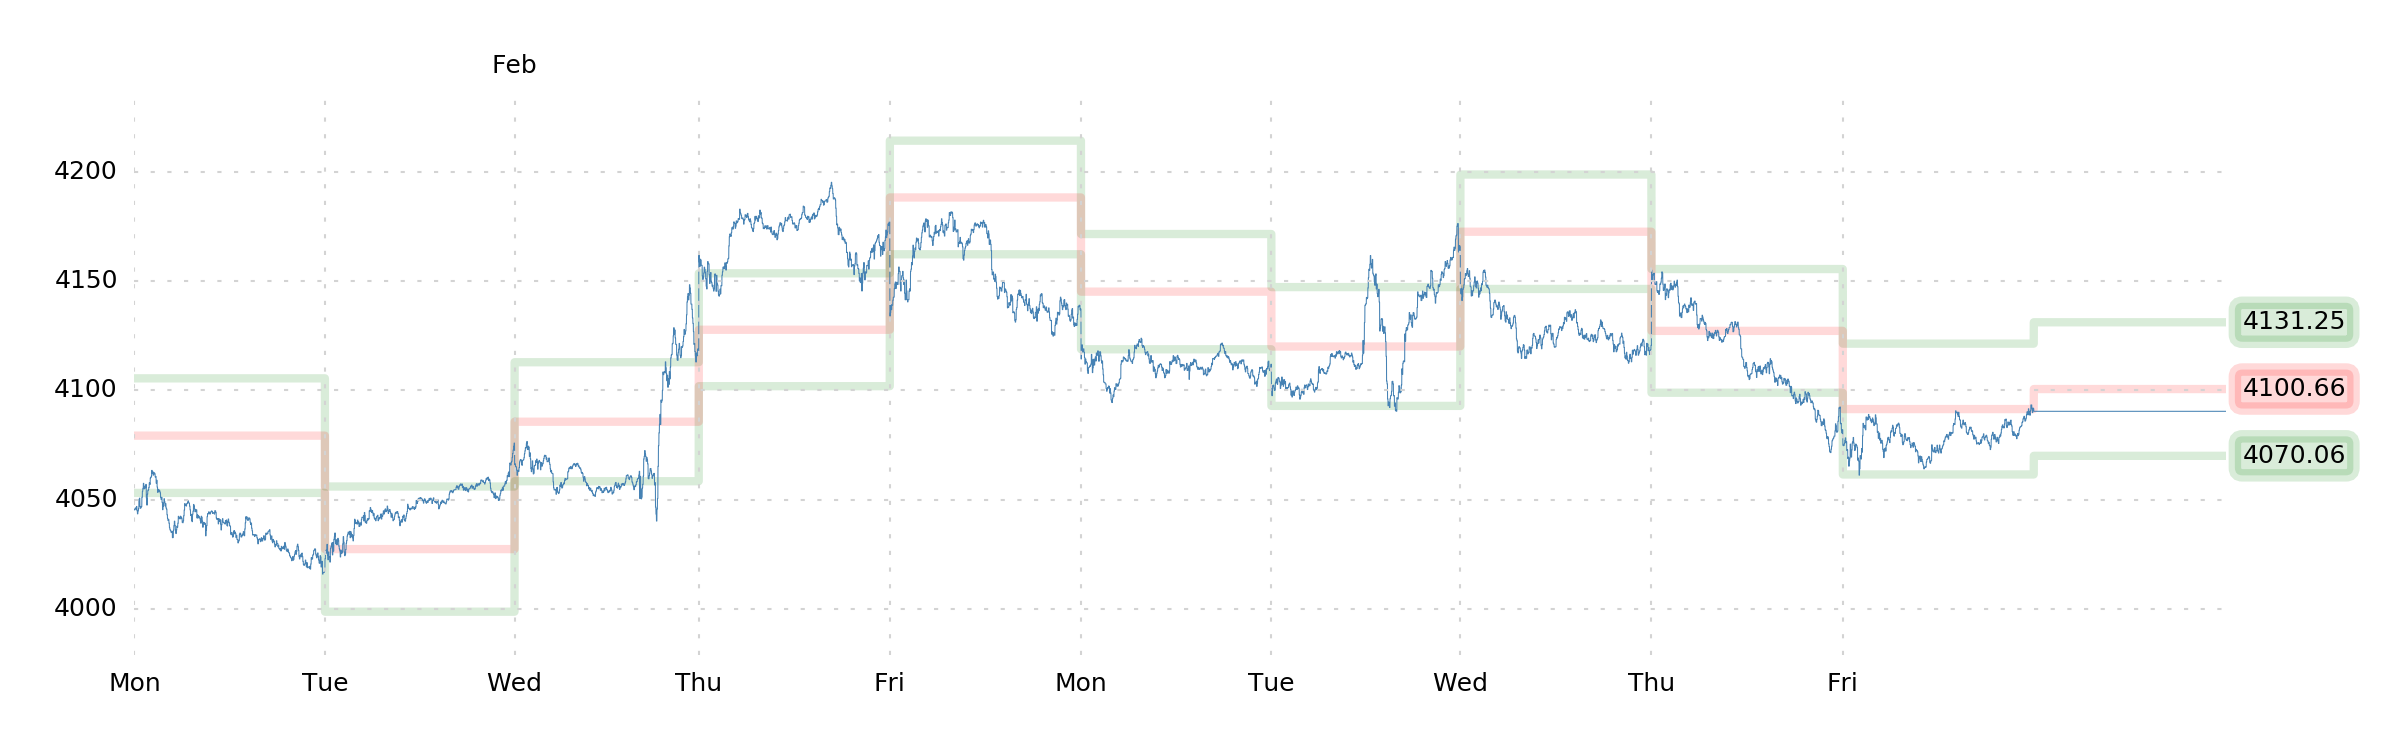
Net put sales on Friday lead once again to a 0DTE dealer situation where dealers are compelled to sell on the way up. Since most of that selling is concentrated above the Momentum band, though, the effects won't likely be felt much. Like Friday, we might expect Monday to be the quiet type of day where you can buy at Support and sell/short at Mid. SuMo bands work very nicely on quiet days.
And now for something completely different.
Single-name shenanigans
Let's distract ourselves with a brief foray into single-name option flows.
We've been watching closely as a single day of SPX net put sales, or net put buys, turns into a next-day net-bearish or net-bullish scenario (respectively). The immediacy of this feedback is new, due to the prominence of 0–5DTE options, but the idea is not new at all.
One of the big insights of SPX Net Put Delta (NPD) is that when people are getting short delta in options (buying puts), that's deferring a future, conditional limit-buy order. This is why, when NPD is, e.g., -10 and people are substantially net short SPX delta through puts, the index tends to go up over the following days, weeks, and months. And vice-versa (positive NPD is late bull or beary, zero NPD is beary).
Is the same true of single-name options?
Honestly, we don't have enough data to say, and we don't believe that there is enough data to say. (And by the time there's enough data to say conclusively, the insight probably won't be worth much.) So let's just guess that the same thing is true of single-name options, especially (or exclusively) in cases where we're talking about big, liquid names with lots of options traded.
During the past week of trading, we started collecting and aggregating data for the top 15 NMS tickers by volume, and assessing the direction of option trades simply by logging whether a transaction occurred at-bid or at-ask. This is a pretty effective method in the case of a stock/ETF with multiple exchange venues competing for liquidity, lots of index correlations, and a really tight spread—and it's also very easy to do (relative to some of the other methods to assess trade direction).
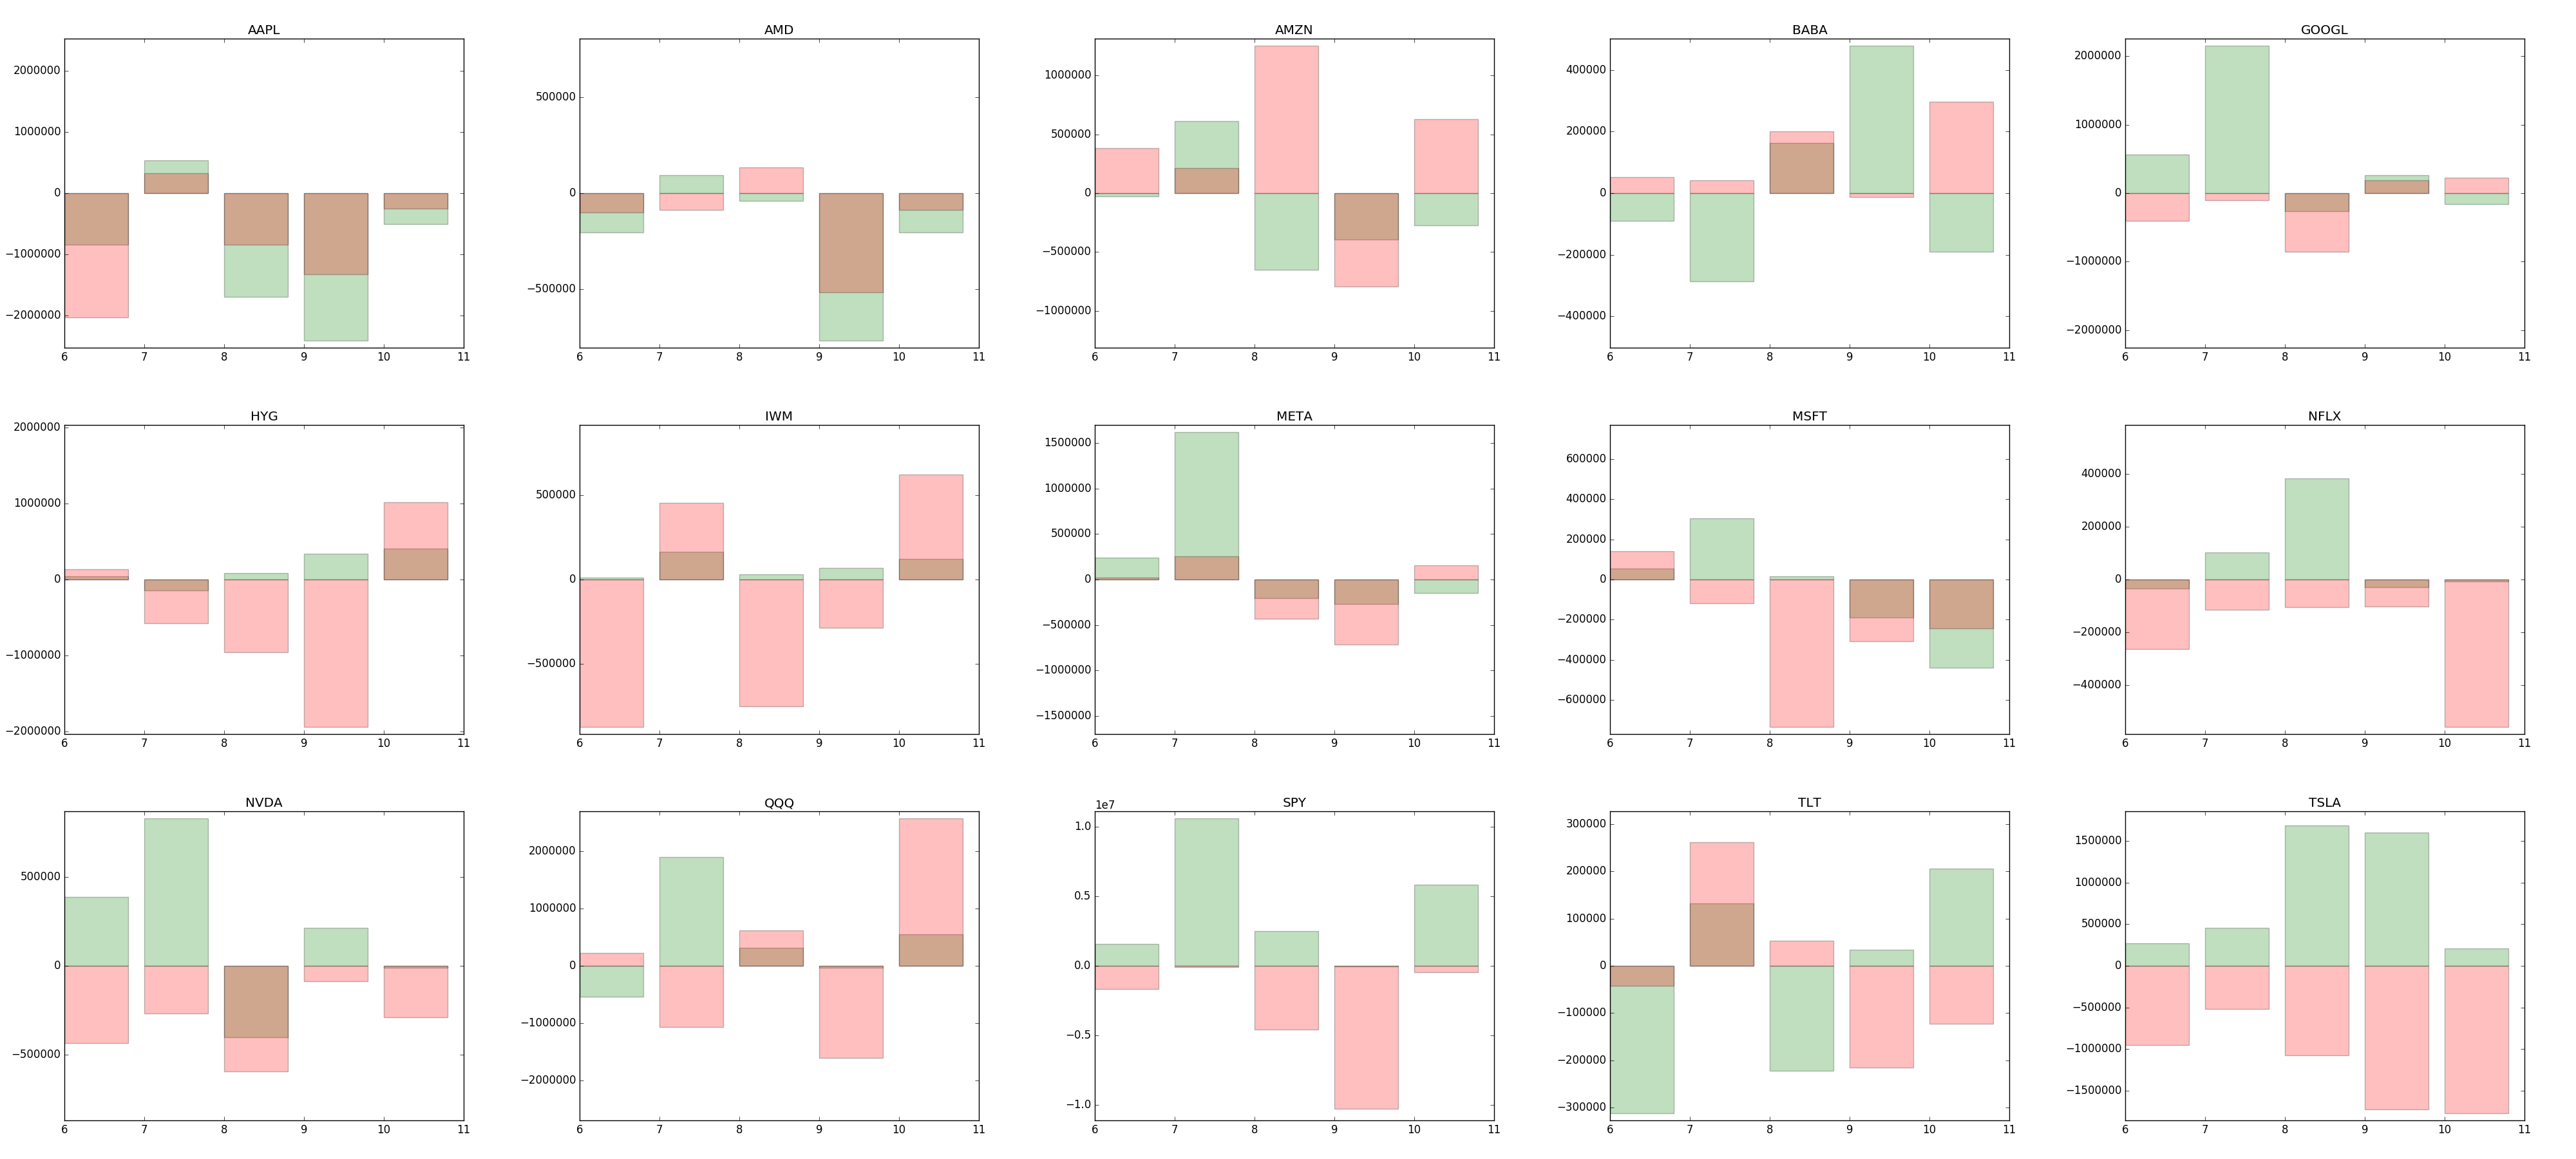
And though we won't try too hard to tear insights from such a small amount of data, it's still very interesting to see, and ponder. The image below is 4000px wide, so click on it to zoom in.
These are option flows broken down by day, into bars. Green is call volume, red is put volume. Positive on the y-axis means "long delta," and negative means "short delta." Dates from this past week are on the x-axis.
Y-axis is denominated in shares, so, e.g., AAPL (top-left) had net short call and put delta on the 6th (red bar negative, green bar also negative) equivalent to around 3,000,000 sold shares. That means customers sold calls and bought puts on the 6th. Defensive positioning. A collar. A bullish thing, probably.
So if you look through all these charts, you broadly get a sense of whether deltas were net bought or sold just by seeing whether the bulk of the data is toward the top of the chart, or the bottom. In the case of AAPL, we see data cluster toward the bottom, which means net short deltas. In the case of QQQ (bottom, second from left), we see more long deltas. E.g., that tall red bar indicates that a lot of folks sold QQQ puts on Friday.
Now of course, the most fun is to be found in TSLA (bottom-right). Note that all the green bars are positive, and all the red bars are negative. That means that both calls and puts are net bought by customers in TSLA. That's pretty funny, because it's exactly what you'd expect. But also, note that Friday featured net short delta in TSLA (lots of puts bought [negative red bar], but not lots of calls bought [weak positive green bar]).
In theory, this means that Monday should be, ceteris paribus, bullish for TSLA. Why? Because people bought puts, and those puts will decay, and the decay of those puts will cause dealers to buy back their short TSLA hedge. So will TSLA outperform its market beta on Monday?
Is this the way things work in single-names? No idea. Makes sense, though.
Long AAPL / short AMZN? Long TSLA or NFLX? Short BABA?
Food for thought, if nothing else. Welcoming your thoughts as we wait for Tuesday's chaos.
Enjoy the week.
The SqueezeMetrics Team