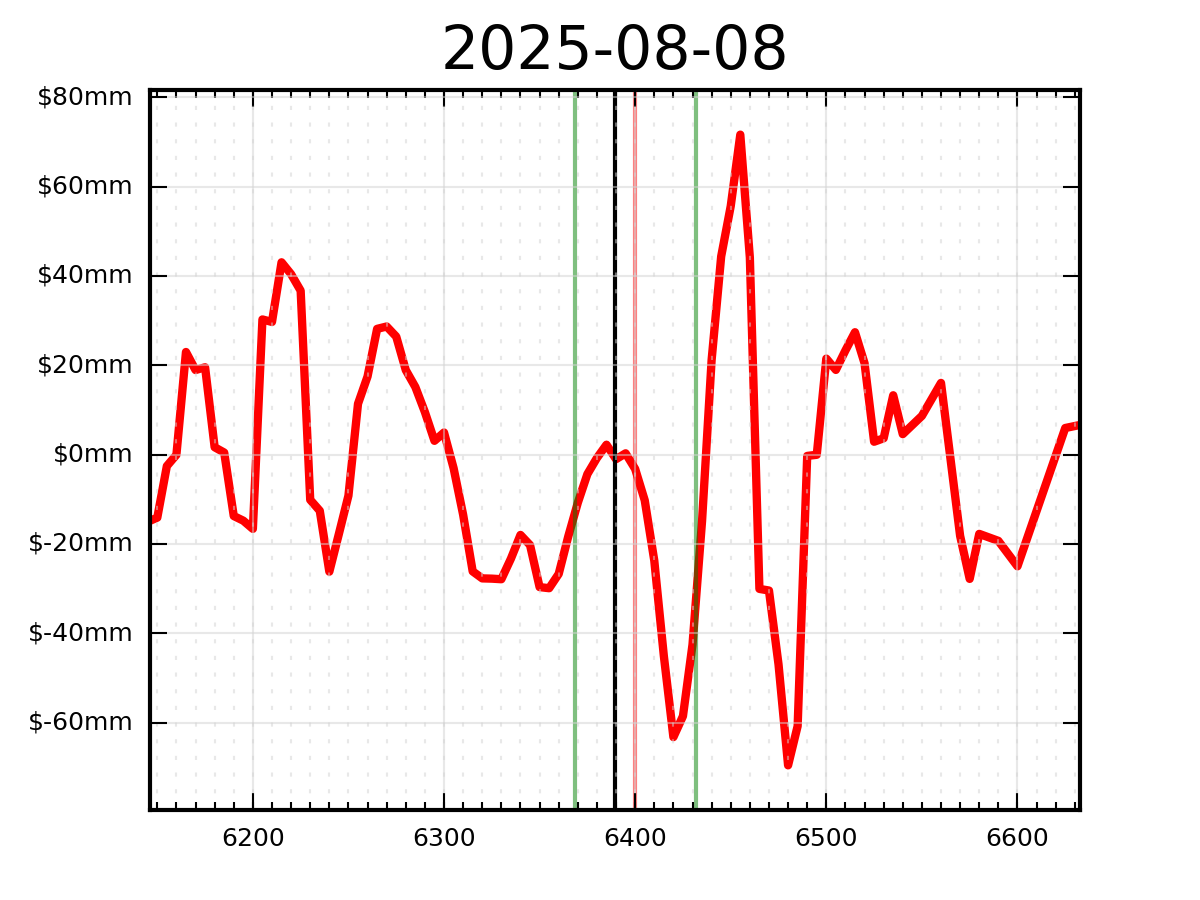
All the charts and data we refer to can be found on the Yacht Club page.
Hey everyone,
We've spent most of this year trying to work on just a couple things and, despite focusing on them, and working fairly diligently, we had a hard time making those things work. Accomplishing nothing.
After getting the new Chart working (two weeks of very productive work), we have ideas for a gazillion things to to work on—the floodgates have opened—but we're flying from one idea to another, scatterbrained and aimless. Accomplishing nothing (but for different reasons).
It's kind of funny the way that works.
Anyhow—last weekend, we said that this is what we want to do next:
What we'd like to do next—with some of this stuff more clearly established—is to streamline the spreadsheet data itself.
Before getting distracted this week (and testing out some silly new ideas for liquidity indicators and whatnot), we got only partway to this goal. The essence of what we want to do is, since there's a functioning "See-It-Yourself" tool in the Chart (which gives you r-values and all sorts of stuff), the API and Spreadsheets can lean more toward "Do-It-Yourself."
In other words, we'd like to give you folks less model output, and more model input. No more black-box "mean, median, vol" stuff coming from our internal k-d tree methods, but instead, better-defined raw indicators with consistent and useful normalization so that you can plug things into your own models with minimal fuss (instead of backtesting using the outputs of our messy time- and distance-weighted nearest-neighbor algorithm).
Does this make sense?
We'd also (and this is precisely where we got distracted) like to keep things open in the future for new indicators, and we want to keep things "extensible" and consistent. To that end, we need a normalization method for indicators like implied volatility that will also work with other stuff. Z-scoring? Trigonometric functions? Both? It's actually amazing how much time you can spend thinking about how to properly "smooth" a variable. And then how much is too much? (See: GARCH models.)
But let's hold ourselves accountable for getting this done. For next weekend:
- New API data and spreadsheets. Smaller-size files, fewer columns. Raw and consistently normalized indicators (with math and code to show you how it's done). More power-per-column!
- Some updates to the Chart (which needs to be retrofitted to the new API format).
By the way—speaking of the Chart—has anyone been long AAPL? We kind of want to brag about this one since we mentioned it before and it kept showing up as even more bullish the lower it went (and we kept adding).
(Ok, fine, can we acknowledge that this was 95% blind luck and then brag about it?)
Anyway—we also said we'd talk about bonds and macro stuff this weekend, because we need to update our ideas about rates and inflation and what to bet on, because we may finally be starting a rate-cutting cycle. So let's talk.
But first...
- RISC-on
- *shrug*
- Long tools
RISC-on
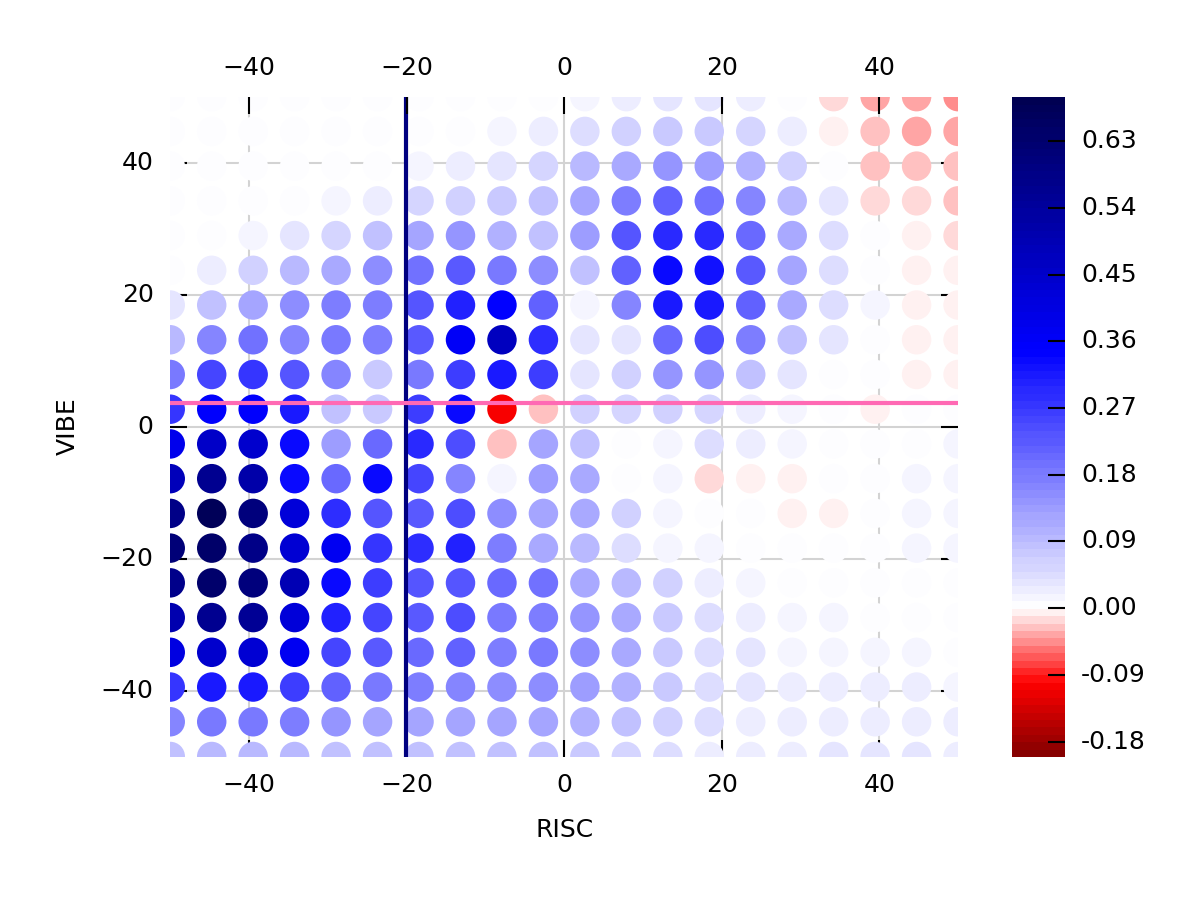
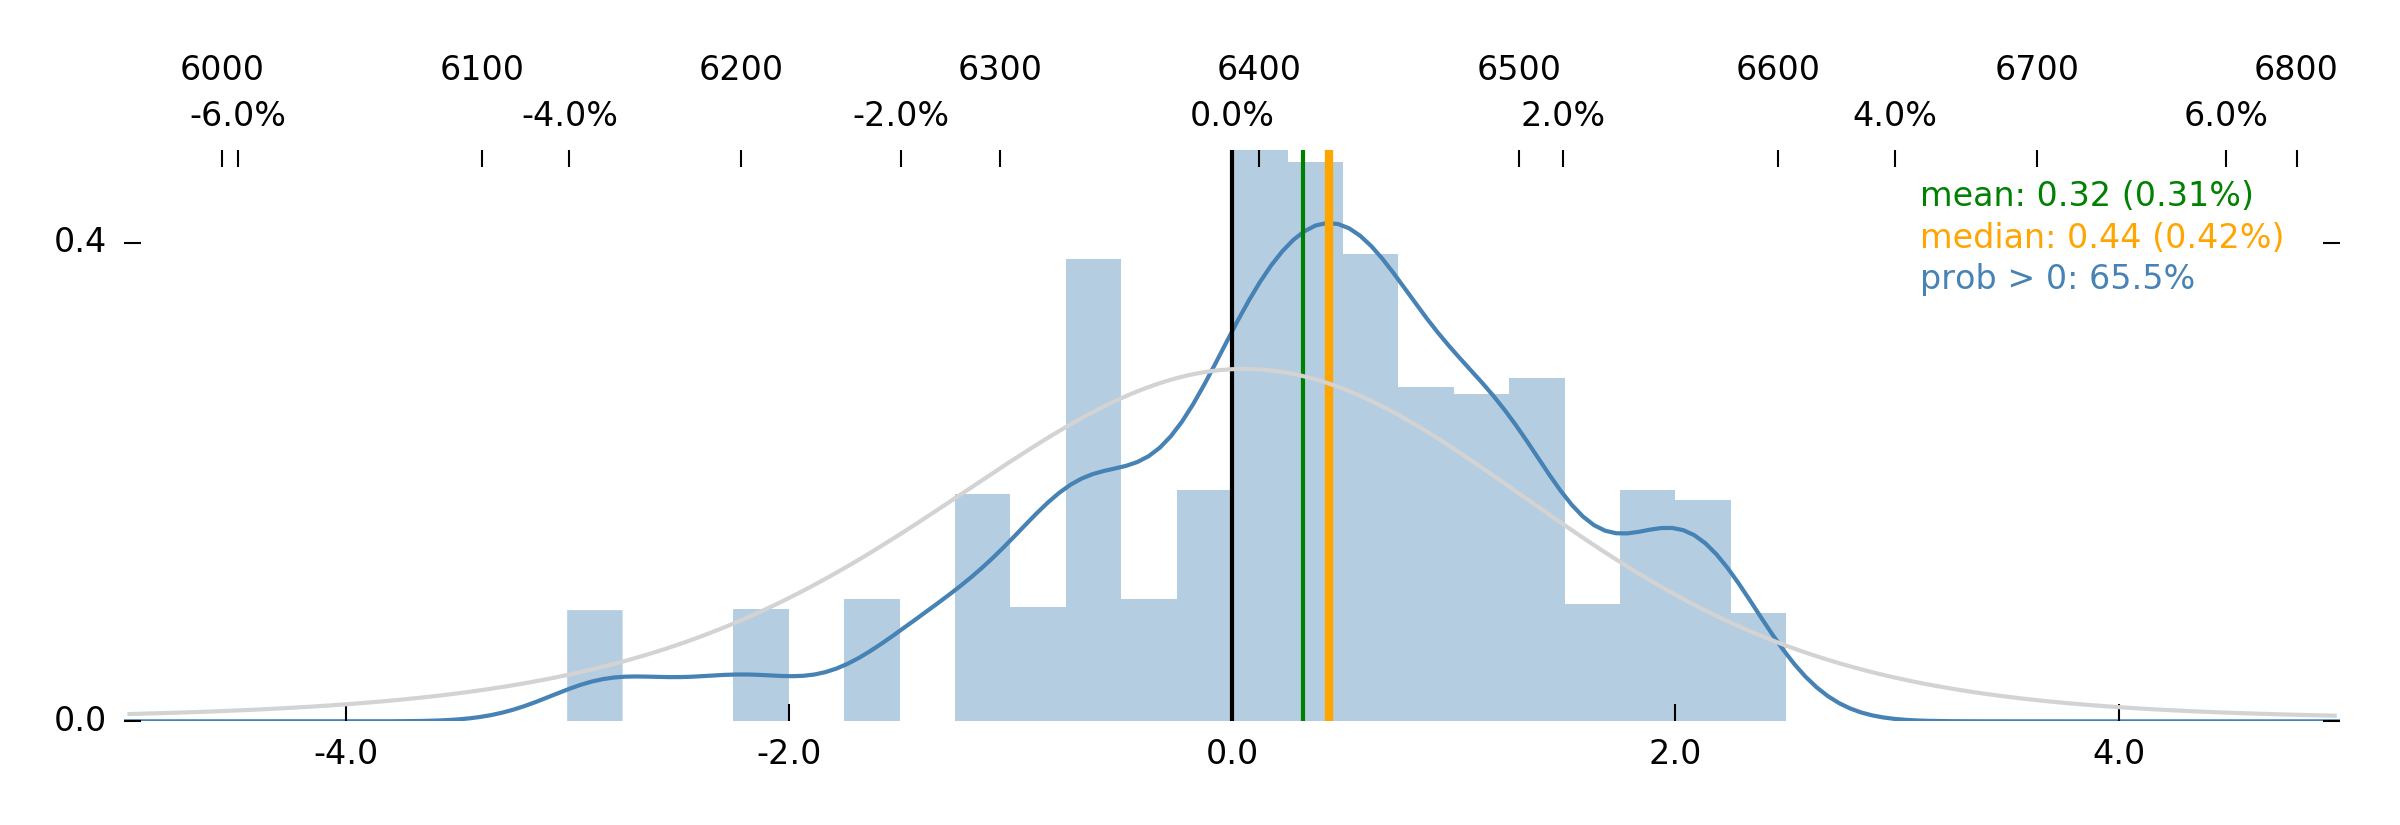
We said we'd get out of our stock short by the end of the week, since RISC was too low (which strongly predicts positive 1-month returns). We bought back our short pretty quickly as SPX started rising—and we're happy we did.
Index was up a good 2.50% on the week.
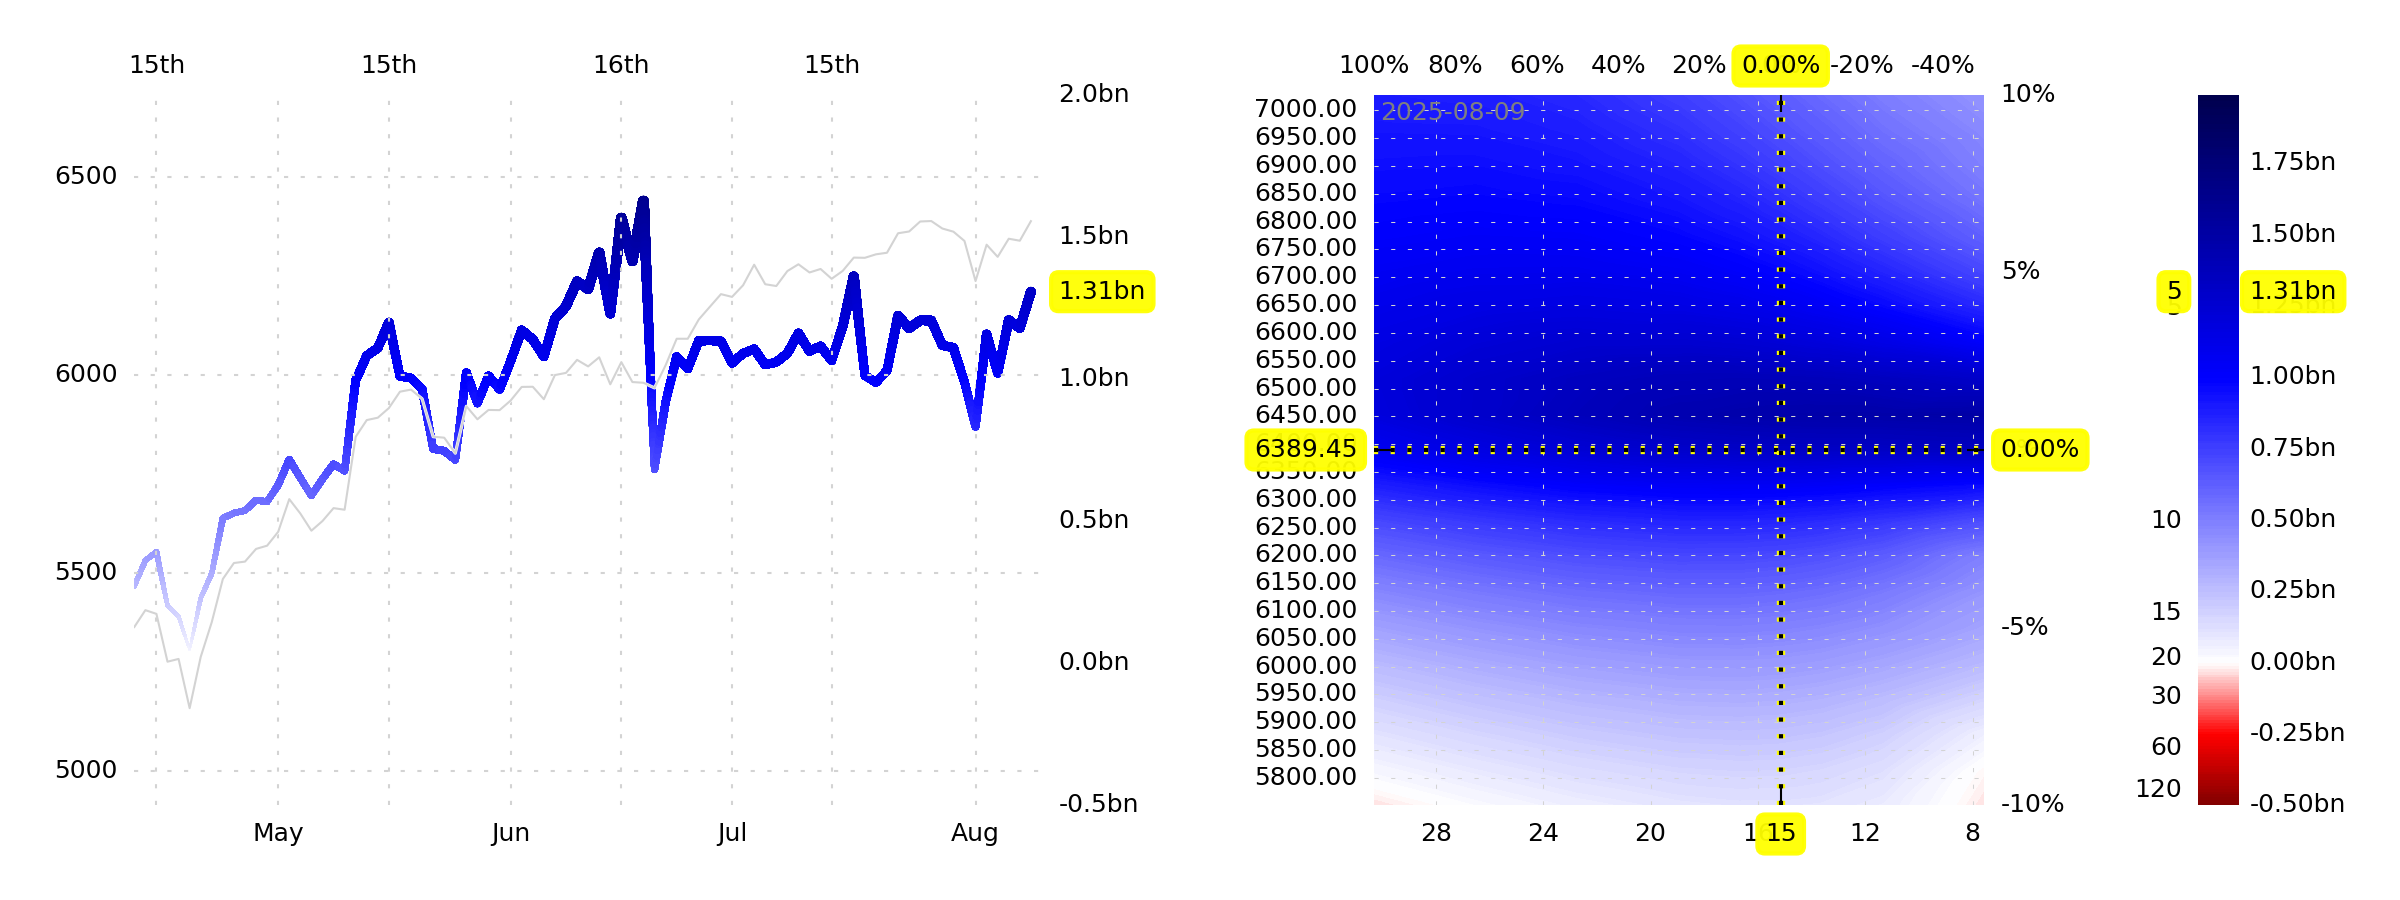
Which means we are now a fair distance away from the deep-blue area of low-RISC, where we can now reconsider what's going on. Where does this leave us? Are we now poised for the market to actually respond to that gnarly BLS employment data, without butting up against the practical concerns of [high] option prices, like this past week?
*shrug*
Nah.
Jim's modestly bullish.
GEX+ is now pretty high again, and trending up, with region of even deeper blue above spot.
It's bullish stuff, overall. Summery, high-liquidity stuff.
With that said, we're not planning on taking any new positions, but rather, going with the flow in the short term. Last week, we did very well following the 0DTE dealer re-hedging data, and we're hoping to keep that up.
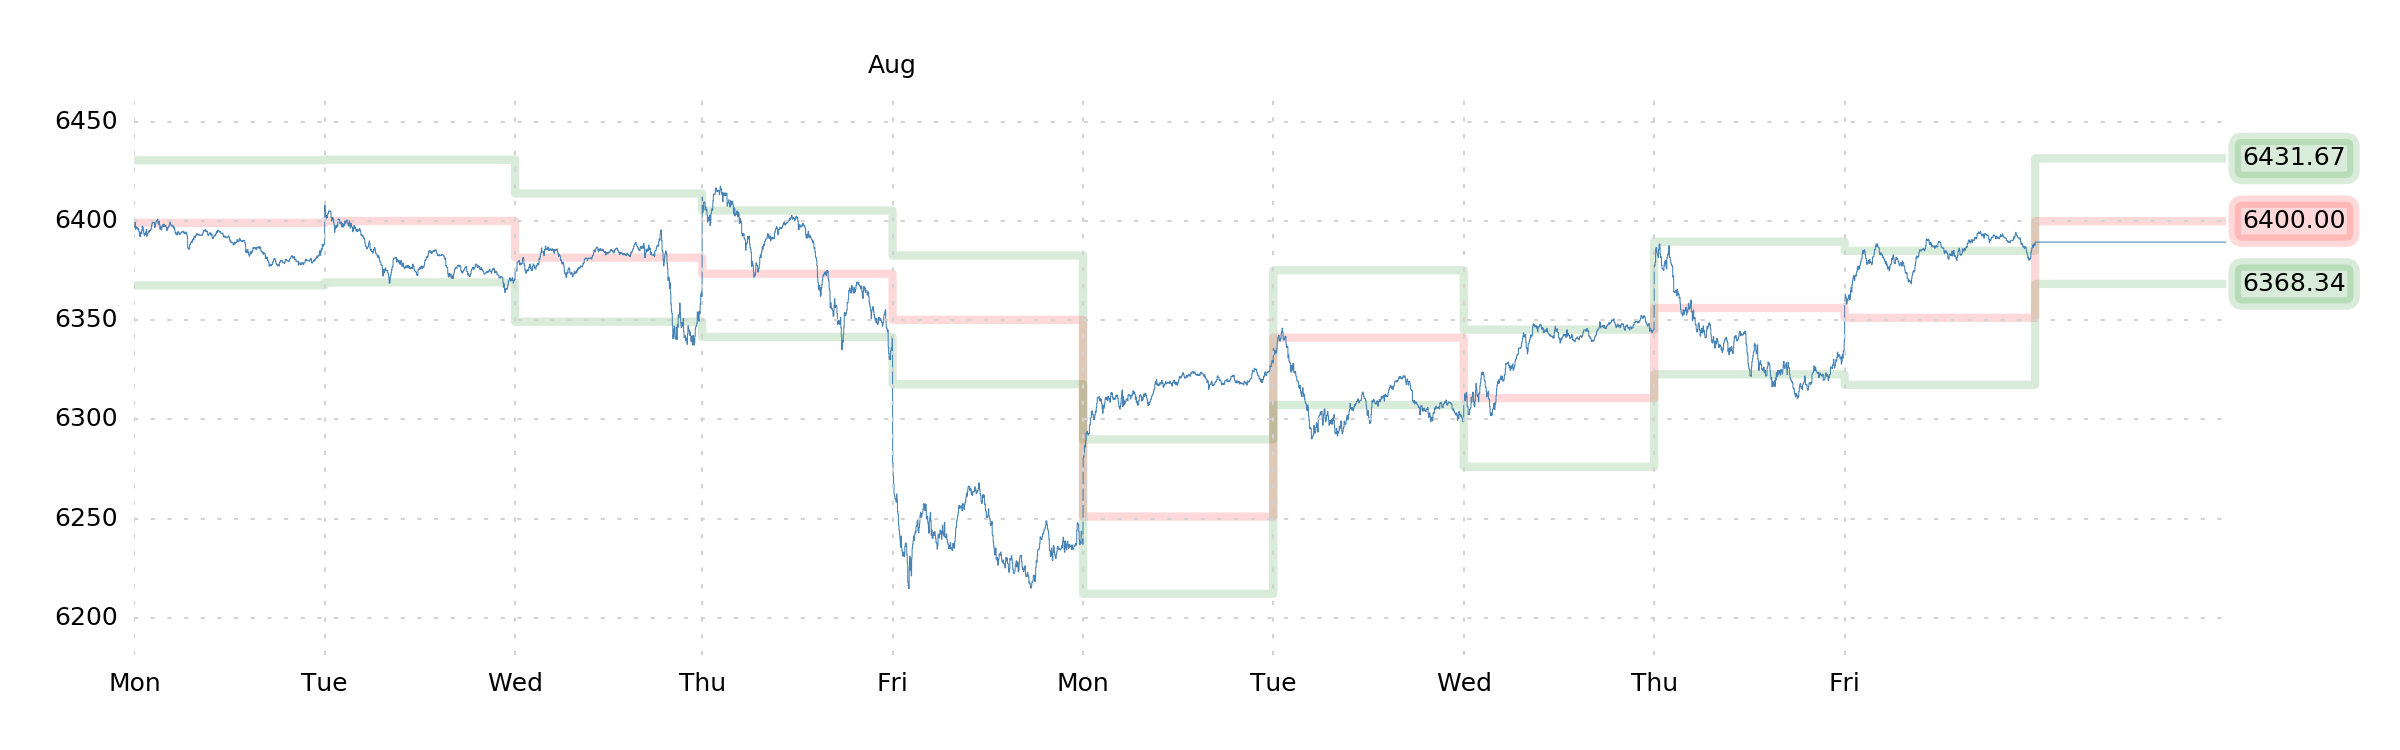
Monday looks like another fun one, with considerable selling pressure up to 6420, but then gobs of buying above that. This lends itself very nicely to some intraday E-mini trading, and that's what you'll find us doing.
And that's all you'll find us doing.
Except that we'll also be thinking about tools.
Long tools
So, overall, we think we did a pretty OK job timing "the inflation bet," in that we didn't lose a ton of money chasing bonds lower. Ever since 2022, we wanted to get long bonds, but we waited. And waited. And waited. Only in March and April of this year did we finally think that inflation wasn't going to keep ticking up and drowning the long bond—and when that finally lined up with some good data (CoT, momentum, commodities)—we took the bet.
Our instinct to bet on mean-reversion hardly ever works in our favor... and this was no exception. TLT is down around 2.00% from our buy-in. We've sat here and languished in the trade for five months.
Can we take our mean-reversion mentality, turn it on its head, and just go with the flow instead?
What we'd like to is split our "disinflation" bet into two components:
- long Goods-inflation
- short Services-inflation
Really novel idea, right? Very fresh, unique. No!
We're going with the flow here, folks.
Tools are too cheap; the people who wield them are too expensive.
That's the thesis. It's not complex. Anti-immigration policy feeds into this (lowest-paid jobs going unfilled). The rise of AI feeds into this (arbitrarily high-paid jobs getting cut). The decline of other software and the jockeys of those software suites feeds into this. Lower college attendance for males, lower white-collar opportunity, the death of the "Computer-Science-to-polite-society" pipeline—all of it!
And of course, this whole thesis immediately leads to the "robot" theme, which we would already scoff at as a silly trope—but this scoffing is our weakness. Just because we're jaded doesn't mean other people think that way. There's a long way to go in the robotics industry, and we need to hold our noses and buy some of this stuff before the proletariat thinks too hard about it.
Tools-are-too-cheap. Long toolmakers? SNA? SWK?
People-are-too-expensive. Short fee-for-time people-shops? INFY? CTSH?
Robots themselves? SERV, SYM, TER, CGNX?
Not a lot of thought went into those tickers, but you get the idea. It's just a way to lean. A way to think. And if you're like us, another "way to think" about it is that this is more of a big-picture mean-reversion than a momentum trade. The cost of unskilled white-collar labor (and blue-collar) is too high relative to the cost of capital. It's normalizing.
So as of this week, you'll find us dropping the bond trade—a stand-in for disinflation—and picking up things that reflect a more focused bet on what prices will be going on down, and what ones will be getting buoyed up. And importantly, it's a simpler, stupider bet. Or, perhaps, just a less arrogant bet? No... maybe not.
In any case, think about it. And enjoy the week!
The SqueezeMetrics Team