All the charts and data we refer to can be found on the Yacht Club page.
Hey everyone,
Last weekend, we talked about how we were mostly wrong about the market, but somehow we didn't lose money. This weekend, we will talk about we were mostly wrong again, and this time, we finally paid for it.
- Cosmic Justice for Me
- Cosmic Justice for Thee
- Bore-relations
Cosmic Justice for Me
Here's how we were describing our outlook:
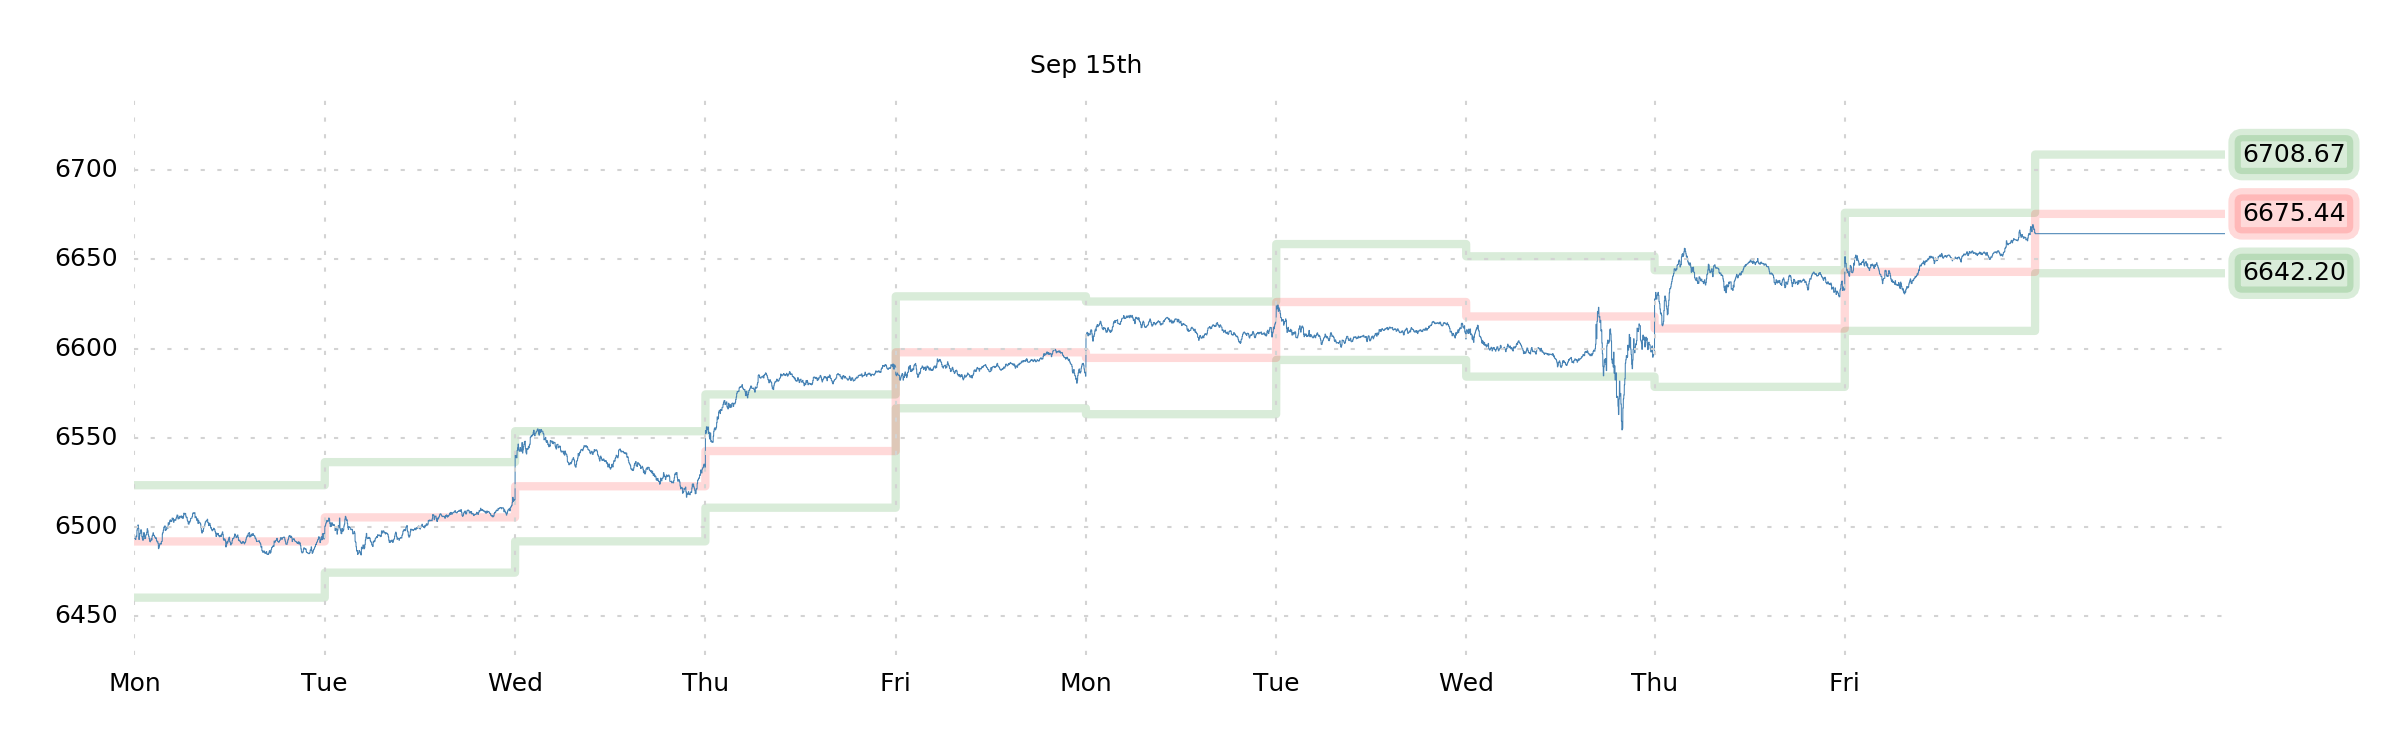
Our theory for the week was that the RISC/VIBE data (low SPX risk premium) and the beginning of AI-unbubbling (sentiment shift) and the approaching OpEx (frontrunnable, lower liquidity incoming) and the FOMC rate decision (buy-rumor-sell-news) would all make for an opportunity, by week-end, for modest downside ("modest" because extant inflation fears maintain some equity bid). Our put spread would have a max profit at 6500, so we were looking for something like a 1.25% drop. A little breather.
This... didn't seem unreasonable. But as it happened, the RISC/VIBE data didn't hold anything down and people are still trying to juice the AI trade and nobody frontran the OpEx and nobody really cared about the garbled FOMC messaging and so our put spread expired at $0.
But it's actually worse than just a losing put spread, because last weekend we talked about buying a put in CoreWeave (CRWV), and about how IWM should continue to outperform QQQ, and about how NVDA needs to un-bubble, and about how we like "tools" stocks (e.g., SWK), and about how Rocket Companies (RKT) should continue to trend—and this was a lousy week for all of that. CoreWeave went up (+3% from our entry), NVDA was approximately flat, IWM and QQQ performed about the same, Stanley Black & Decker went down a lot on Friday, and so did RKT.
So it was just a terrible awful no-good week. We were wrong, and this time, we didn't manage to escape with a green PnL.
Cosmic Justice for Thee
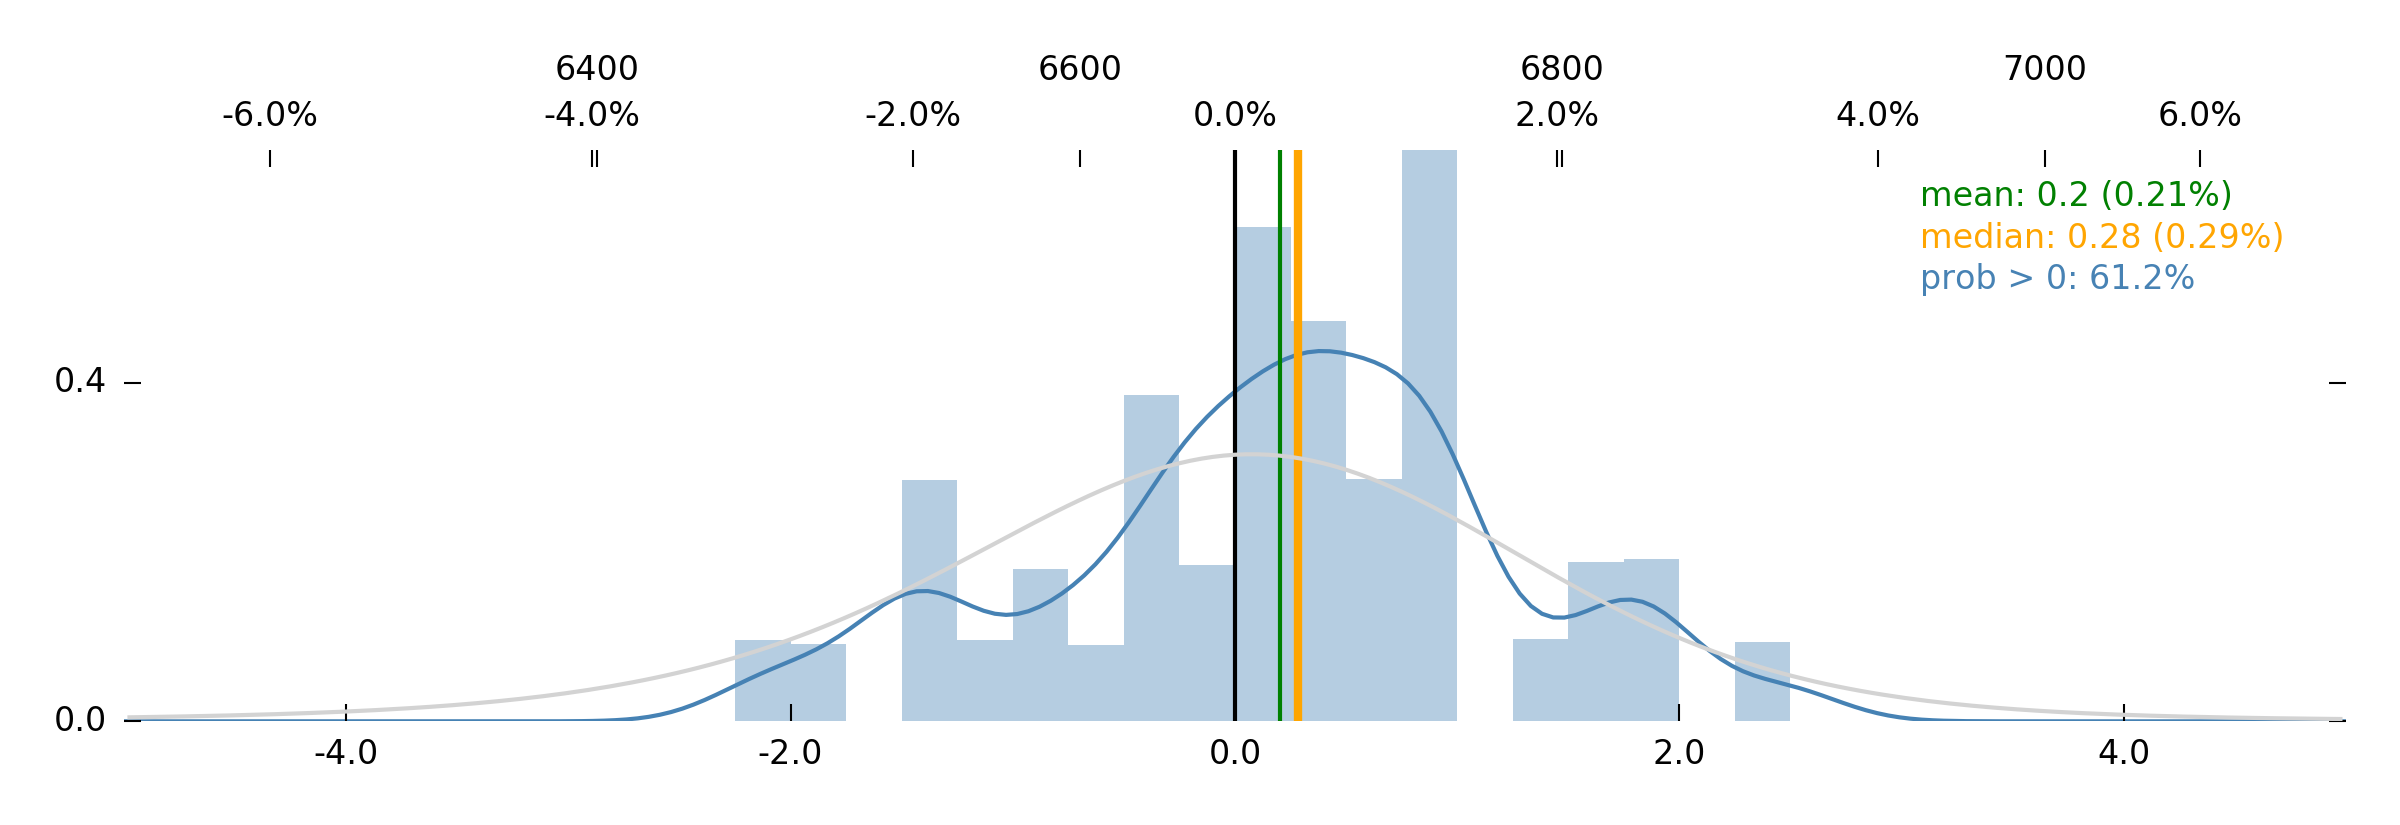
For the millionth time, we have to hand it to Robot Jim. He's been forecasting boring upside drift for the last two weeks, and he's been right. And so it would probably be in our best interest to look at his current forecast (above) and expect similarly boring, flat-to-up behavior.
Our only argument, and the argument that we've been making for over a month now (and not without some success, anyway), is that we're experiencing the end of the AI bubble, and there's a lot of bubble to deflate. This doesn't precipitate any "crash" behavior, but it encourages a rotation out of frothy semiconductors and AI-adjacent services (like CRWD), and into names that provide protection from more inflation (at least until a "more inflation" narrative is disproven).
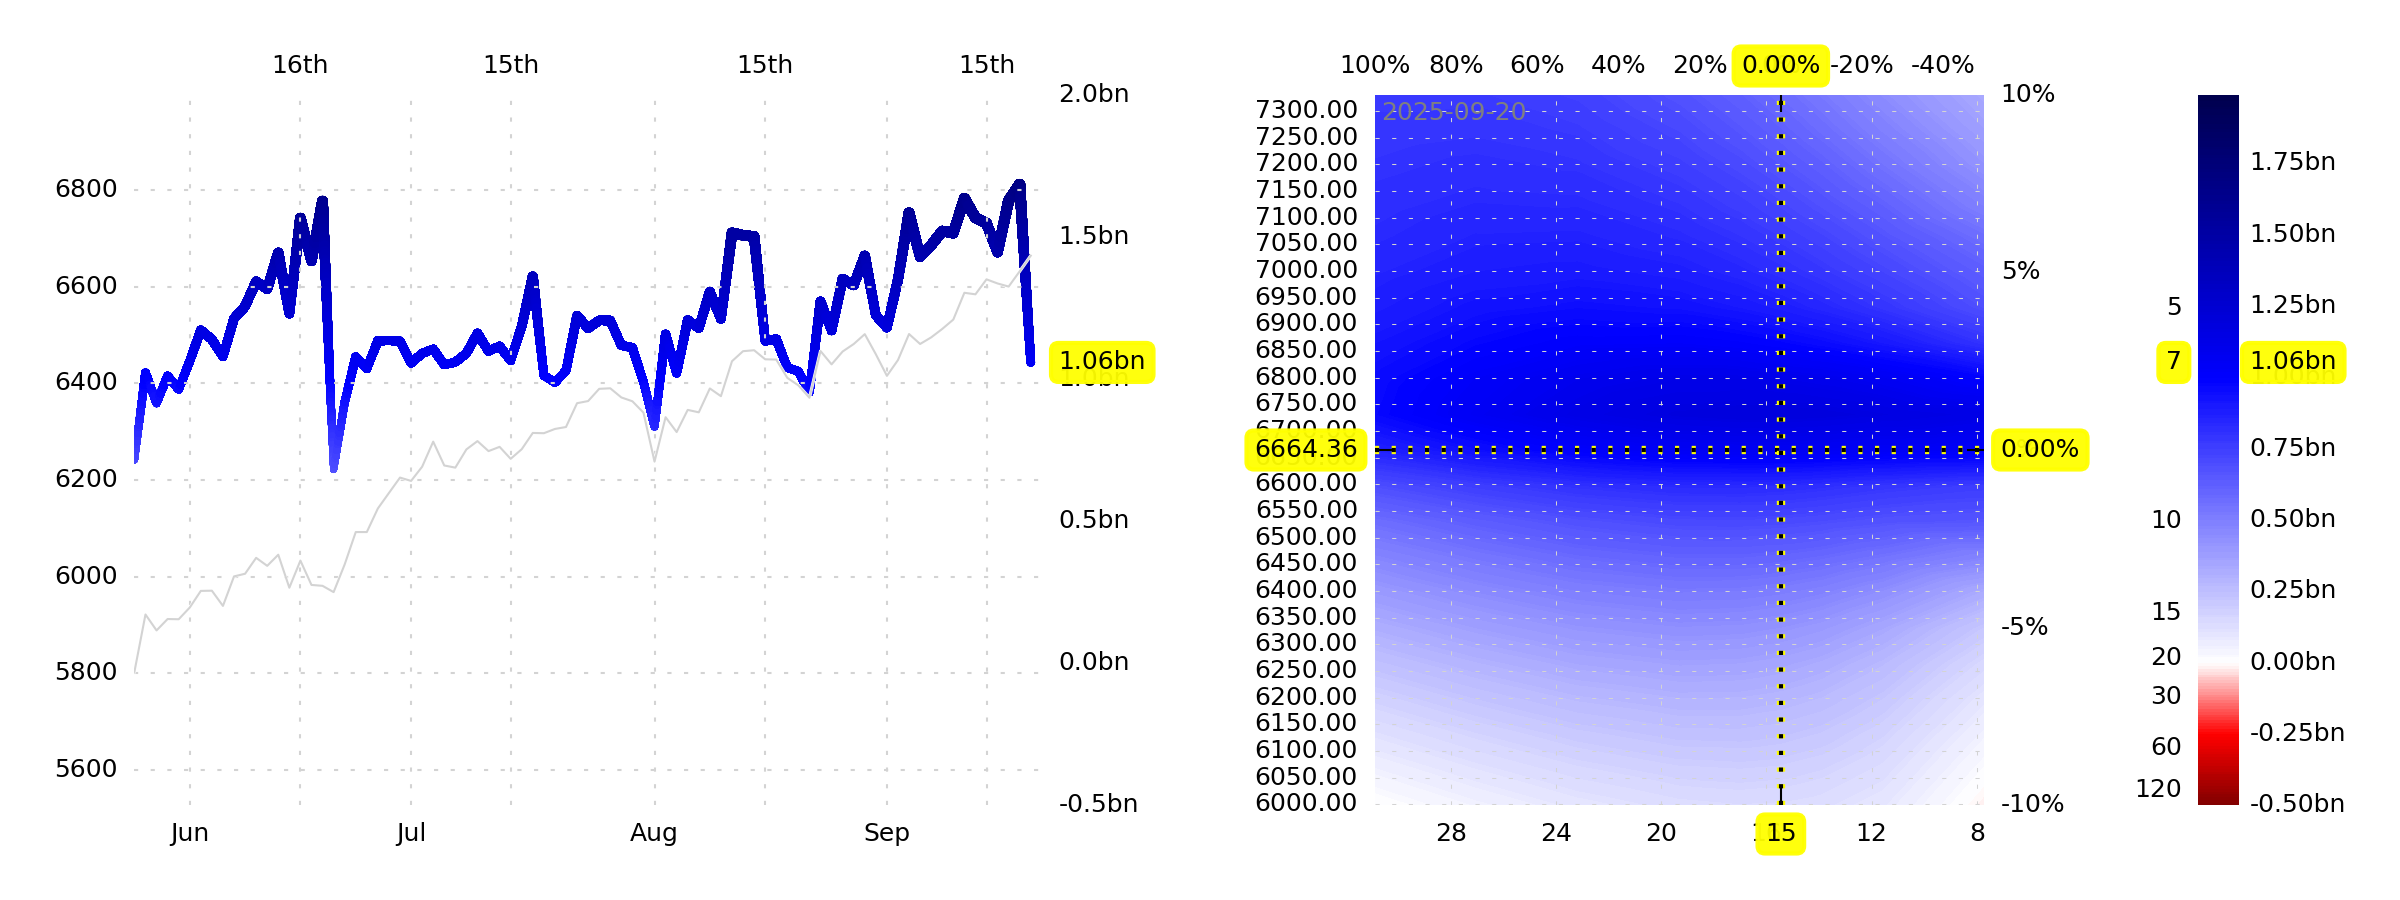
Let's talk a bit more about some more bets to take in that domain, but first, let's address GEX+. Observe that it's fallen a lot, owing to the OpEx.
All other things being equal, we were expecting it to land below $1bn (we talked about that on Wednesday and Thursday), but all things were not equal (SPX ramped 1.00% between Thursday and Friday), and you can see that we're marginally above $1bn.
Does this mean that volatility increases in this coming week? Yes, probably. But it's also probably not going to be super-dramatic. $1bn in buying per SPX point down is still a fair bit of liquidity.
Anyway, this feeds into our idea that what we should be seeing is some fairly calm, measured downside in SPX. But then that's what we were saying last weekend, too, and last week wasn't exactly what we were hoping for.
Ok, what about those single-name bets?
Let's take a glance at the Ideas page. (We like to filter by >5y of history and to remove ETFs from consideration, so let's start there and glance through the list.)
Ok, first idea: S&P Global (
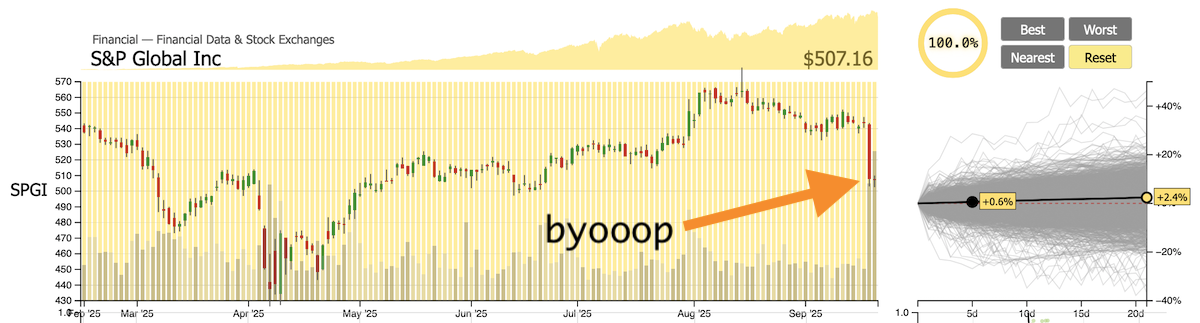
SPGI). Maybe this is a weird place to start (since it's ostensibly a "white collar services" stock, which is the sort of thing we've been short), but look at this chart.
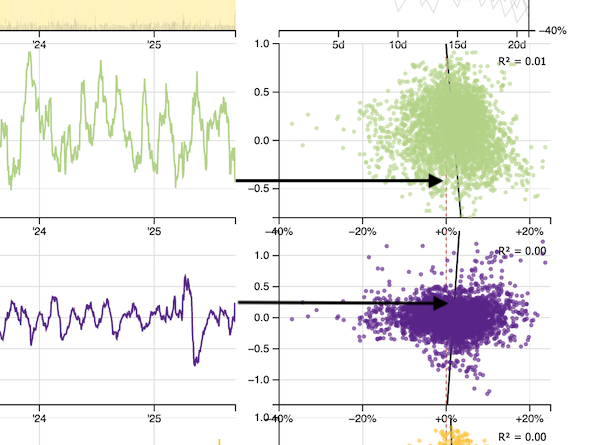
The nearest-neighbor algorithm says this thing gives +2.3% average 1-month returns, but that the 12.5% of data nearest to the current setup averages +3.3%. Makes sense—this is a classic "buy-volatile-dips" stock, as we can see from the scatterplots.
So, we already know
why this thing went down on Thursday—FactSet (
FDS, a financial data "peer") reported earnings and has been having a tough time. And without even looking, you can guess that a financial data subscription platform, a "data intelligence" platform, a "software suite," is going to be having the same trouble as other once-entrenched software packages as AI chatbots make it easier to vibe-code all your APIs to pump data into the single spreadsheet that runs your entire bank/enterprise. The platform subscription becomes less important,
n'est-ce pas?
But can we argue that S&P Global simply isn't a "software suite," and isn't likely to experience the same pain? Sure, there's CapIQ, but even that seems to lean heavily on private markets data, which isn't something that a "let-me-Google-that-for-you" vibe-coding chatbot can replace—and then there's Platts, the indices (licensing), and the ratings agency stuff. All of these seem pretty robust.
Never thought we'd be arguing in favor of buying S&P Global on a dip, but here we are. Seems like a decent bet. Shouldn't be bucketed with FactSet.
What else?
Hey look, another tool stock, Fastenal (
FAST). We like tool stocks right now. Let's buy it. Nearest-neighbor algo says 1-month returns are +1.4%, but 1/6th of data nearest current combination is +2.9%. Neato.
What else?
Hmm, CrowdStrike (
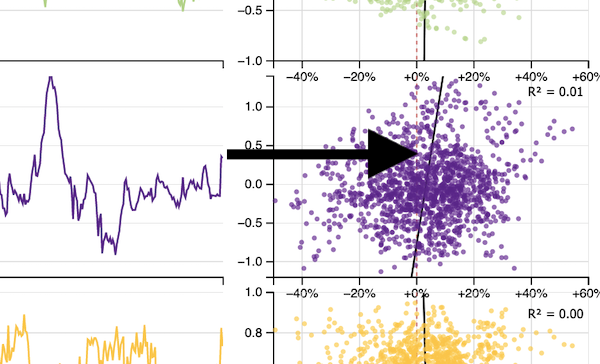
CRWD). Uptick in vol-trend (V) is a big deal for this one. Recent uptick in vol (upside vol) from a bunch of analysts having fun at an analyst day or convention or something and getting good vibes from the stock.
This has the algo predicting +7.9% average 1-month returns, as compared to the "usual" +4.8%. Nice. In our estimation, this one is interesting because there have been some pretty sophisticated attacks recently, especially a malware worm in npm, the implications of which still are not fully understood. So as an investment theme, cybersecurity could very well have some legs here. (Are there black hat hackers out there using LLMs to spin up extremely cute and clever attacks right now? Yes.)
So there you go.
+SPGI
+FAST
+CRWD
Enough fun for one day. Let's talk about the work we were supposed to be doing this week.
Bore-relations
It's not entirely laziness that has us sitting here with nothing to show for the last week of planning (we were supposed to come up with a new way to present correlations). Rather, some of it is that we... think we know what we're going to do, and it's actually not too complicated.
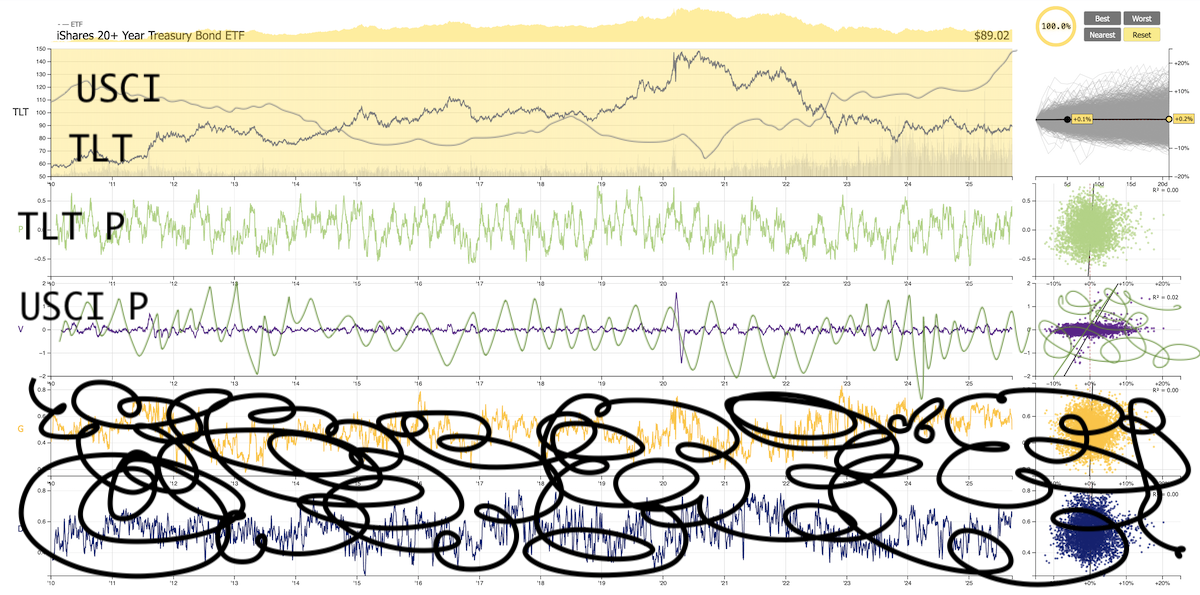
I.e., if you want to display the ability of USCI (commodities) to predict TLT (bonds), can't we use all the same methods as we're already using to play with the other indicators on the Chart?
Like, imagine that instead of P, V, G, and D, we displayed a P from another ticker, and a scatterplot that demonstrates the returns associated with that P. And then we can just plot the other ticker up top in a different color or something, for reference.
Like this:
That'd be a good start, right?
It should show us, for instance, whether USCI going up over the past month tends to result in TLT going up or down over the next month—which is the question that we want to be answered here. (And we really want to be able to see how that predictive correlation shifts over time, which we'll be able to do by clicking and dragging on a subsection of history and seeing how the r-values on the scatterplots dynamically shift—that'll be awesome.)
Anyway, let's not get too deep into this. We're going to deliver something to play with next weekend, and either it's going to work or it's not. So far, we're optimistic. And no, it won't have those squiggles on it. It will look prettier.
Enjoy the week!
The SqueezeMetrics Team