All the charts and data we refer to can be found on the Yacht Club page.
Hey everyone,
Part of our thesis in the
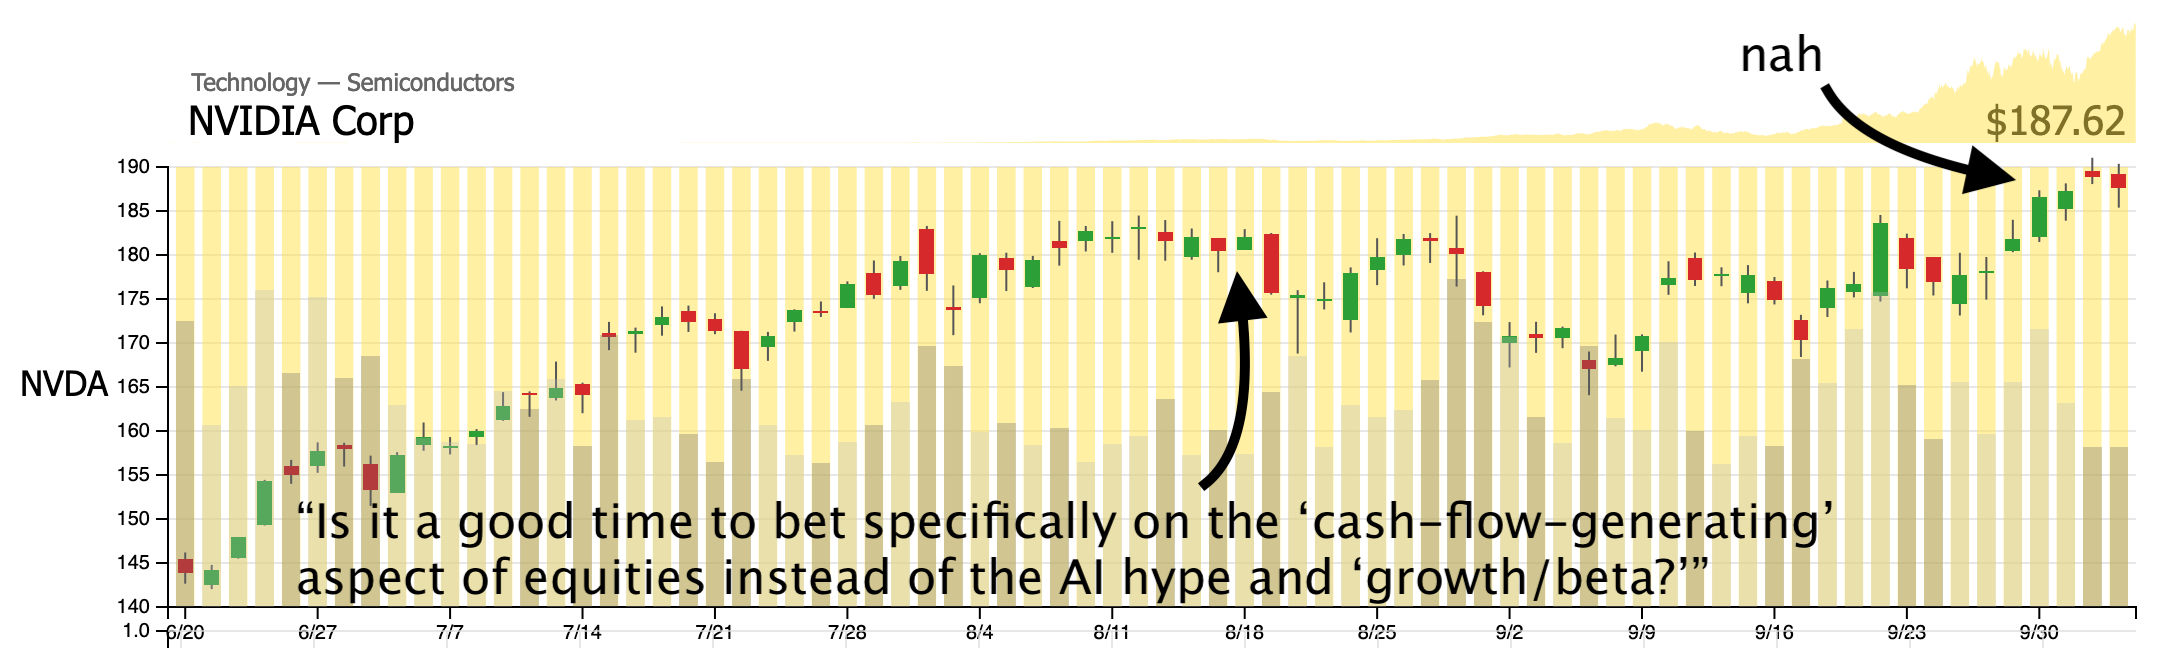
last six weeks has been that there's too much index concentration in simple AI trades. Most notably, NVIDIA, which is itself larger than several S&P 500 sectors.
This has had us short NVDA and buying puts on things like CoreWeave (CRWV), with the idea being that the concentration in NVDA is a bubble, and that "AI growth" narrative needs to weaken or trickle into other things. Like tools and robots.
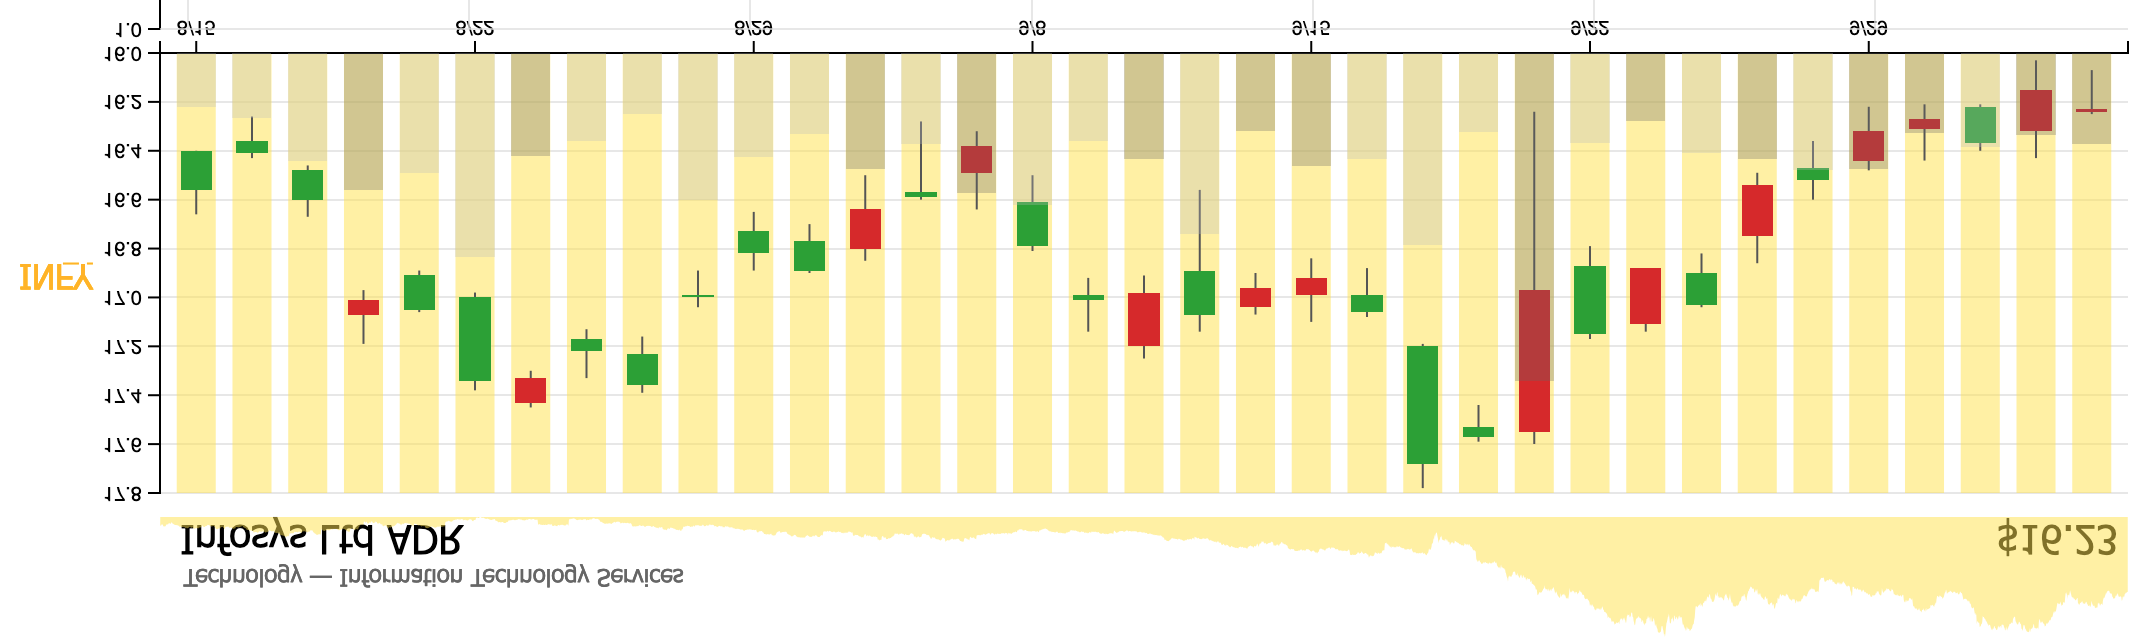
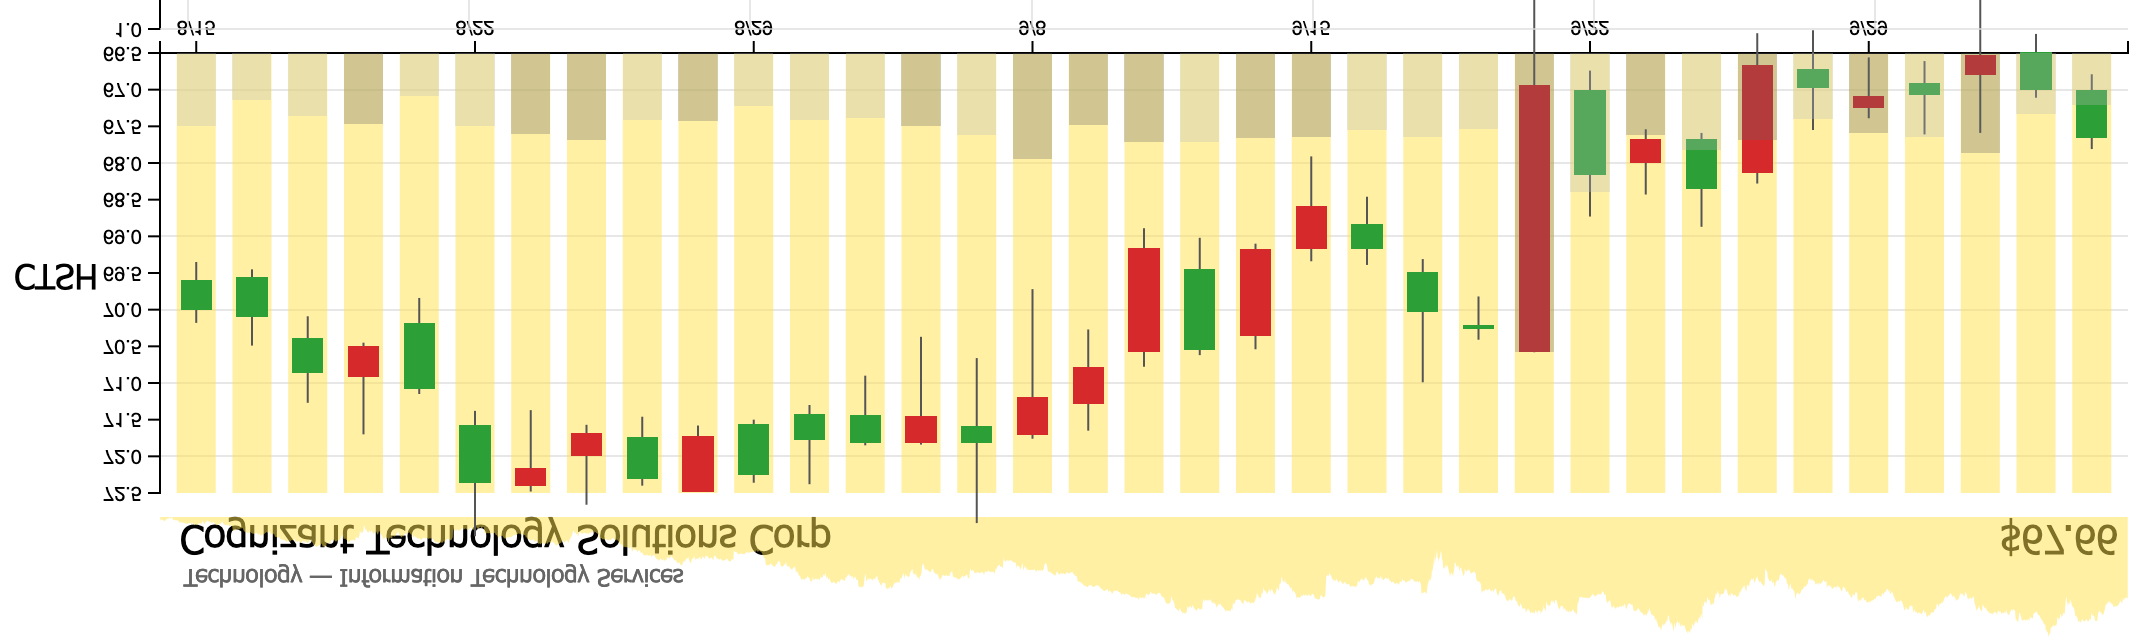
At the same time, we've been short things like Cognizant (CTSH) and Infosys (INFY), with the thesis that these commodity white-collar service firms, these Mechanical Turks, can no longer thrive in a post-AI environment.
To our chagrin, if you flip these two white-collar charts on their heads...
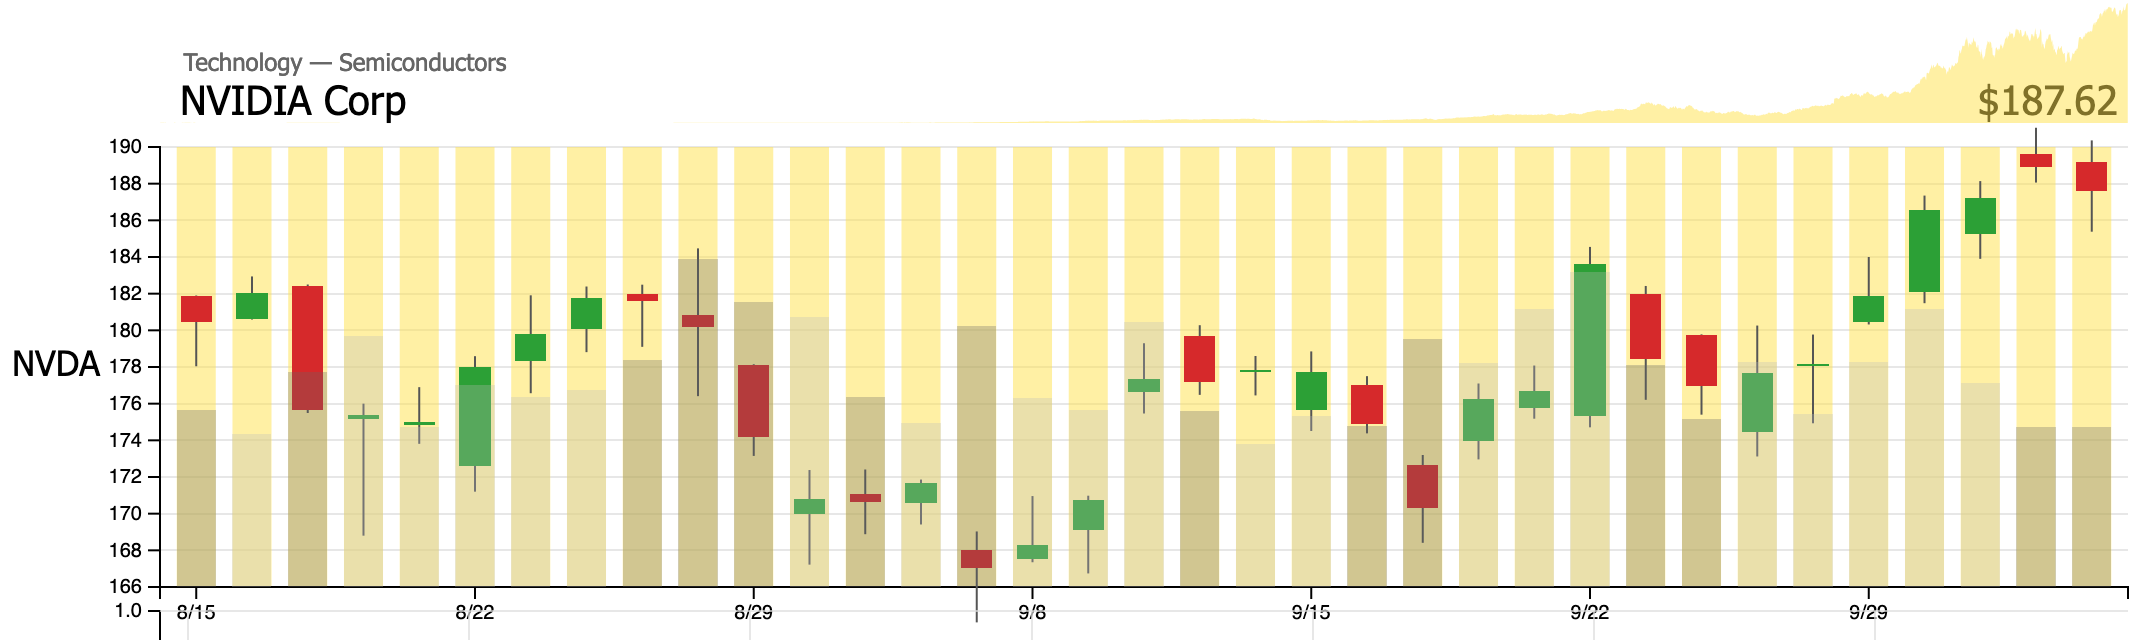
...they pretty much took the same path as +NVDA over the same period.
Which means that our NVDA short (and CRWV put) has mostly moved with our white-collar-data-entry short. NVDA simply won't crack.
(Fortunately, our "tools and robots" stuff has done fine. Teradyne is up a lot over the period, Snap-on is up respectably, and Stanley is flat to up. The only one that's still tormenting us is S&P Global—the dip that kept dipping.)
So the "bubble" thesis hasn't quite worked the way we wanted, but that's only because the growthy AI stuff hasn't gone down yet, and we think it should. Otherwise—when we re-evaluate this idea, it still seems correct, even today.
Is it a good time to bet specifically on the "cash-flow-generating" aspect of equities instead of the AI hype and "growth/beta"? Maybe it's a moment for the small-cap factor? How about some solid Russell 2K businesses? Some "value"-oriented stocks?
Since then (
8/17), QQQ +4.48%; IWM +8.23%.
Hopefully, dear reader, you've ended up on the right side of this subtle shift in the market.
Today, we want to talk a bit more about some of this subtle single-name stuff, since it's timely and it's interesting. And because we have a new way to look at things. But first.
- Indexorable!
- Unstockable!
- A new way
Indexorable!
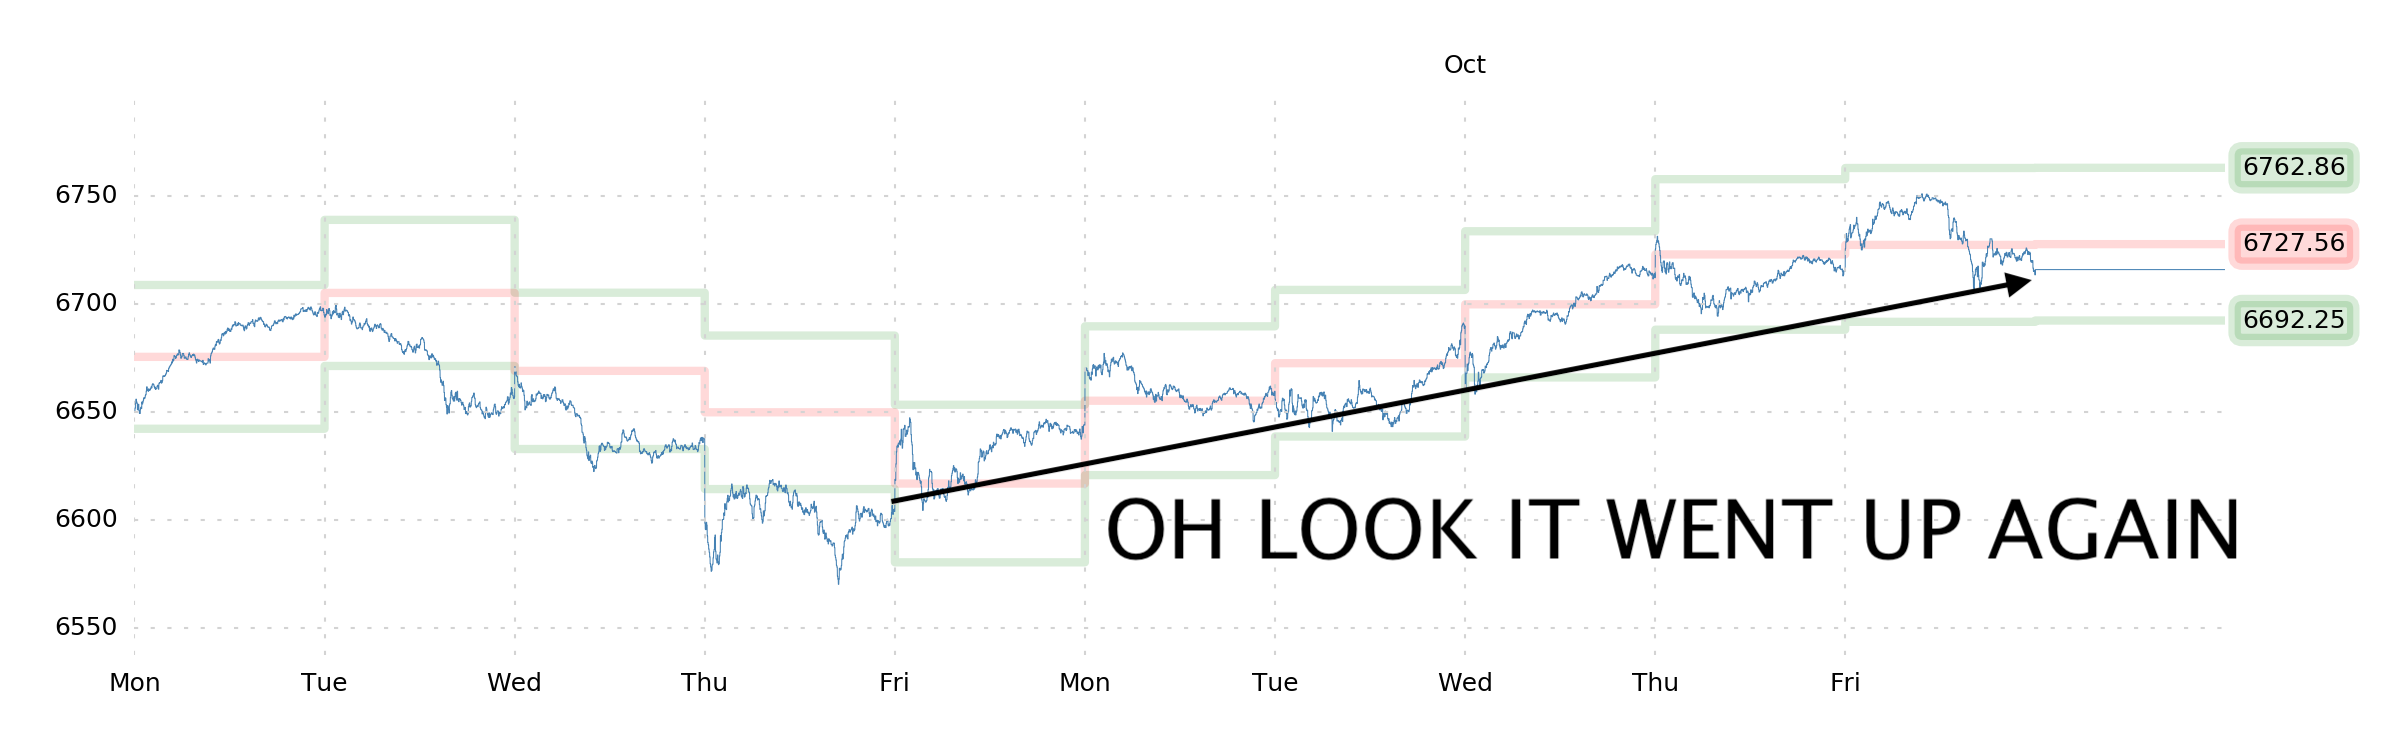
Index up 2.00%. Touched 6750 on Friday. Robot Jim
smirks.
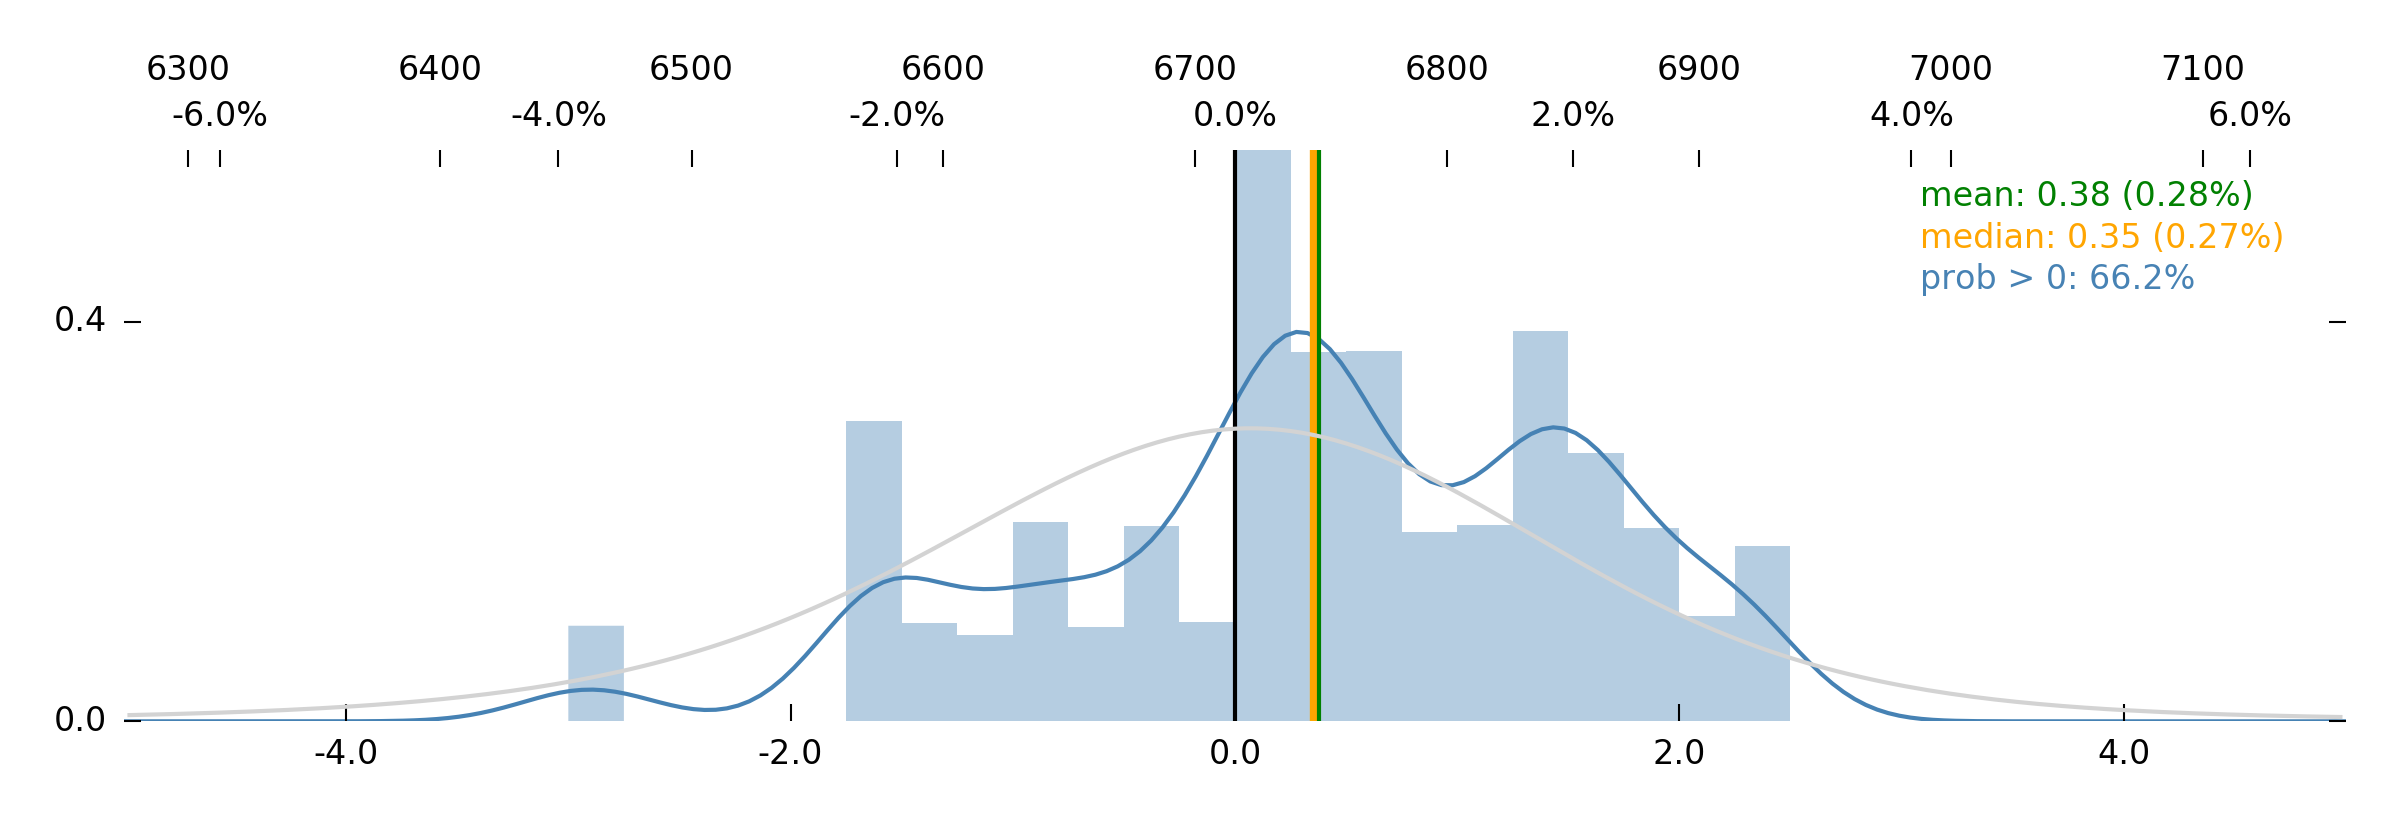
Robot Jim's expectation that SPX probabilities are underpriced at ~6750 (+100pts) pretty much tracks with a calm upside move expectation into the highest-liquidity region. What this means is that you have to believe in the AI-unbubbling thesis in order to think that there's downside from here. Otherwise, a better default position is a conservative call spread.
The call spread was indeed the real win for the week. Our intraday trading was marginally in the black: Tuesday was a loss, but recall that we sized small (owing to EOM expiry). Thursday and Friday were small wins.
An aside: When we look at the price-action in that plot above, we see a pattern we immediately want to track down. Whereas the action from last week has that smooth upside and that punctuated, choppy downside (classic), this week's action is all lumpy (weird). Our guess is that this is owing to some uncorrelated stuff (which harks back to the prior discussion about "growth" underperforming, and single-name stocks doing fun things) going on under the surface.
What "correlation" index can we refer to? How do we validate this? Cboe implied correlation index (COR3M) is low (14), which is suggestive, but we'd rather see a "realized" / "historical" measure. How about dispersion (DSPX)? Ok, yeah, that's high, which suggests the same thing (implied excess wiggles in index components), but that's also a forward-looking, option-based measure... uh, does nobody have a non-proprietary realized correlation that we can reference?
No?
Ok. Let's make one quick.
(Sorry, now we're really going on a tangent.)
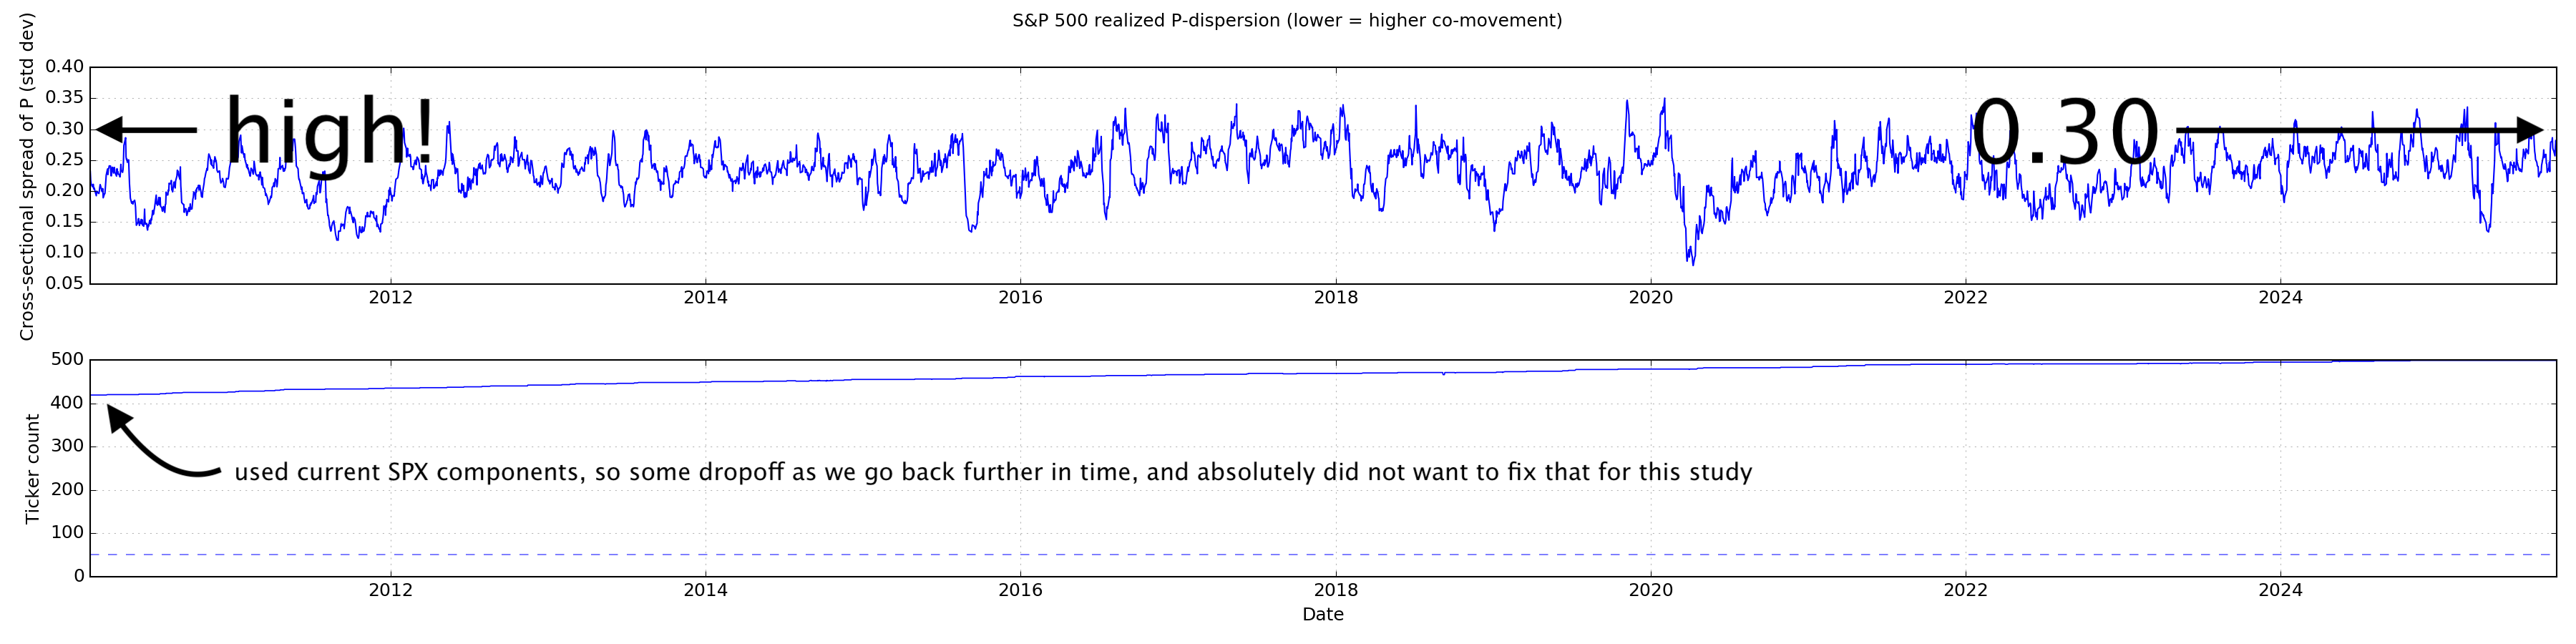
Method: Take the P (price-trend, indicating how much up or down a stock has been moving, relative to its own volatility, over the past month) of each [current] S&P 500 component through time. If the Ps are clustering on any given day, that's high correlation; if the Ps are spread out, that's low correlation. We expect, just based on what we're experiencing, that correlations will be low—that the cross-sectional spread of Ps will be high.
[one hour later...]
Ok, that was annoying. Here we go.
In summary, yeah, correlations are really low by this measure. The current standard deviation of Ps across the S&P 500 is 0.30. That's a lot of spread. I.e., things are moving very independently. And it's not even earnings season.
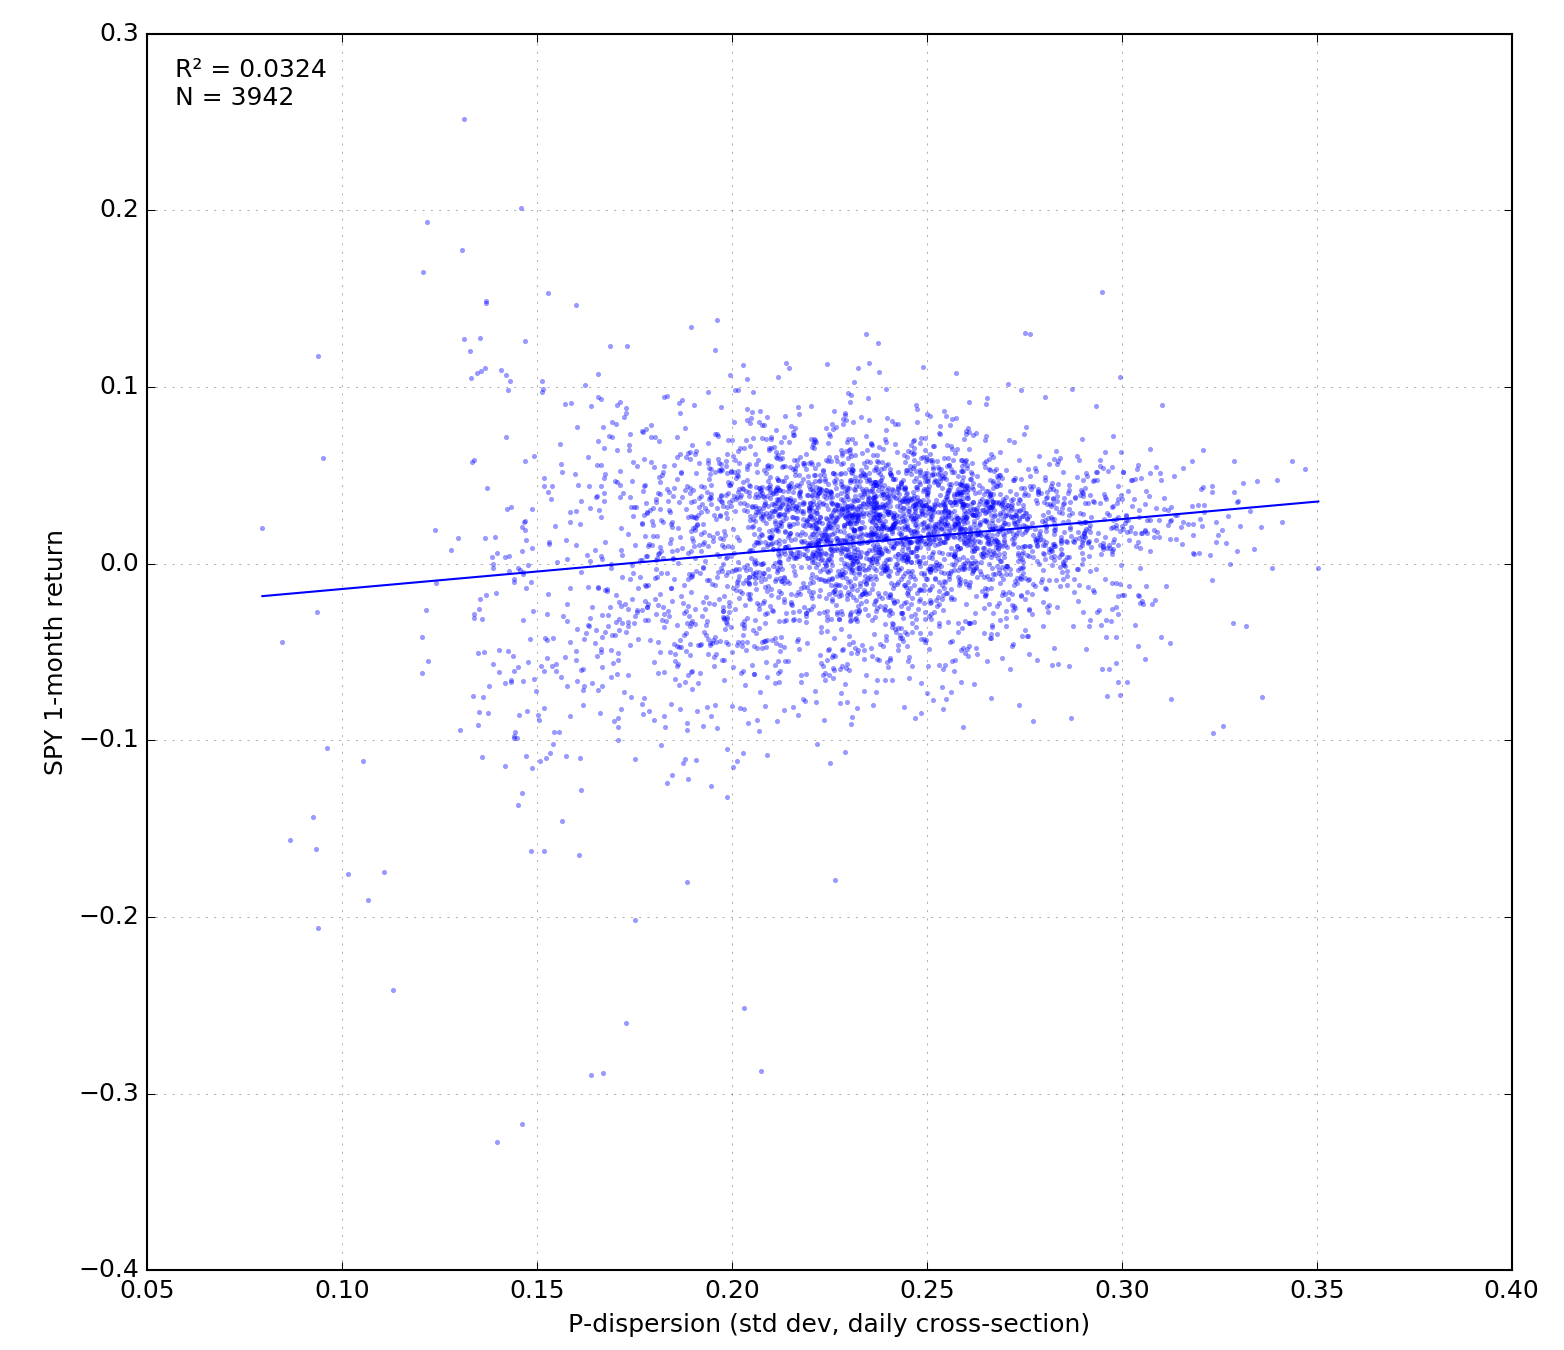
The point of doing this was only to see if our intuition was correct, but now we're curious if there's any obvious forecasting information here. So, as long as we're here—what's this dispersion-of-Ps look like in terms of 1-month forward S&P returns?
Same sort of visual profile as GEX, which is not surprising when you think about it.
Nerds: Causally, high index GEX causes an "exogenous" index bid when components, particularly components in a single sector, fall; and that dealer bid manifests as a bid in index components, pushing up the ones that weren't quite as beleaguered; causing rotation. Which is fundamentally robust. And it's actually part of why GEX(+) "works" the way it does, and why a sudden drop in GEX tends to be followed by higher correlations. It's all very much related, and if we were to ascribe a causal impetus to this correlation stuff, it's mostly GEX itself, so it's probably not worth thinking too much about this right now. What would be interesting is looking at when GEX+ is high and P-dispersion is low. That might mean something interesting. But now we're getting tired.
Ok, enough. Bookmark this P-dispersion idea for later—maybe it can be useful in some kind of future nearest-neighbor ensemble.
Back on track.
What's in stock for this coming week?
Unstockable!
Two weeks ago, Jim said that the best bet was something like a 0.50% loss on the week, and that's what we got. This past week, he said a 100-point gain, and that's very nearly what we got. This coming week, he thinks flat-to-up is the right bet.
Who are we to argue?
The whole idea of building Jim was to mash our S&P indicators together so they could "see" things that we can't. And while we always still feel like we have some work to do on this—we can't deny that his forecasts have been informative.
Our positioning is going to remain the same: We're taking long/short bets in single-names. We'll also continue to take intraday E-mini trades, as per usual.
One interesting thing that we want to point out:
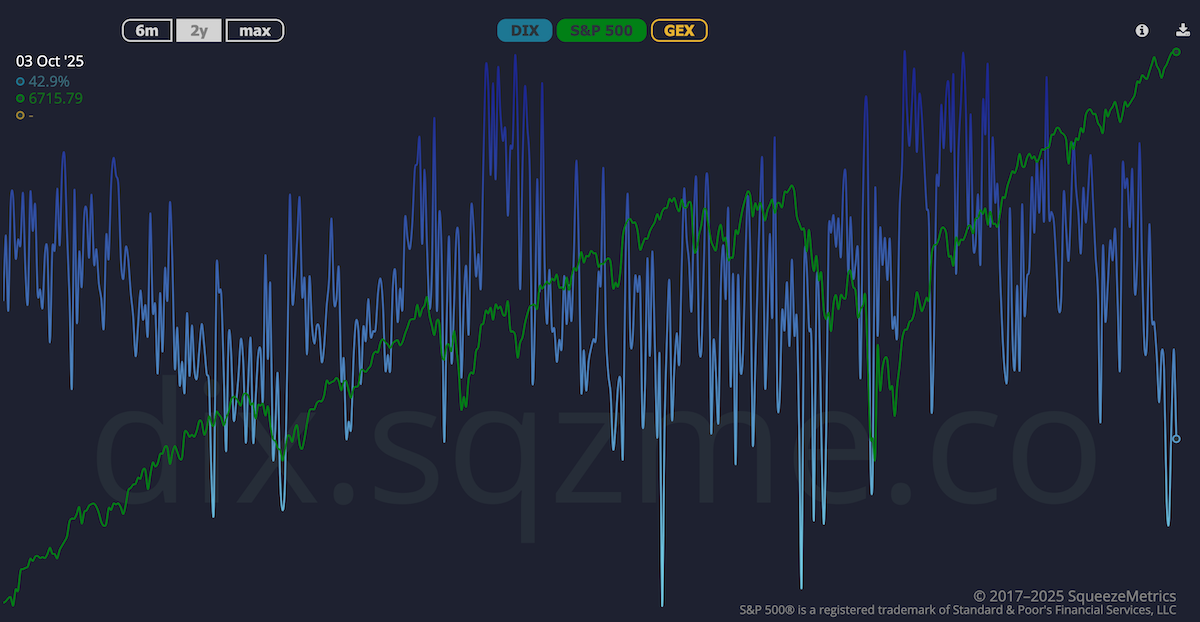
DIX has fallen into the range of two-year lows. That's significant. Regressing DIX against 1-month S&P returns over the last couple years gives you an r-squared of something like 0.13, and it seems to be meaningfully predictive of returns. So, certainly, this is a whiff of weakness, and it's worth noting. Of course, Robo-Jim will tell us if it becomes truly significant, in the context of price and volatility and GEX+ and all that.
Now let's talk about single-name stuff again.
A new way
We think we've finally got something here.
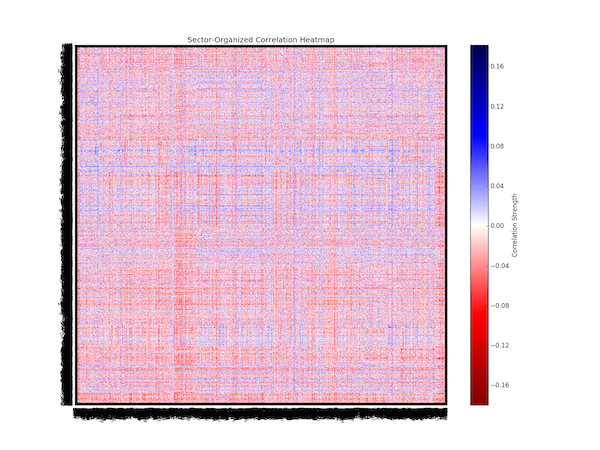
We first tried looking for "predictive correlations" back at the beginning of the year, and our first big attempt looked like this.
A heatmap, a
"plaid shirt," displaying the push-pull relationships between all of the optionable NMS securities on the market. The goal was to find interesting relationships between tickers, and ultimately to use that data to inform trades.
What a bear that was to generate, and to zoom in on. Nor were we able to squeeze much insight out of it. This theme went on for a long time. We tried force-directed graphs and all sorts of things (dendrograms?), looking for relationships, and we integrated some correlation stuff into the k-scope—but it never quite clicked.
Instead of giving up on an idea that failed for nine months, we birthed another attempt. And we think it's kinda cute.
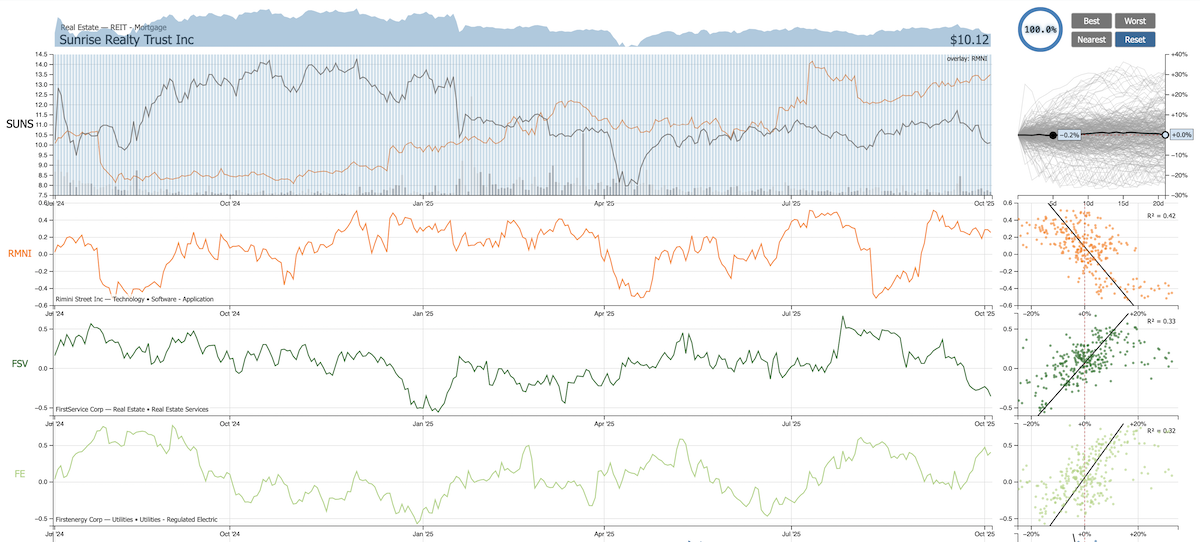
We still don't know what to call it, but it's currently still at the old "k-scope" tab.
The output is fascinating. There are surprisingly strong predictive correlations in here—more than we thought we'd see. There are lots and lots of stories to be told with this stuff.
For instance (random ticker, never heard of it), in the chart above, which targets Sunrise Realty Trust (SUNS), one of the primary influences that populate below it is a real estate services company. The price-action of the latter appears to lead that of the former in a very meaningful way. And... that makes a lot of sense!
We'll talk more about the methodology here next weekend, but we're much closer to a finished product here. Please, dear reader, give it a try. Play around. Tell us what you think.
And here's hoping Jim changes his tune shortly—this S&P price-action is getting boring.
Enjoy the week!
The SqueezeMetrics Team