All the charts and data we refer to can be found on the Yacht Club page.
Hey everyone,
Last weekend, we talked about undead cats in boxes, and how there's definitely a
wrong way to search for long vol bets. (I.e., the weak, passive way. The "this seems relatively cheap" way.)
But then what's the right way?
Well, we don't know that yet... but today, let's see if we can make some progress by working with some tools that we already have.
But first!
- It's quiet...
- Gamma
- Degeneracy
It's quiet...
Last weekend, we were waiting for the other NPD shoe to drop:
Friday's NPD was exactly 0.0. Meaning that for every dollar of put delta bought by customers, there was one also sold.
It is always worth noting that 0 NPD is a reason for caution, and a foreshadowing of vol-of-vol. So if we get some more prints near zero, there will likely be an edge in long gamma.
Well, this week it happened.
A confused dance of net put-buying (leading up to CPI), net put-selling (right after CPI) and then 0 NPD (on Friday) means that we're now in one of those dangerous, conflicted areas where recent put delta flows sum to zero. Customers, by taking both sides of the trade, have reduced dealer intermediation, thus increasing the chance of a spike in volatility (sudden customer liquidity-taking, sudden liquidity inadequacy, sudden vol-of-vol).
The last time we were in a situation like this was late August / early September.
Yet, the S&P cruises along, unperturbed.
As of Wednesday afternoon, we were long puts—which feels like the first time we've taken any serious option position in a while.
We're still long puts. Is it still a good idea?
Gamma
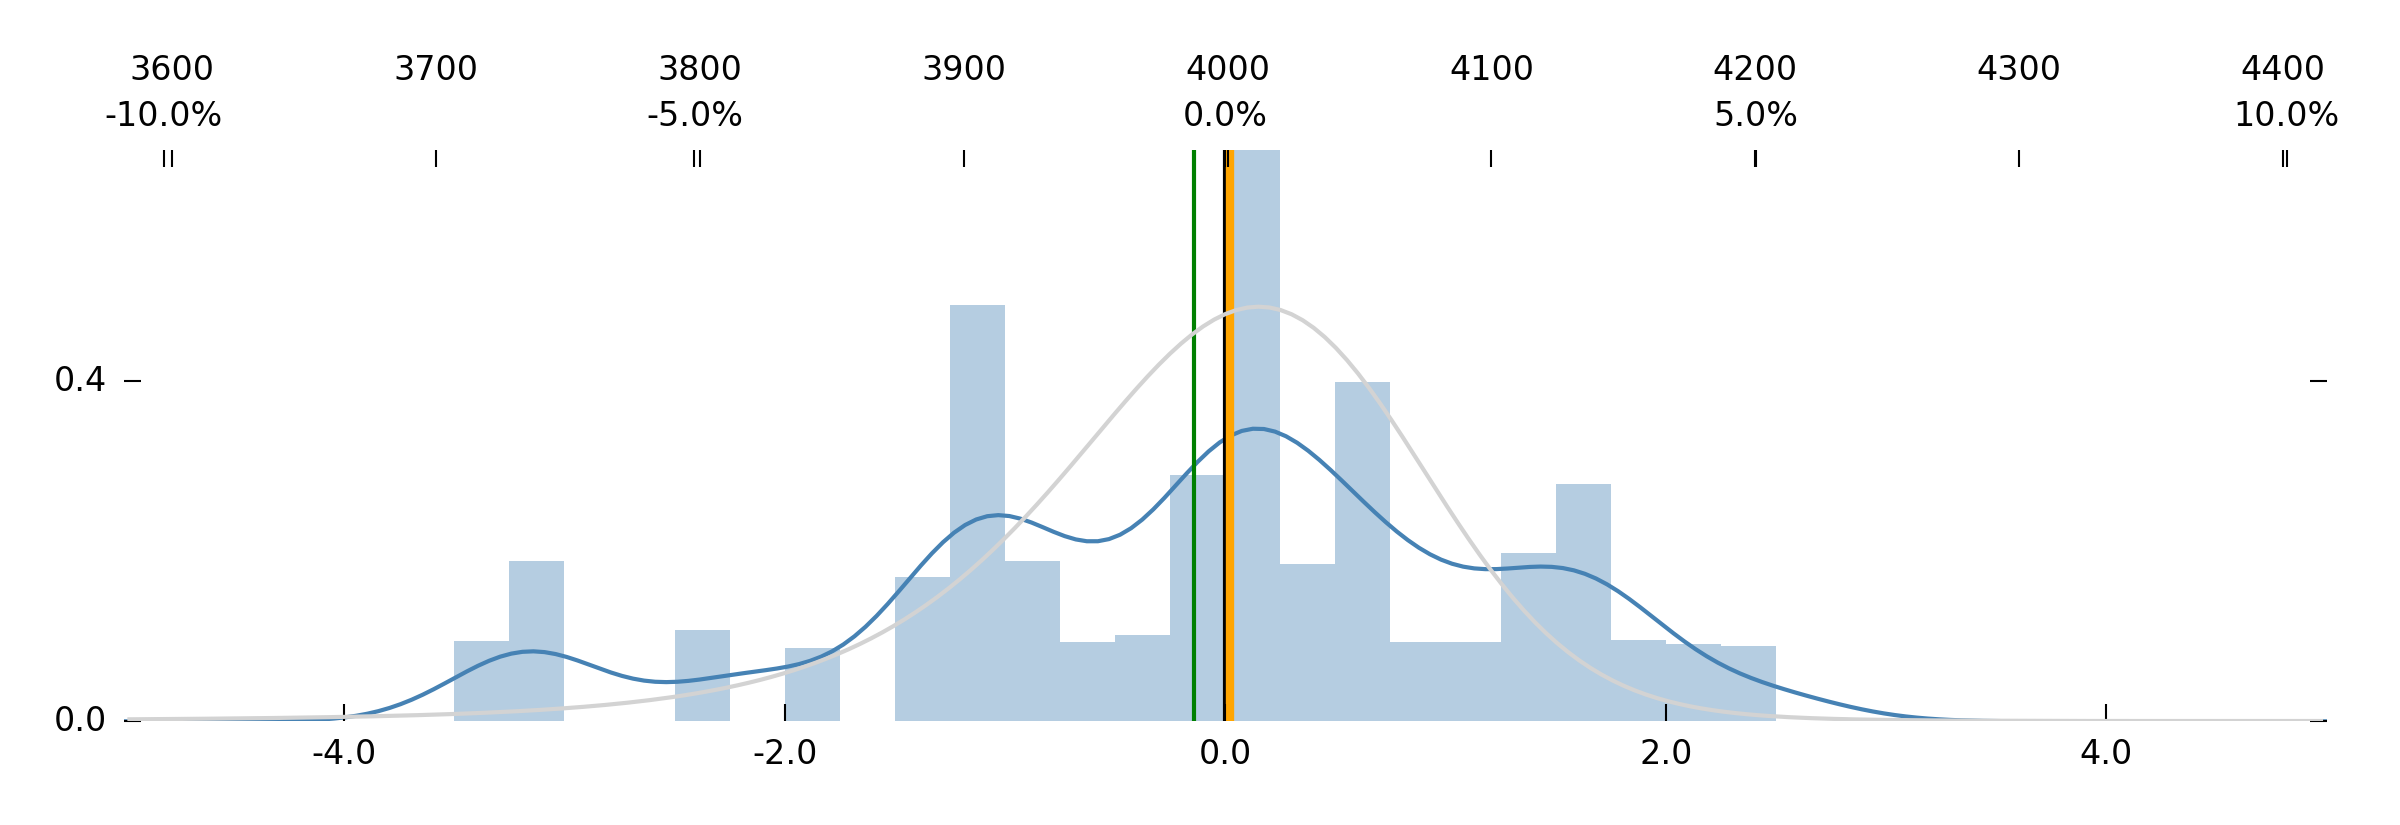
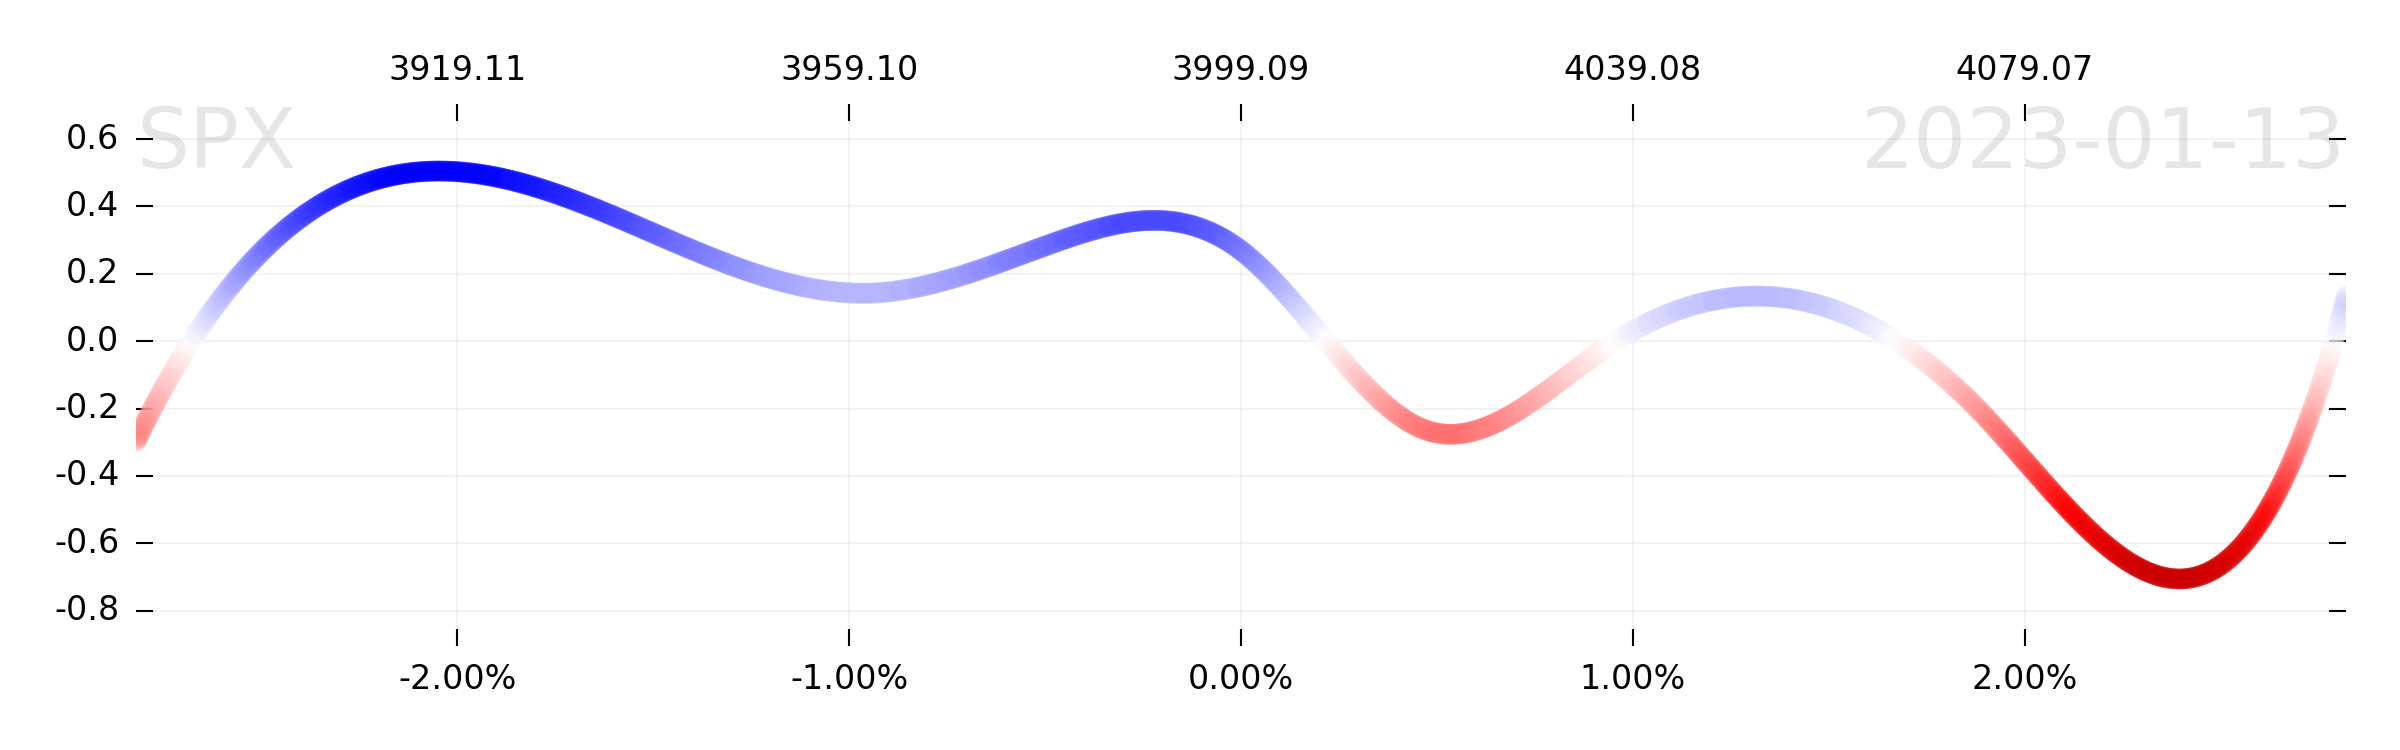
Well, Robot Jim seems to think so. His 1-week forecast is very broad.
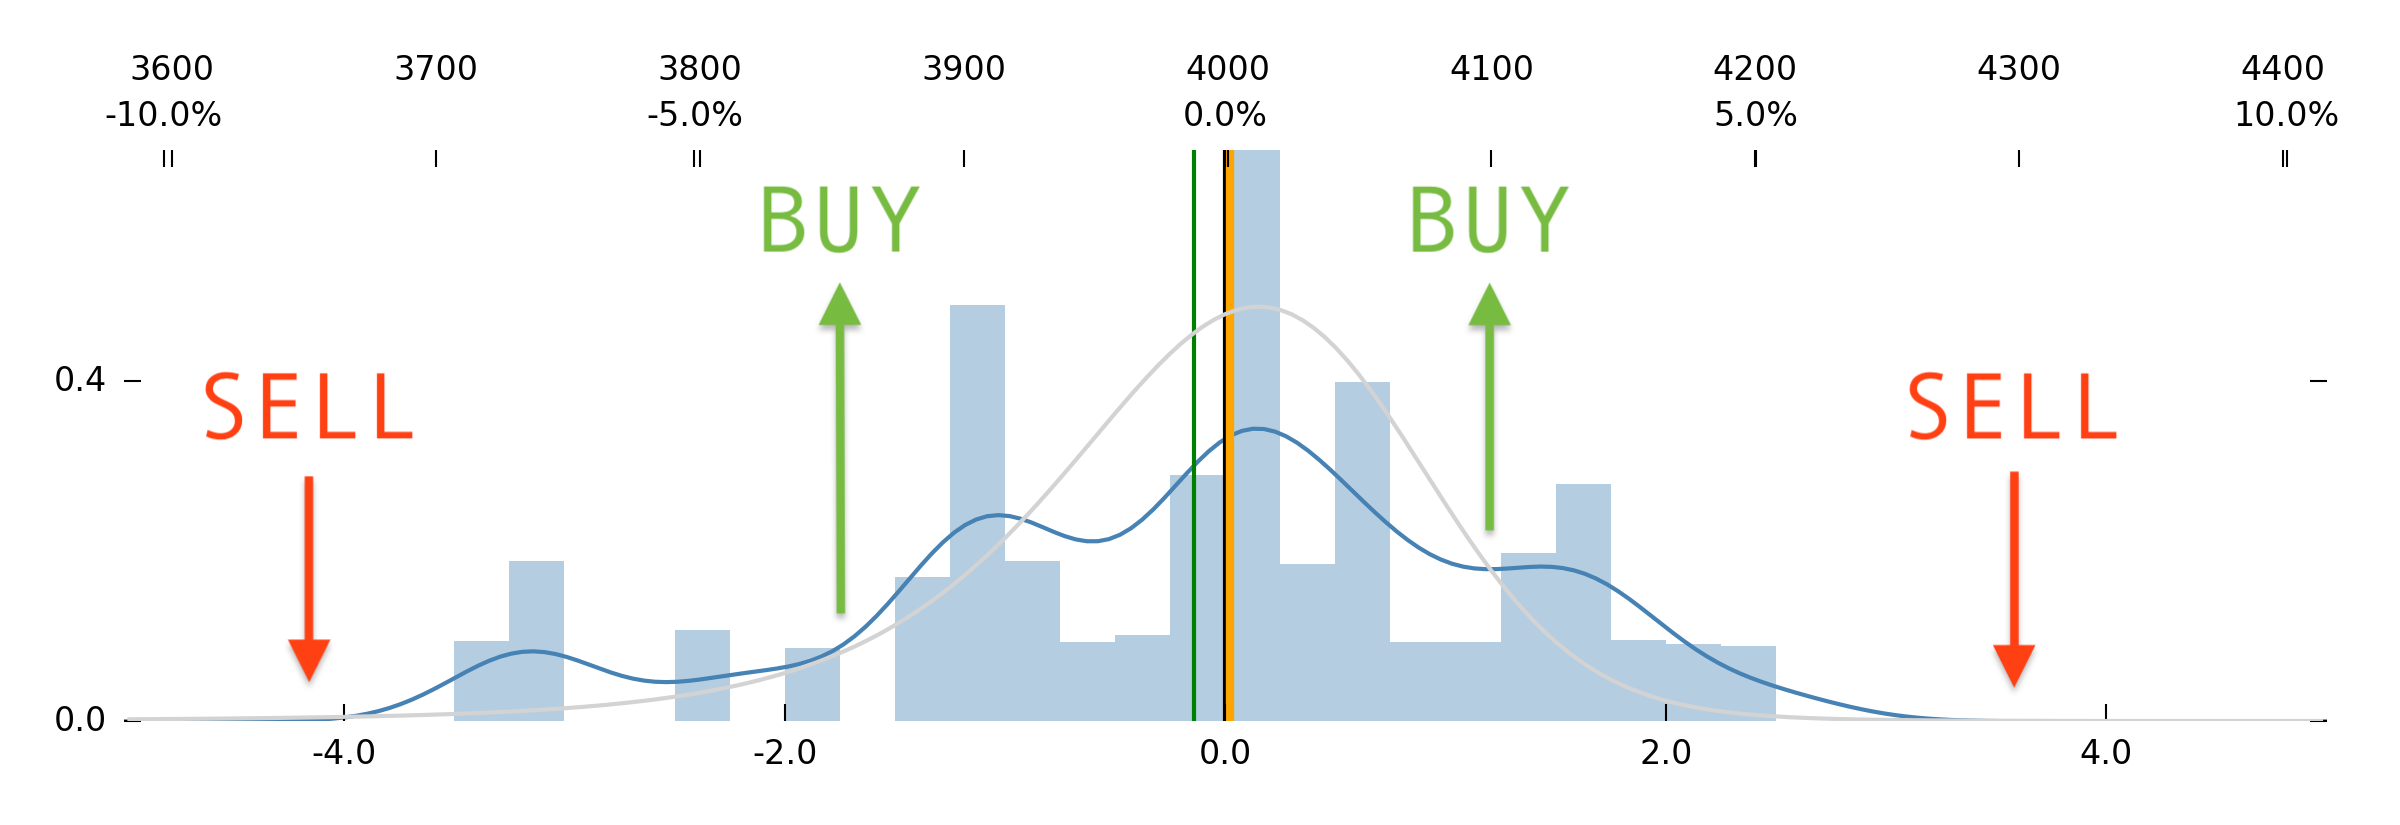
But he also thinks that a long call position is just as valid. Indeed, Jim's distribution has almost no directional preference (mean a bit below 0, median at 0); but it has a clear "long vol" preference.
To get a sense for the quality of the edge, let's ask GOOSE what a bet is worth when we strike the "ideal" option combo.
GOOSE likes the idea of a long iron condor (-3650, +3850, +4100, -4300). At full Kelly, 25% of portfolio would be wagered on this bet. That would yield an average rate of portfolio return of 27.8% per trade.
In simpler terms, Robot Jim is telling us that betting on a move below SPX 3850, or above SPX 4100, is a good idea—despite it being a low-probability bet. Cool, cool. That's pretty much what we were hoping for.
Some other things that might matter:
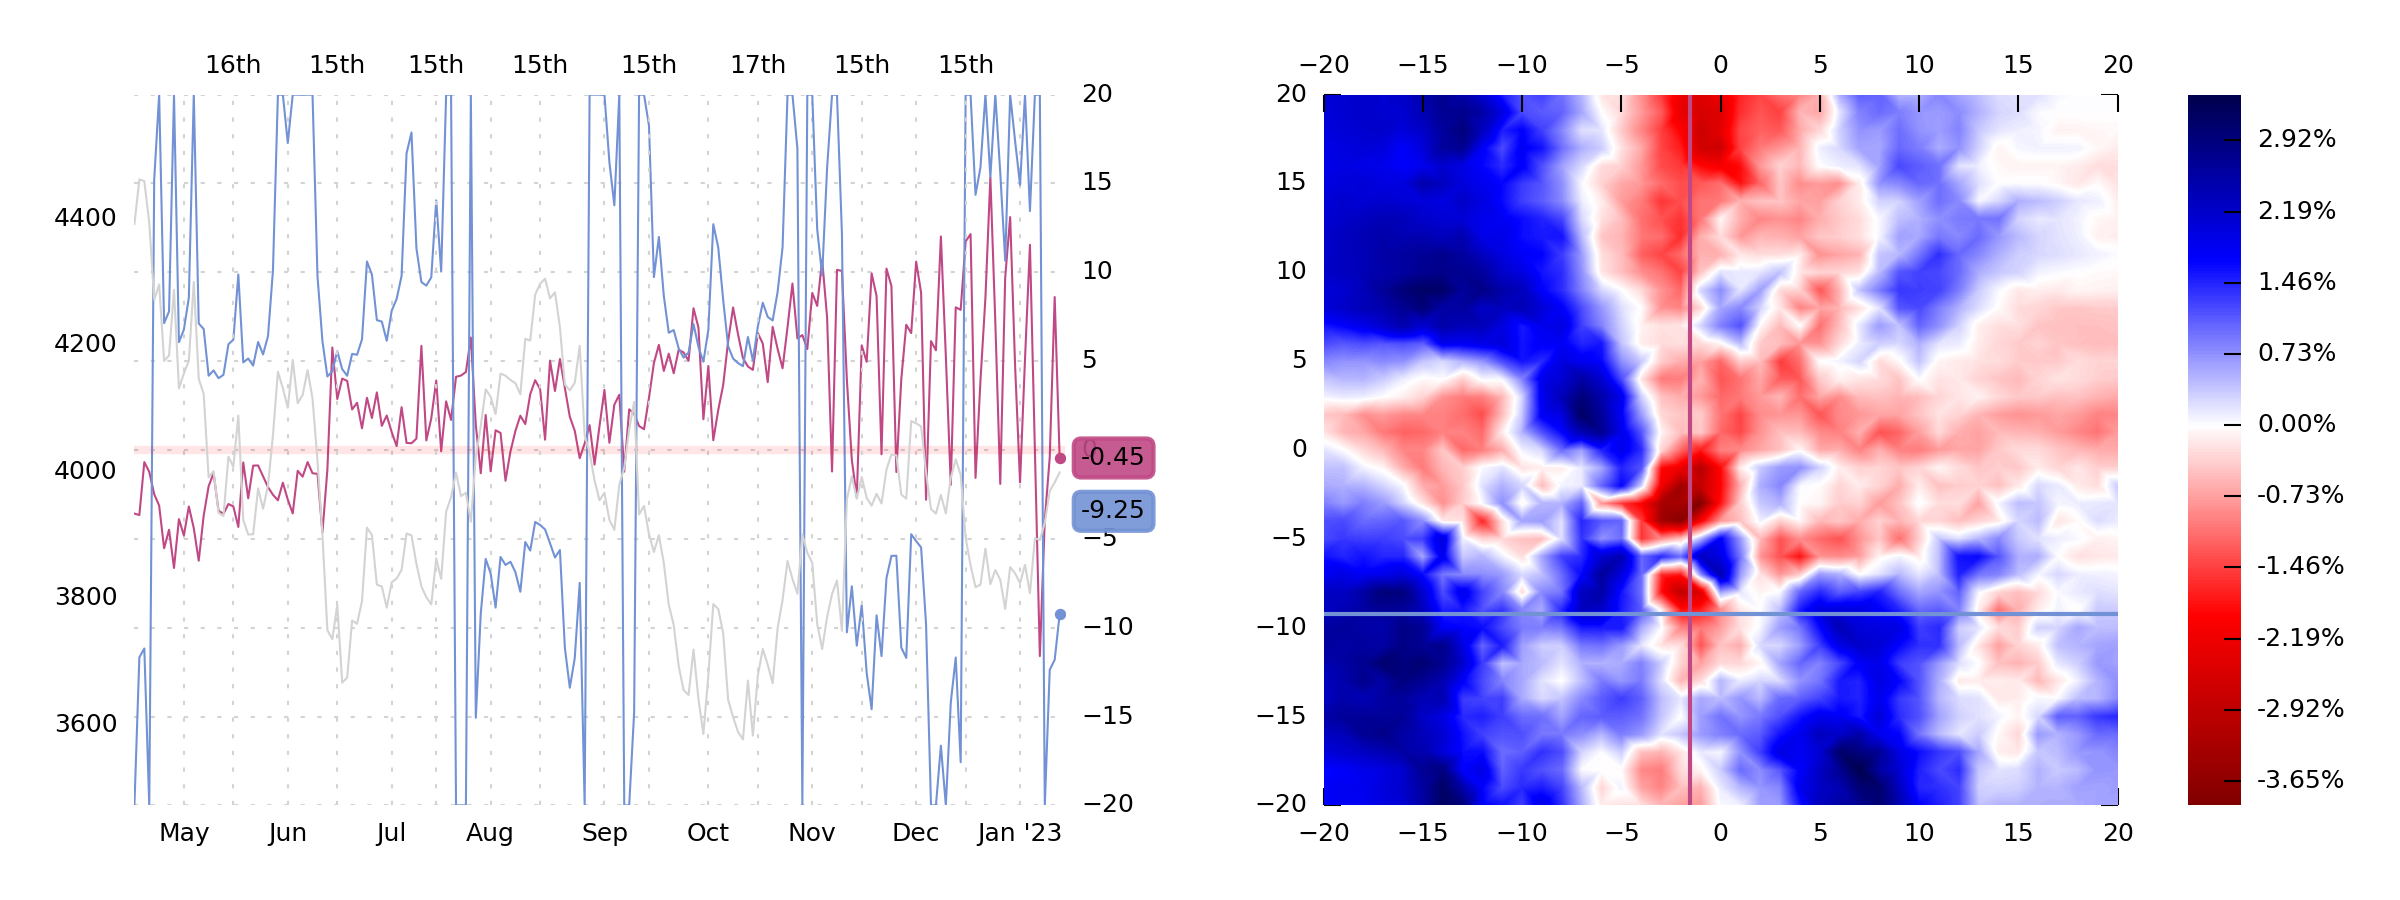
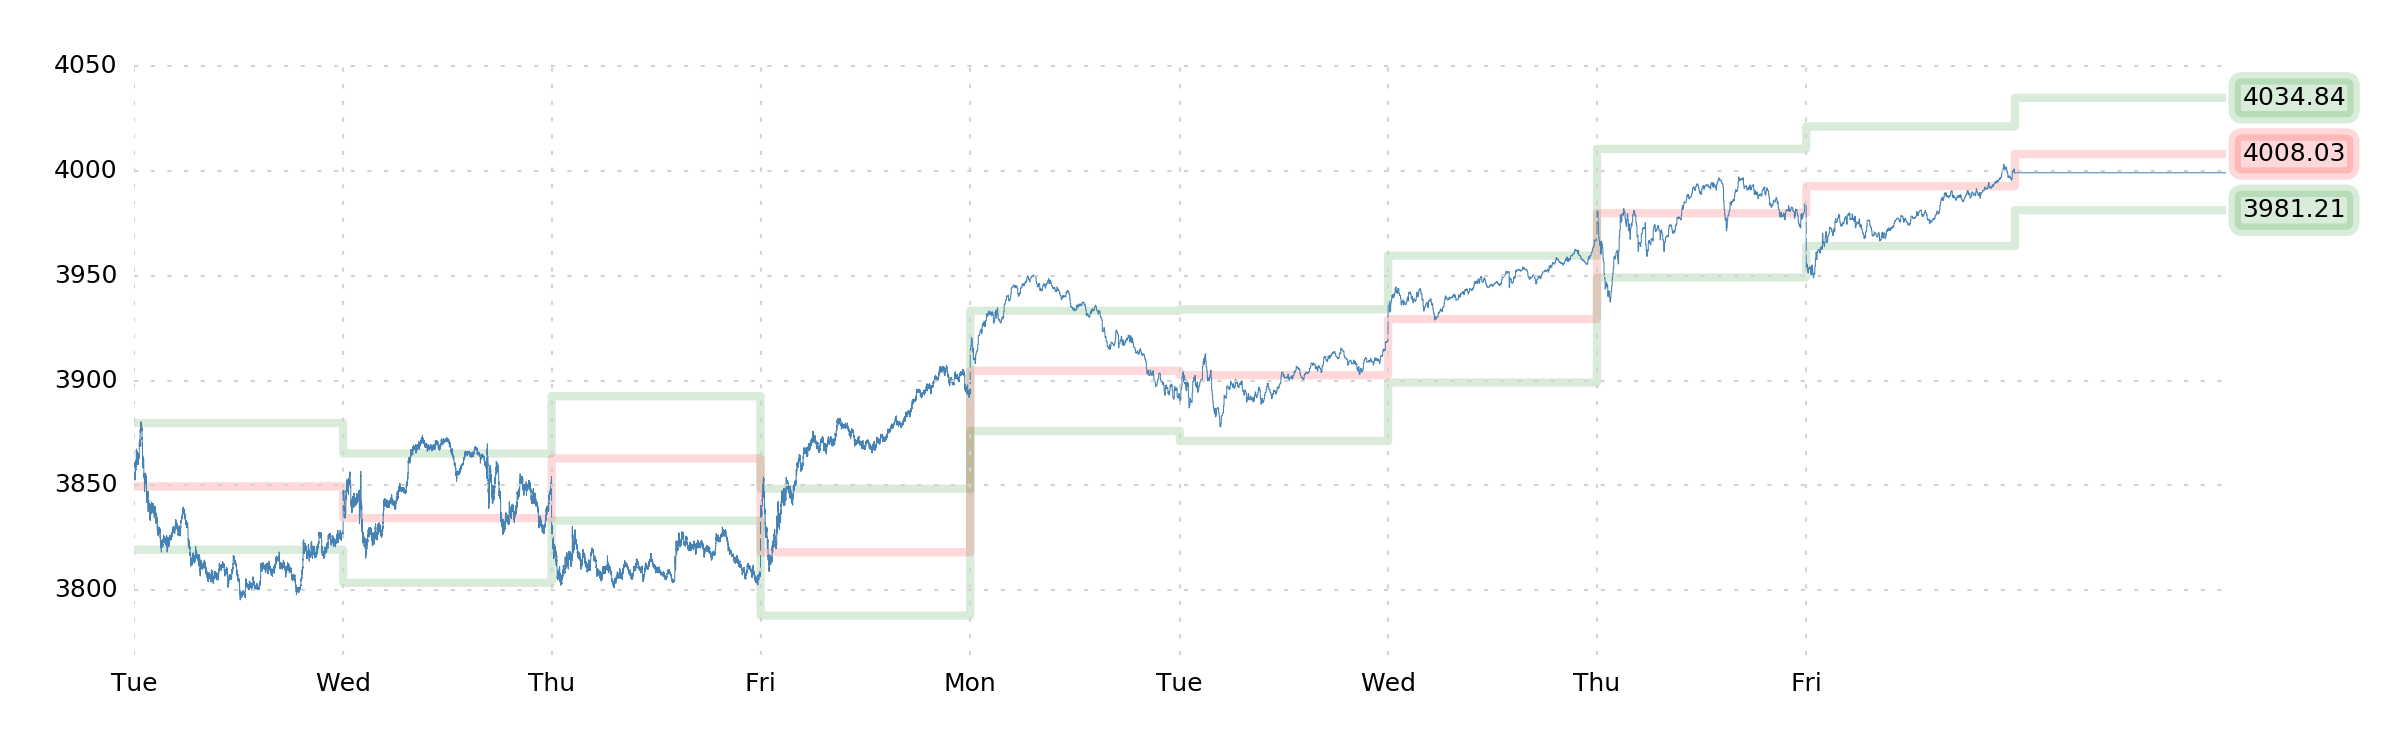
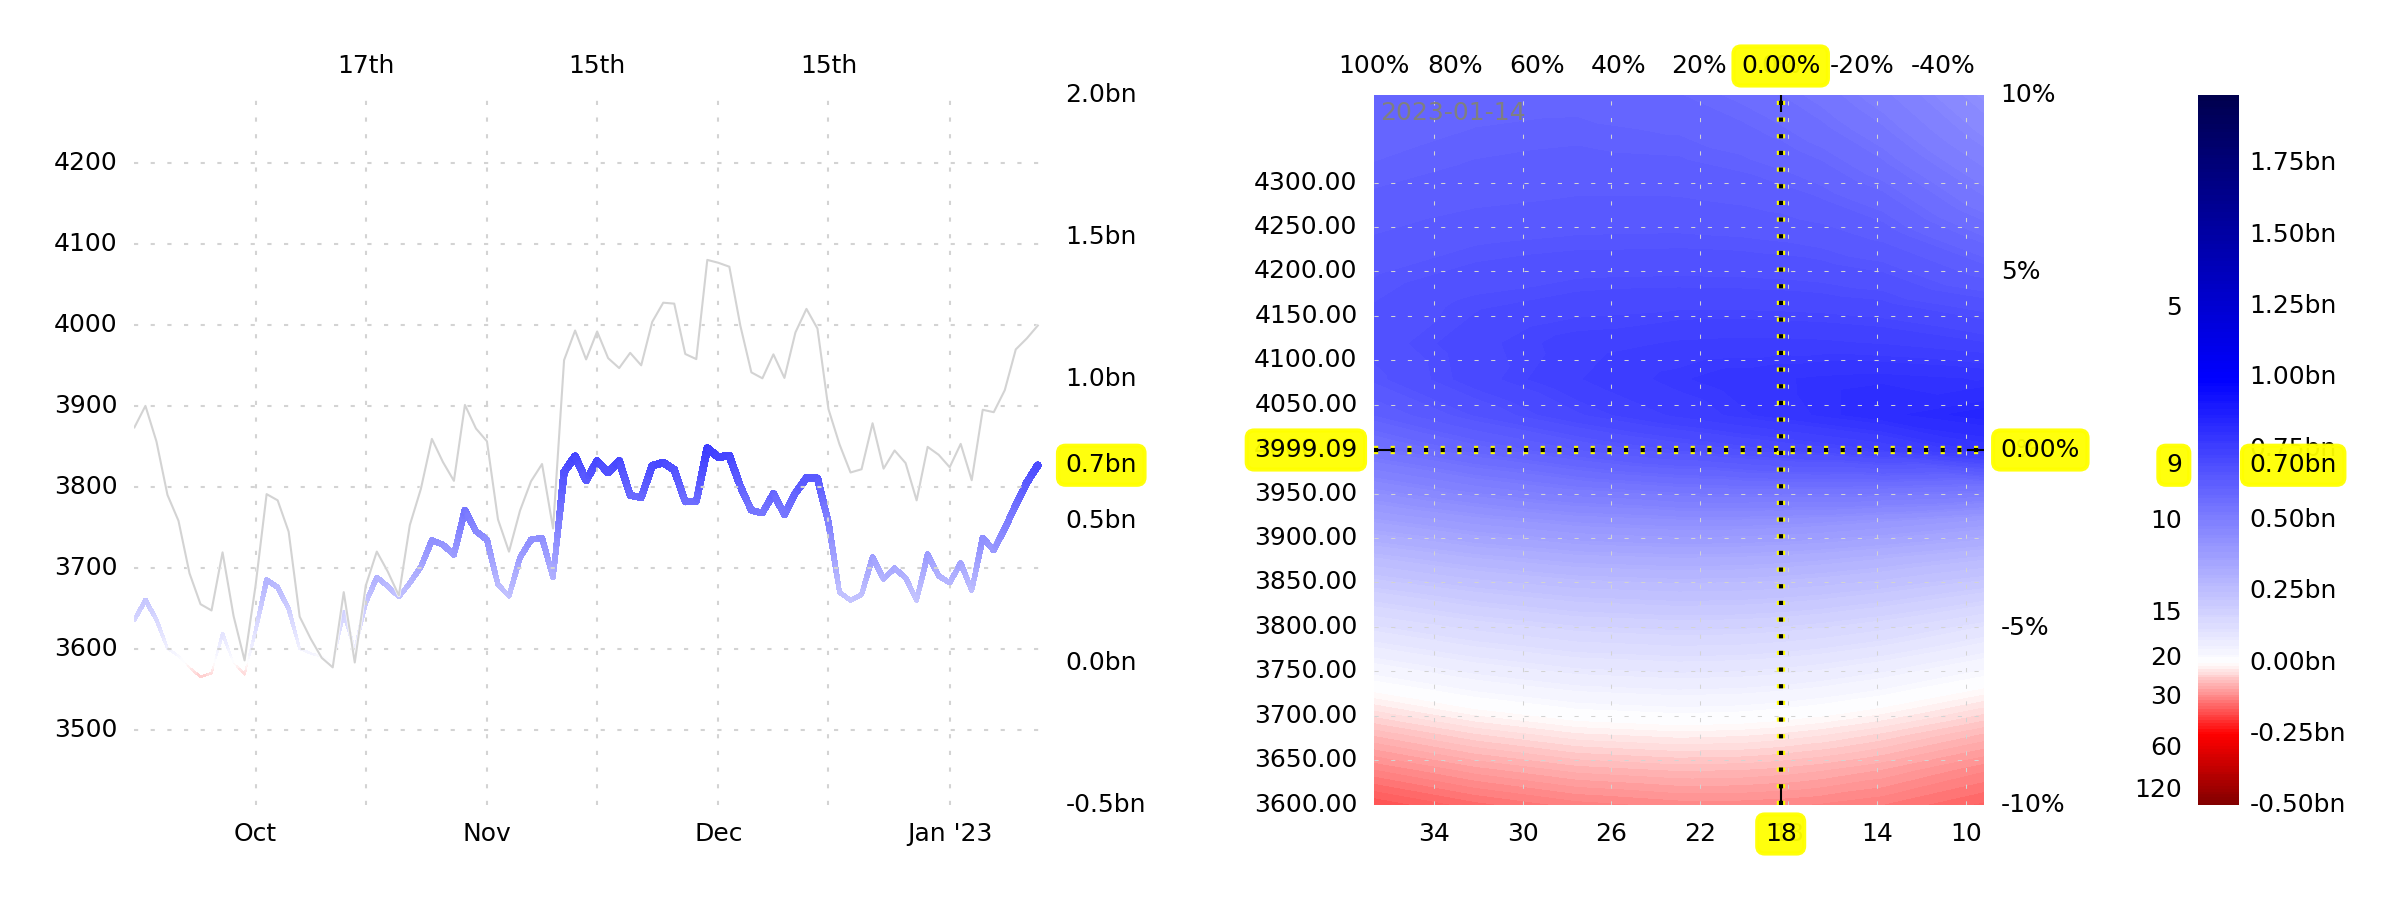
VGR is -10. That's bullish on its own, but if it gets closer to -5, the bullishness goes away. VGR would get closer to -5 if SPX rises another 2–3%. You can see this impact on the step-forward plot, actually (gets red up there).
Another thing is that GEX+ isn't going to keep rising from here. You can tell that from the GEX+ heatmap, which doesn't really get that much blue-er as SPX rises. This means that VIX "ought" not fall more than it already has, because realized volatility simply isn't going to contract any more. This is just another point in favor of the option-buyer.
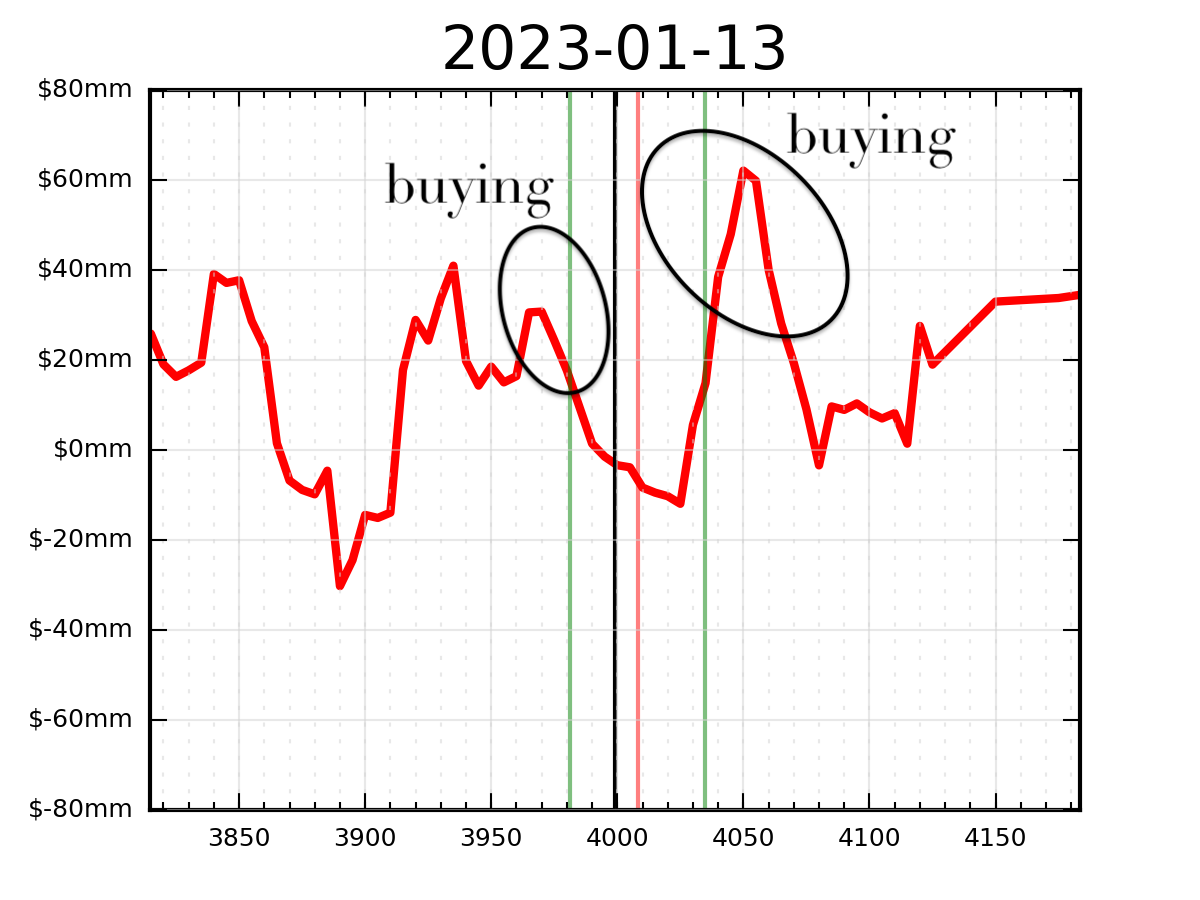
Lastly, it's worth noting that tomorrow's 0DTE dealer buying/selling impact leans gently toward stability and bullishness.
The most interesting feature of this data, though, is that, if SPX has a nice rally all the way up to 4050, it would have an easier time subsequently falling from there (the buying will have been exhausted, and owing to the dealer short gamma that caused the buying, it could turn into selling on the way down).
Altogether, we can believe in the opportunity for some bullishness from here—especially of the strong, quick, choppy upside variety. However, tomorrow, there's a tough hurdle at 4050, and then over the course of the rest of the [short] week, there's a tough hurdle at 4100 (from VGR). At either of these points, we'd rather take the opportunity to get short, or shorter. And, given that vol seems cheap, relative to the range of outcomes, that probably means buying puts.
So we're opportunistically long puts right now (for Friday), and at this rate, we'll probably keep rolling long puts until it works out.
As the old wisdom goes,
The definition of [winning at long vol] is doing the same thing over and over again and expecting a different result.
Speaking of which...
Degeneracy
As we were saying last weekend, while pondering The Degenerate Science:
This is the trouble with "screening for low vol." It's an epistemic shrug. It's reductivist in the same way that believing in undead cats is reductivist. It's lazy. It's defeatist. It's losing the battle before it even begins. There's no progress to be made from "buying a call on XYZ because its 'IV Rank' is really low." To the extent that there's causal inference there at all, it's dismally weak.
Rather, we need to find real, sensible reasons to believe that a the probability density favors buying a particular option. And if our probability density isn't good enough, we can try to do a better job at measuring. The idea of "screening for vol" is defensive, negative. Unfortunately, something that's "cheap" can always get cheaper (especially an option). We need, rather, to be aggressive, positive. We don't care what the option costs, as long as there's some reason to believe it could get way more expensive.
How to accomplish this? How do we go out and aggressively find a long option opportunity? Is this a quantitative question, a qualitative question, or both? How much discretion should we have? Should "narrative" play a role, or should be blindly spray the ask on some stuff that looks like it has potential?
We really, seriously don't know. But we do have one useful tool at our disposal: Robot Jim. So let's ask him what he thinks, and let's ask him by using our API.
Here's a query for the latest data across the ~5000-ticker universe that Robot Jim considers (YOURKEY is on your
Profile page):
https://squeezemetrics.com/monitor/api/latest?format=csv&key=YOURKEY
One of the columns in this data is "VOL", which measures how much we expect the movement in the stock over the next 5 market days to exceed the current volatility. Since we're using mean absolute deviations (MAD) to measure everything, a "VOL" of +0.50 means that we expect the next week's moves to be 0.50 MAD greater than the moves of the prior month. I.e., a substantial (50%) increase in vol.
So once we've grabbed this spreadsheet of "latest" data, let's simply sort by VOL. What tickers have the highest expectations of having an increase in their volatility?
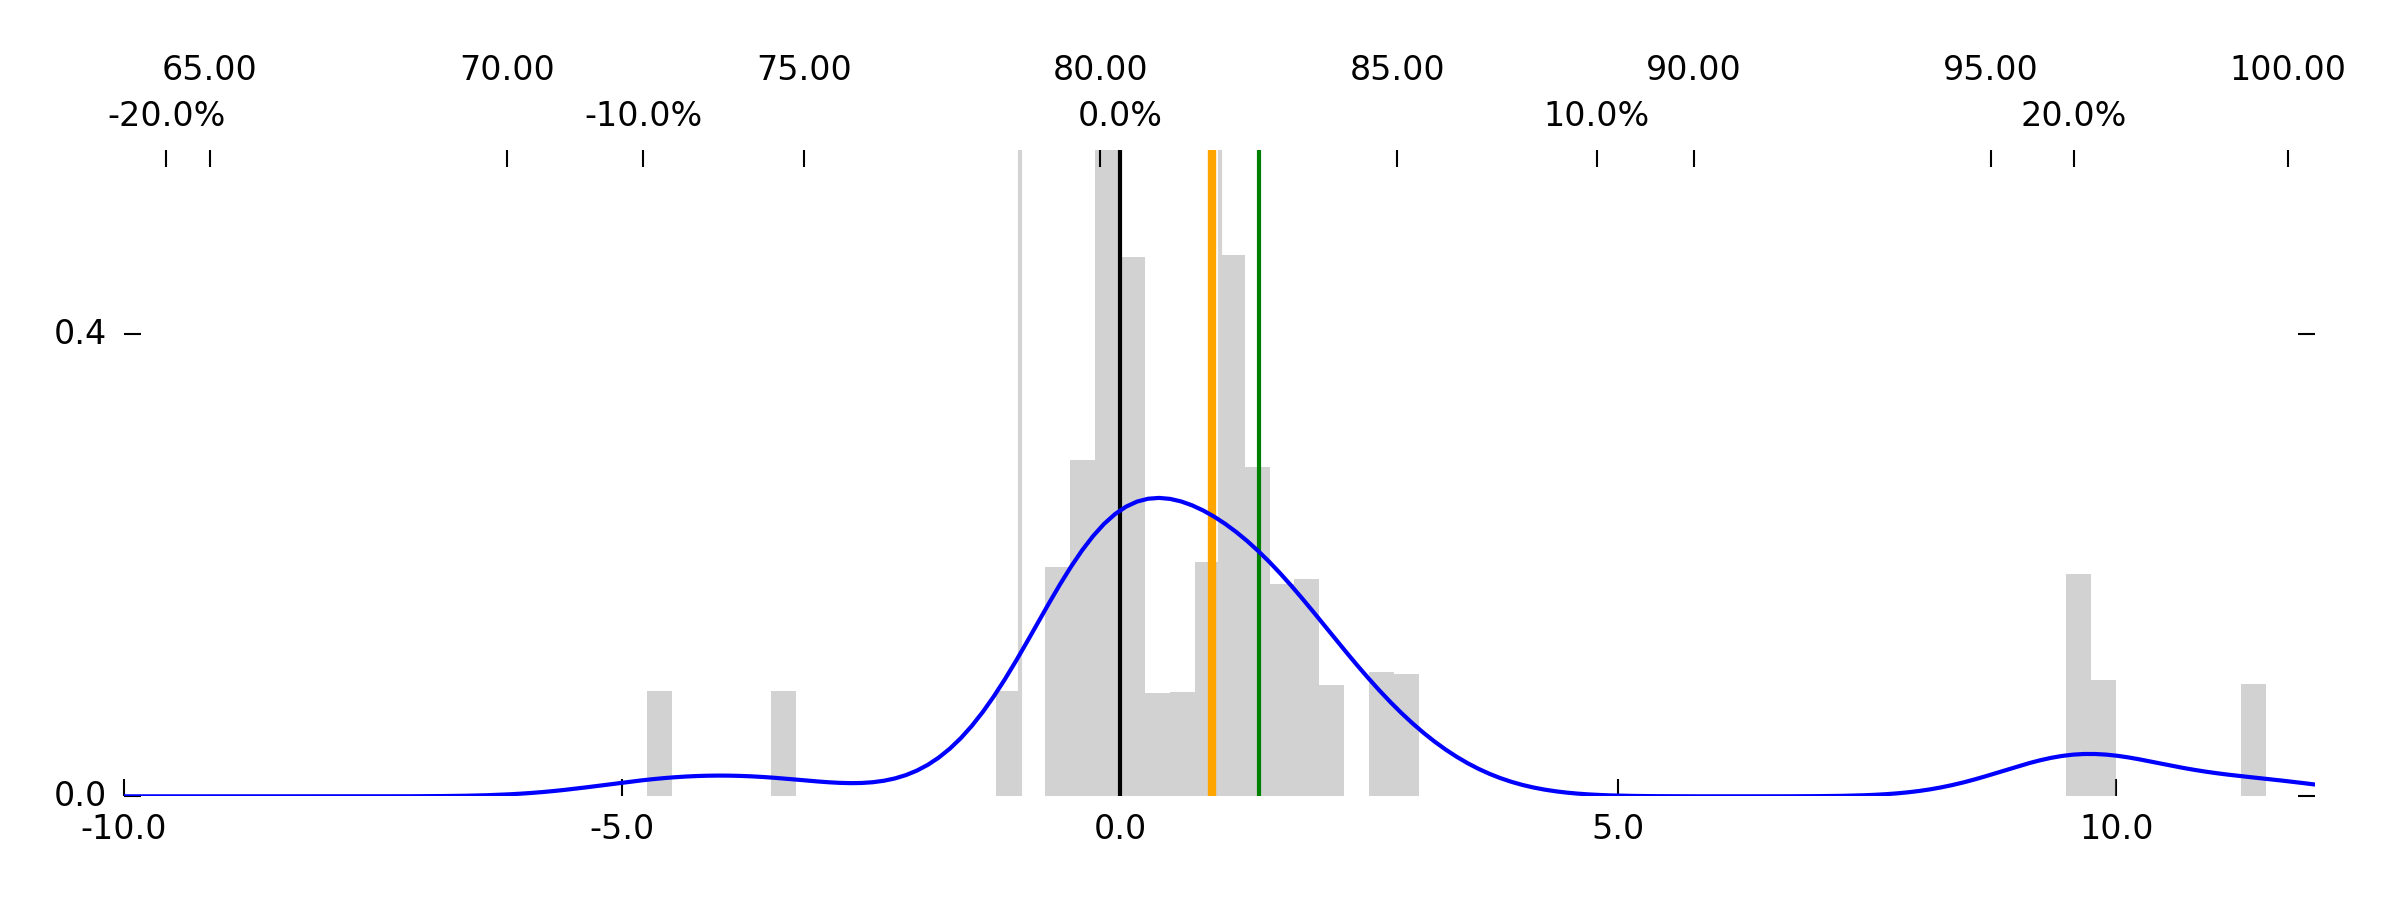
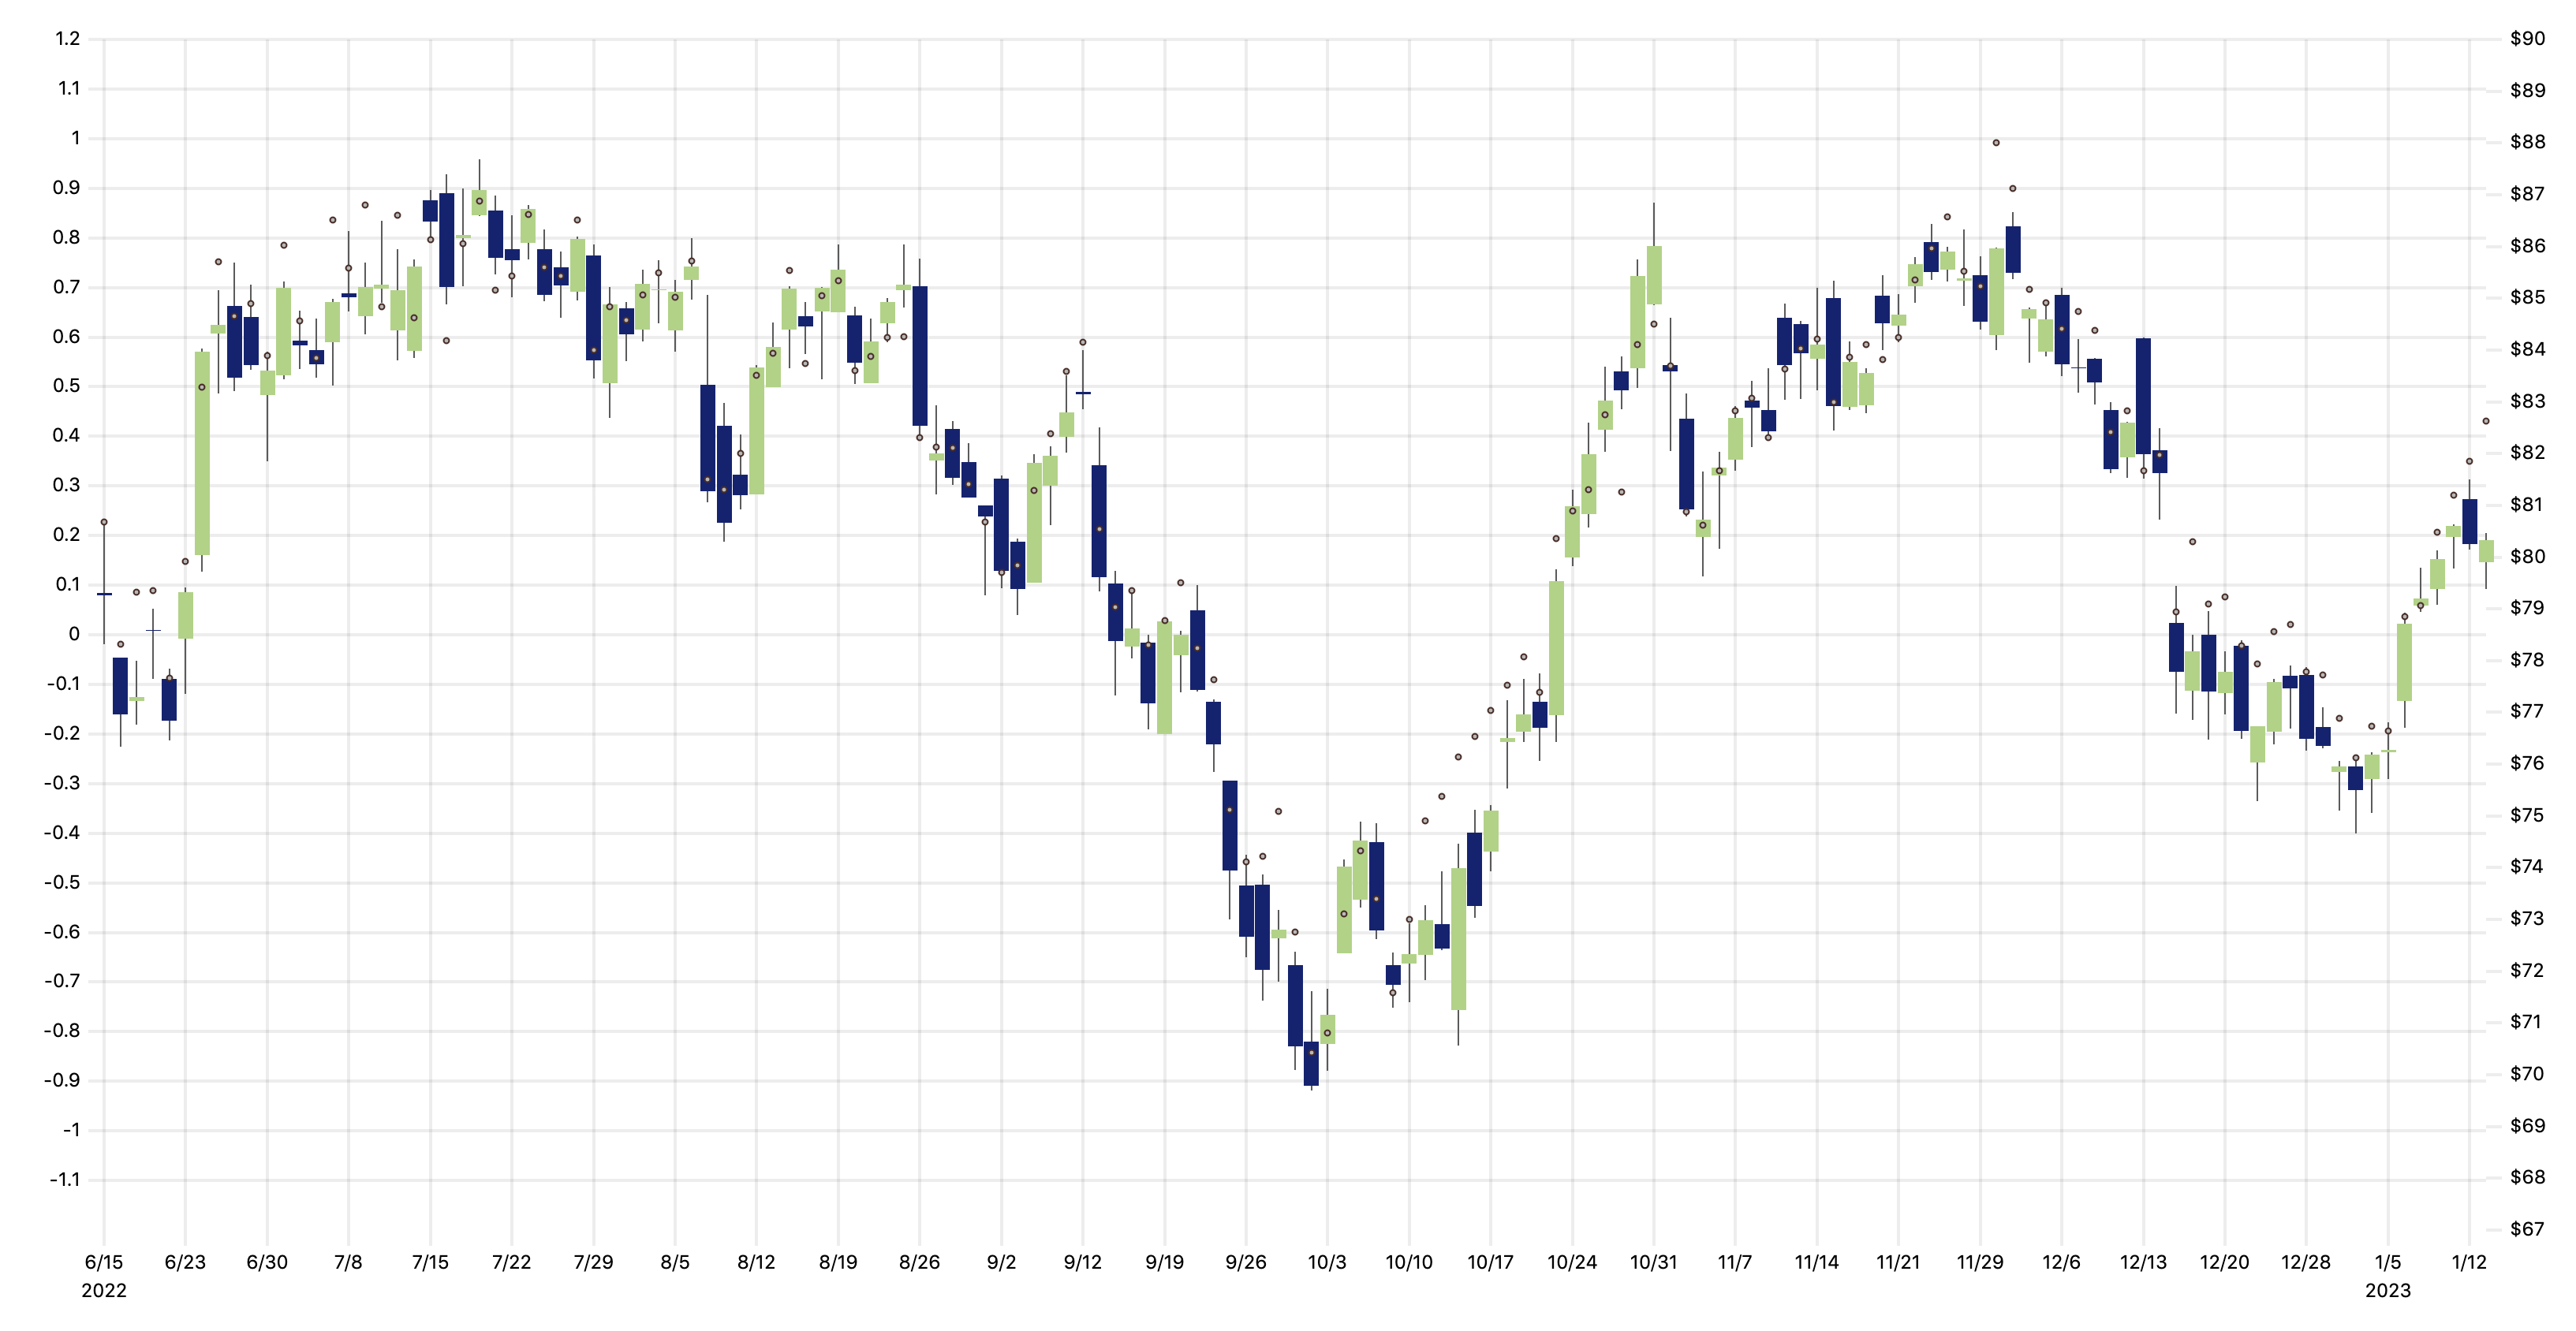
Look, we've outsourced all the hard work! Now let's scan down this list—are there any tickers that we recognize? There's one! SYY - Sysco. It says that VOL is +1.17, which means that next week's volatility is expected to be 117% higher than the volatility of the past month. So, what's the distribution look like that informs this forecast?
Bullish-leaning for sure, and with chubby tails. Could the stock scoot up to $82.50? Sure feels like it, and maybe that'd be a good bet for a call?
Looks decent, though we don't love it.
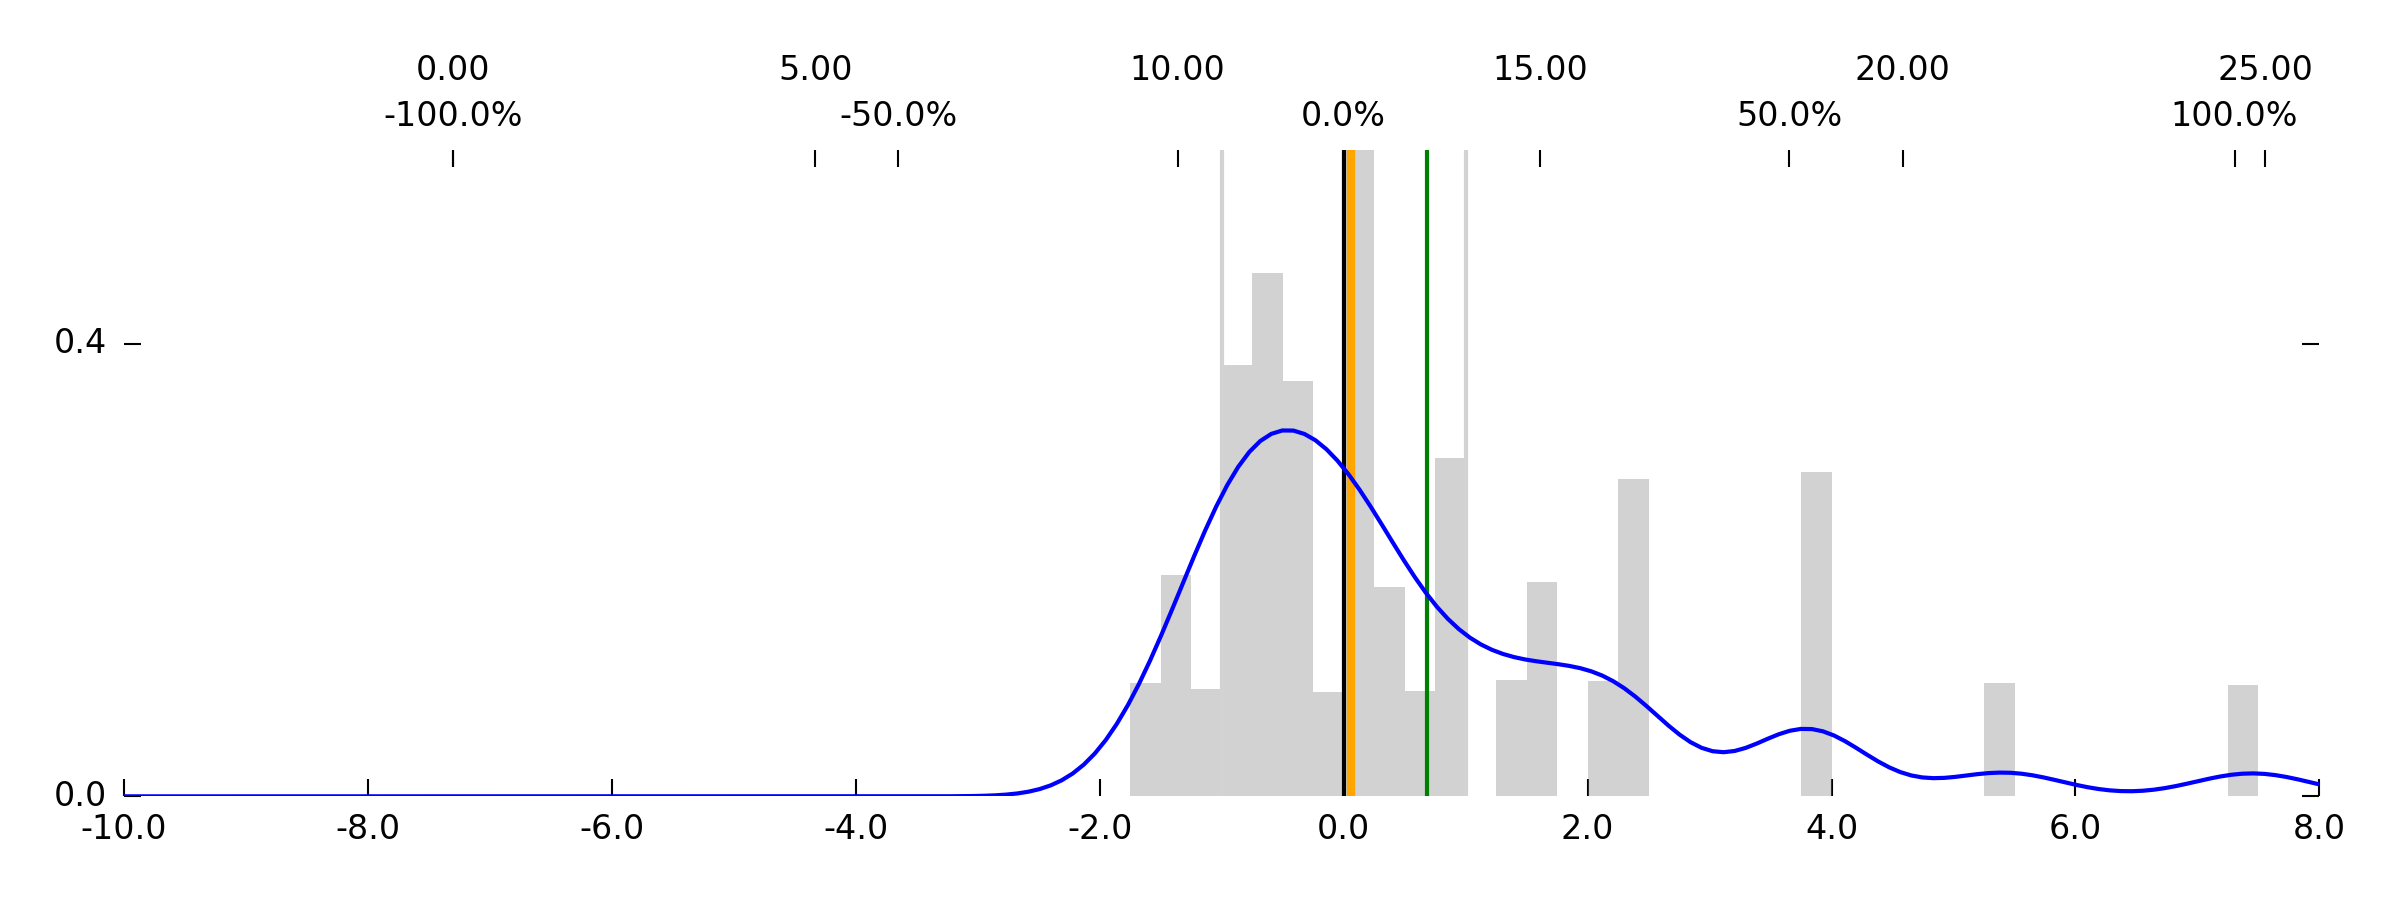
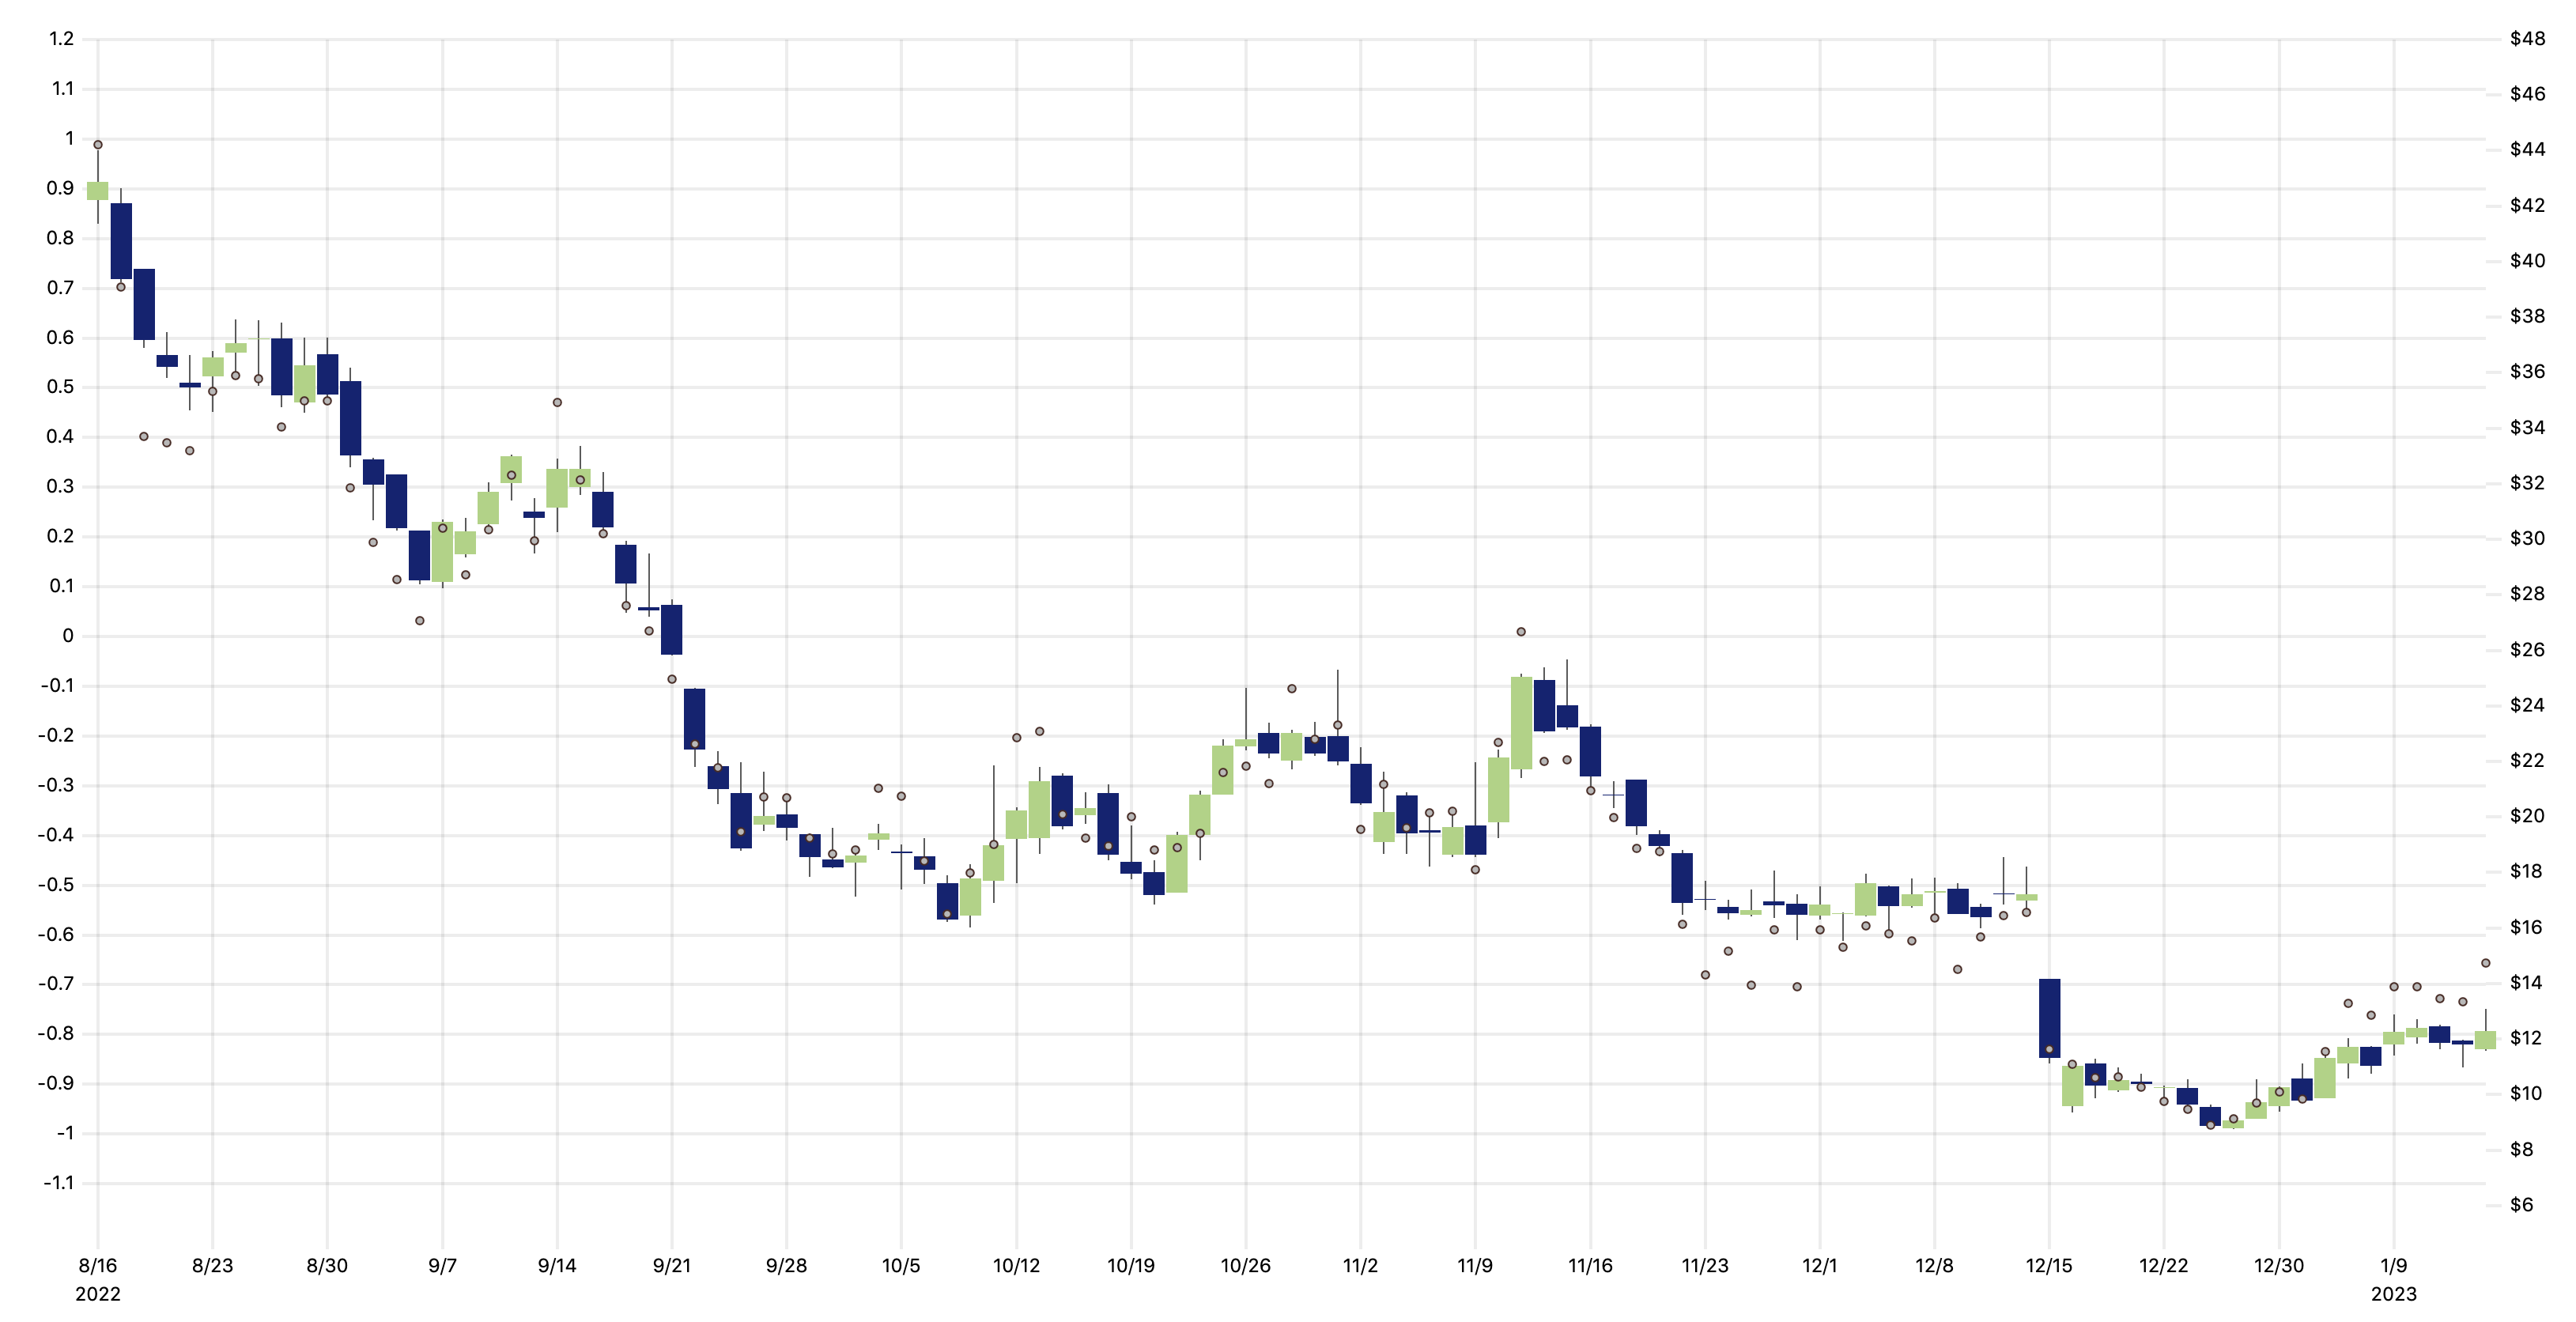
What's the next friendly-looking ticker? Let's see... how about NVAX - Novavax. It says that VOL is 1.033, which is expecting weekly moves to double. What about the shape of the distribution, then?
Oh. Oh! That's attractive. Ridiculously right-skewed. High probability of loss (mode of distribution <0.0%), but a high mean, and a beautiful example of crazy sampled historical gains. Yes, this is the kind of stock (a biotech, of course) that can gain quickly for stupid reasons—and as long as the spreads are decent on OTM calls (and they appear tight!), this looks like a great candidate.
When we look at this data, we feel like we're doing the right sort of thing by buying a call. The stock is "low," Robot Jim's multidimensional Technical Analysis says conditions are ripe for a rally (though it's most likely that it won't happen right now), and a rally could be crazy.
And we don't have to do too much mental gymnastics to see potential "catalysts" and a cool "narrative" here—for a company notably involved in COVID vaccines. Maybe China will say something positive about using Western vaccines, but specifically not mRNA technology. Boom! Maybe the CDC keeps releasing weirdly discouraging news on Pfizer/Moderna vaccines and NVAX gets some attention. Ker-pow! So much of this stuff is "active," narratively, and you can easily imagine something happening.
This seems like a "good idea" to us. A well-formed thesis for punting on a call option. Like Schrödinger said, we want to have a nice, clear snapshot of a cloud; not a blurry, out-of-focus picture. This feels like a snapshot of a cloud. We have a believable probability density drawn from a multi-factor model and a sense of potential causal mechanics.
It makes sense to be long an option on something like this.
Can this process be streamlined? Backtested? Forward-tested? Should we try to quantify "narrative" stuff? What about digging deeper into option flows to look for confirmatory signals?
We can imagine this going in many directions—but for now, we're just going to try buying options on things and thinking about it. We'll let you know exactly how much money we lose.
Enjoy the week!
The SqueezeMetrics Team