All the charts and data we refer to can be found on the Yacht Club page.
Hey everyone,
The last two weeks haven't worked. We've been "Strategically" short the S&P since around 4000, and it's moved a hundred points against us since then. We're not actually going to complain about this, though (2023 has been pretty kind to us so far).
What we are going to complain about is the sudden return of FOMO noise. There are a couple of very loud, competing siren songs that have tickled our ears just in the past couple days—coincident with stocks going up, of course.
One of those songs is that the Fed has, in fact, done QE (through BTFP), and that's gotta be bullish risk-assets going forward (and... inflationary?). The other song is that AI is going to make us all rich (except for the entire middle class, which will be unemployed [deflationary?!]). It's a confused mixture of chatter, and in a moment of weakness, you might think it's worth listening to.
Rather than attempt to untangle the tortured logic of this week's manic ex-post commentators, though, we're going to fall back on our own simple-minded logic, which implies that the last three trading days were pretty much exactly what you'd expect in a "bear market rally," and that it strongly resembled what we've already seen in 2022 and 2023.
Which is to say that while we may have finally been caught on the wrong side of a decent trade—nothing seems to have fundamentally changed.
So in the spirit of our simple-minded logic, let's take a moment to [somewhat tangentially] highlight a simple, old-school data point that we've been quietly watching in the past month.
But first...
- LOL
- MEH
- VRP
LOL
Index up 3.48% on the week is pretty significant, in our estimation; but we're holding a fixed-risk short SPX delta position, so we're just losing money the conventional way. What was interesting about this week, in retrospect, is how the JPM collar—destined to be rolled on the 31st and telegraphed to everyone in the industry—lost some money the unconventional way, and in so doing, contributed greatly to the week's S&P outperformance.
An apt quote, from a friend:
Sometimes, very rarely, you feel the whole market part like the sea to reveal a single overexposed player. And then come together, as one, to attack them.
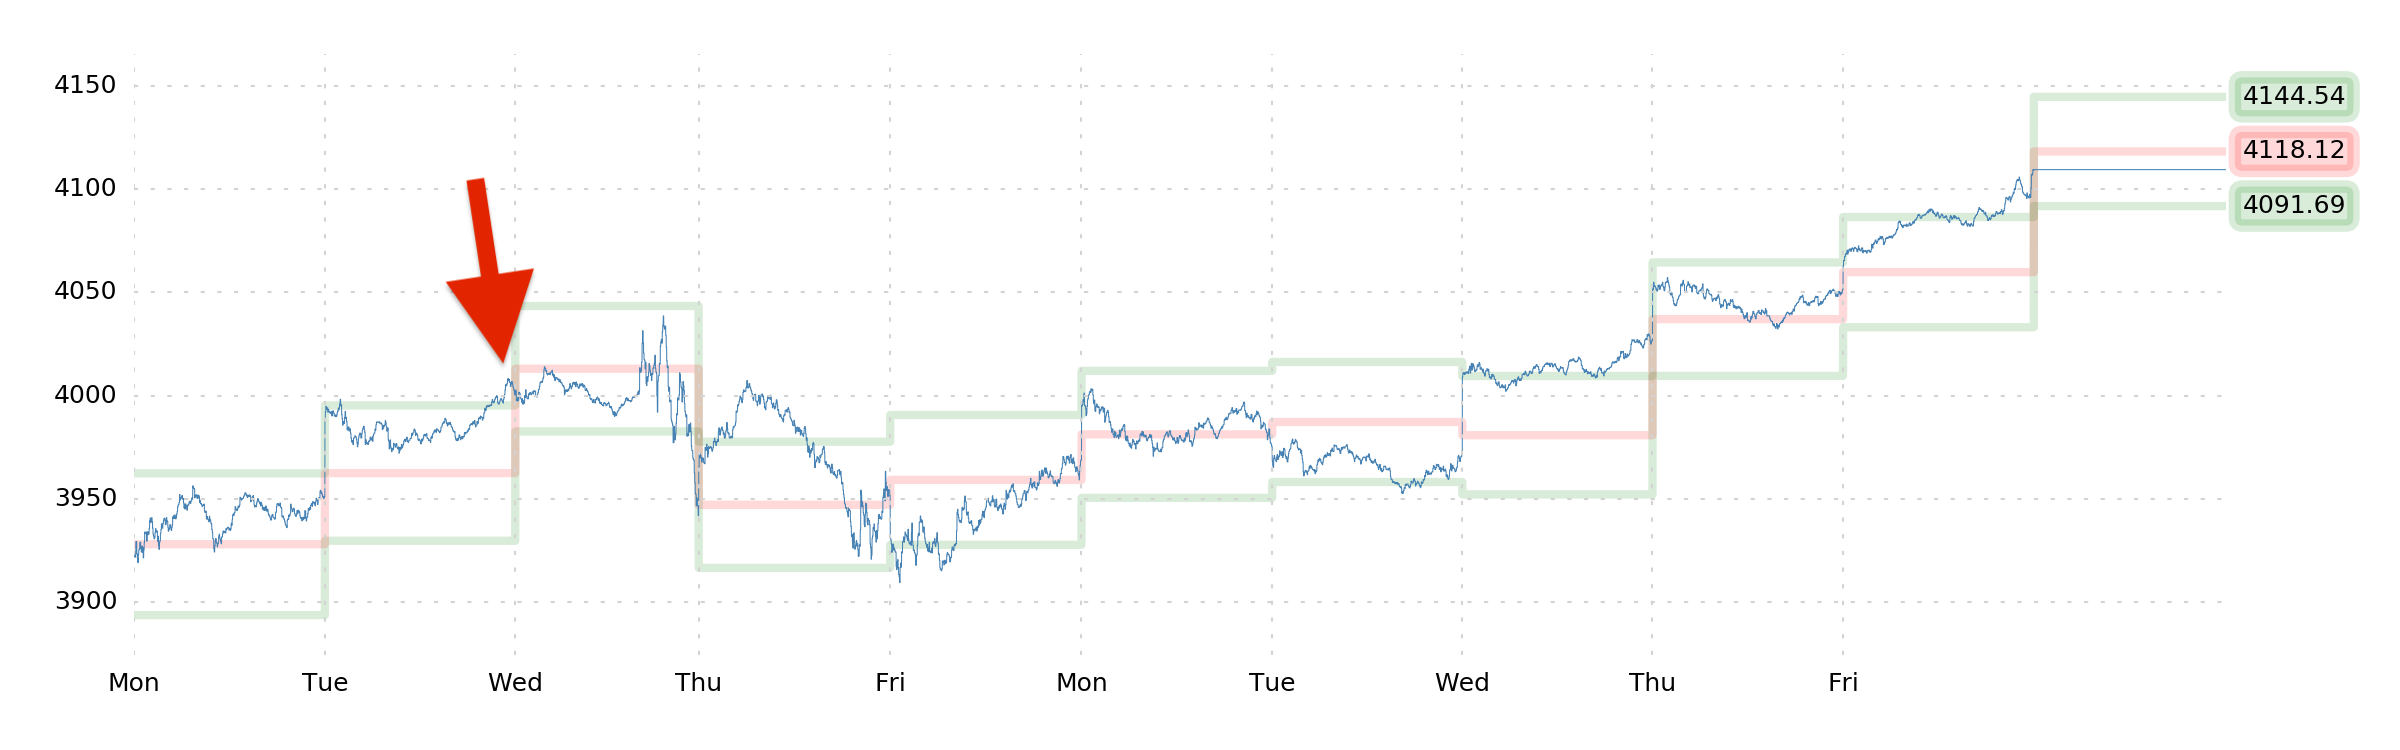
Pretty much all of Friday's 1.44% gain was ostensibly squeezing JPM's (JHEQX) oversubscribed SPX collar strategy. The short call strike at 4065 has long been a totem for silly market commentary ("it'll pin there, it's gonna pin, look out for the pin"), and to an extent the dealer long gamma at the call strike has become a self-fulfilling prophecy. But until now, the awareness of the collar hasn't hurt JPM's fund. Friday was the first time it's happened: Folks genuinely frontran the roll and cost the fund some meaningful performance.
Two things can really hurt the JPM collar: If SPX shoots above the call strike before the roll is accomplished, causing the short call to lose money; and if SPX drops and pins the put strike before the roll is accomplished, causing the put to provide no principal protection.
People are now clearly aware of this new game (let's call it "Pop the Collar"), so keep it in mind. Moving on...
MEH
After this week's silliness, we intuitively want to get really short the S&P 500; but while we've maintained some significant short delta (and long vega), the same thing keeps happening that stops us from getting really short.
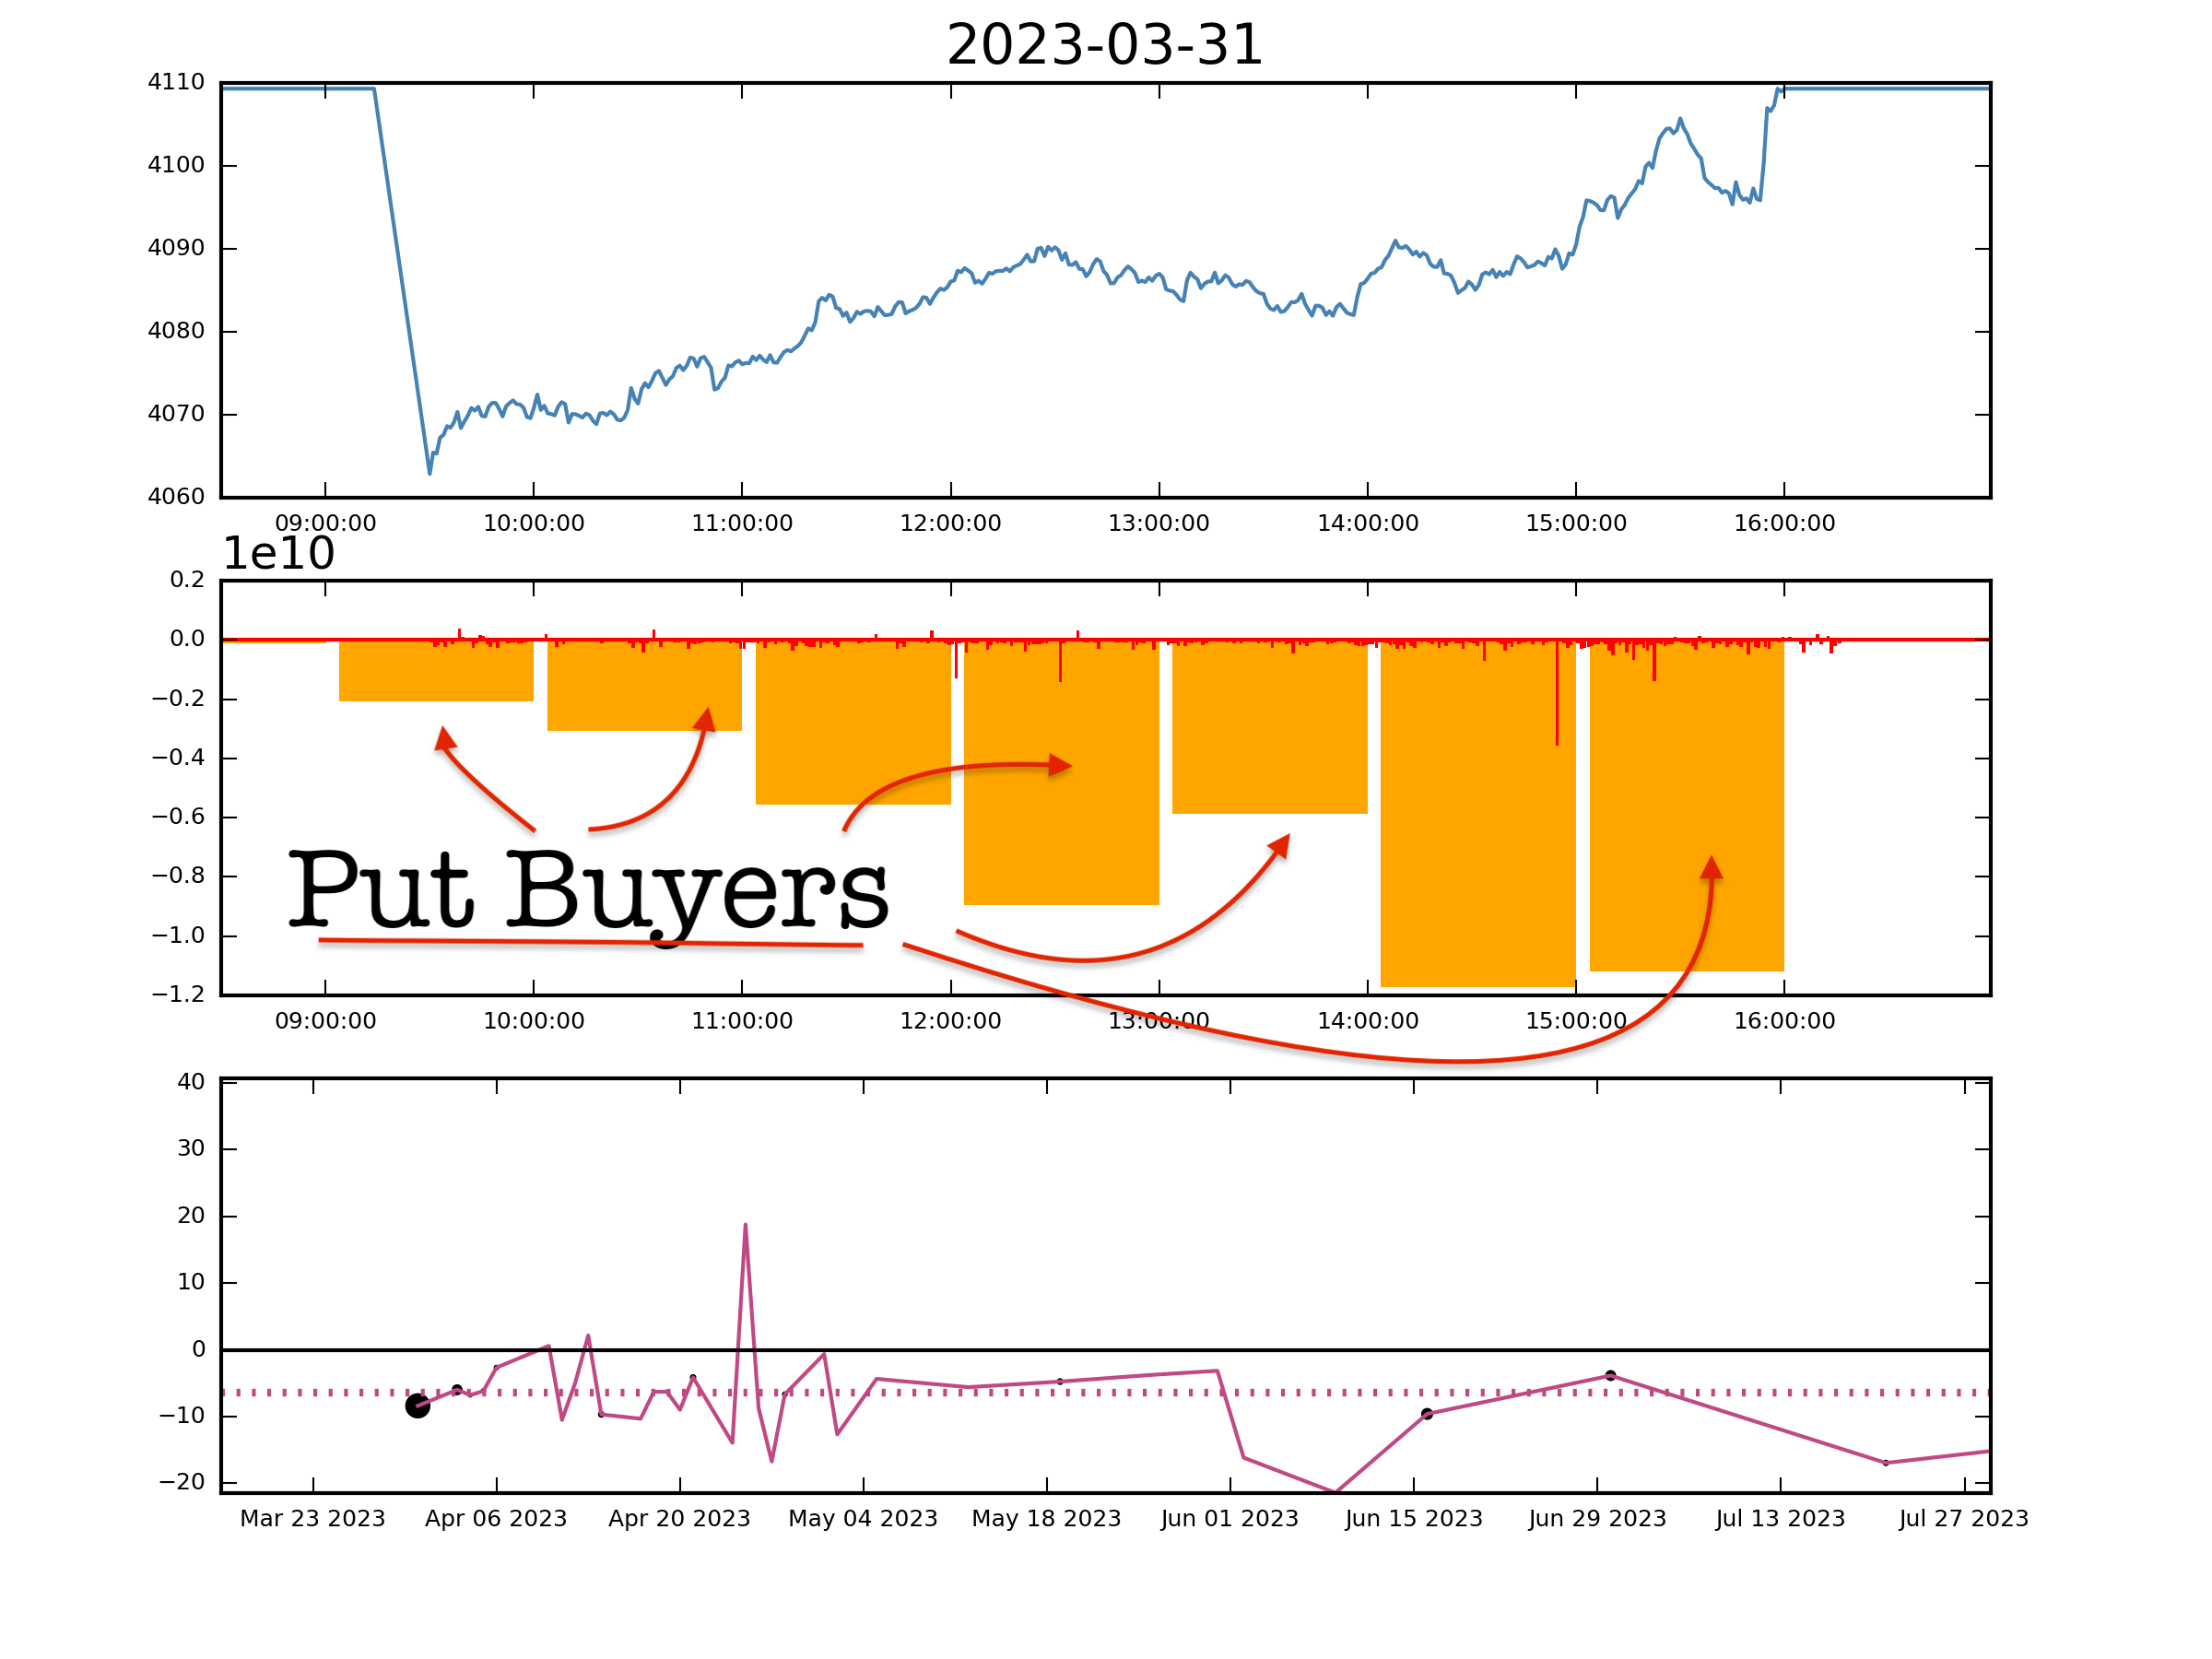
That's right—put-buying. We aren't the only ones who've been skeptical of this rally, and with a bit more intensity than we've seen in a while, folks have been buying puts to bet against it.
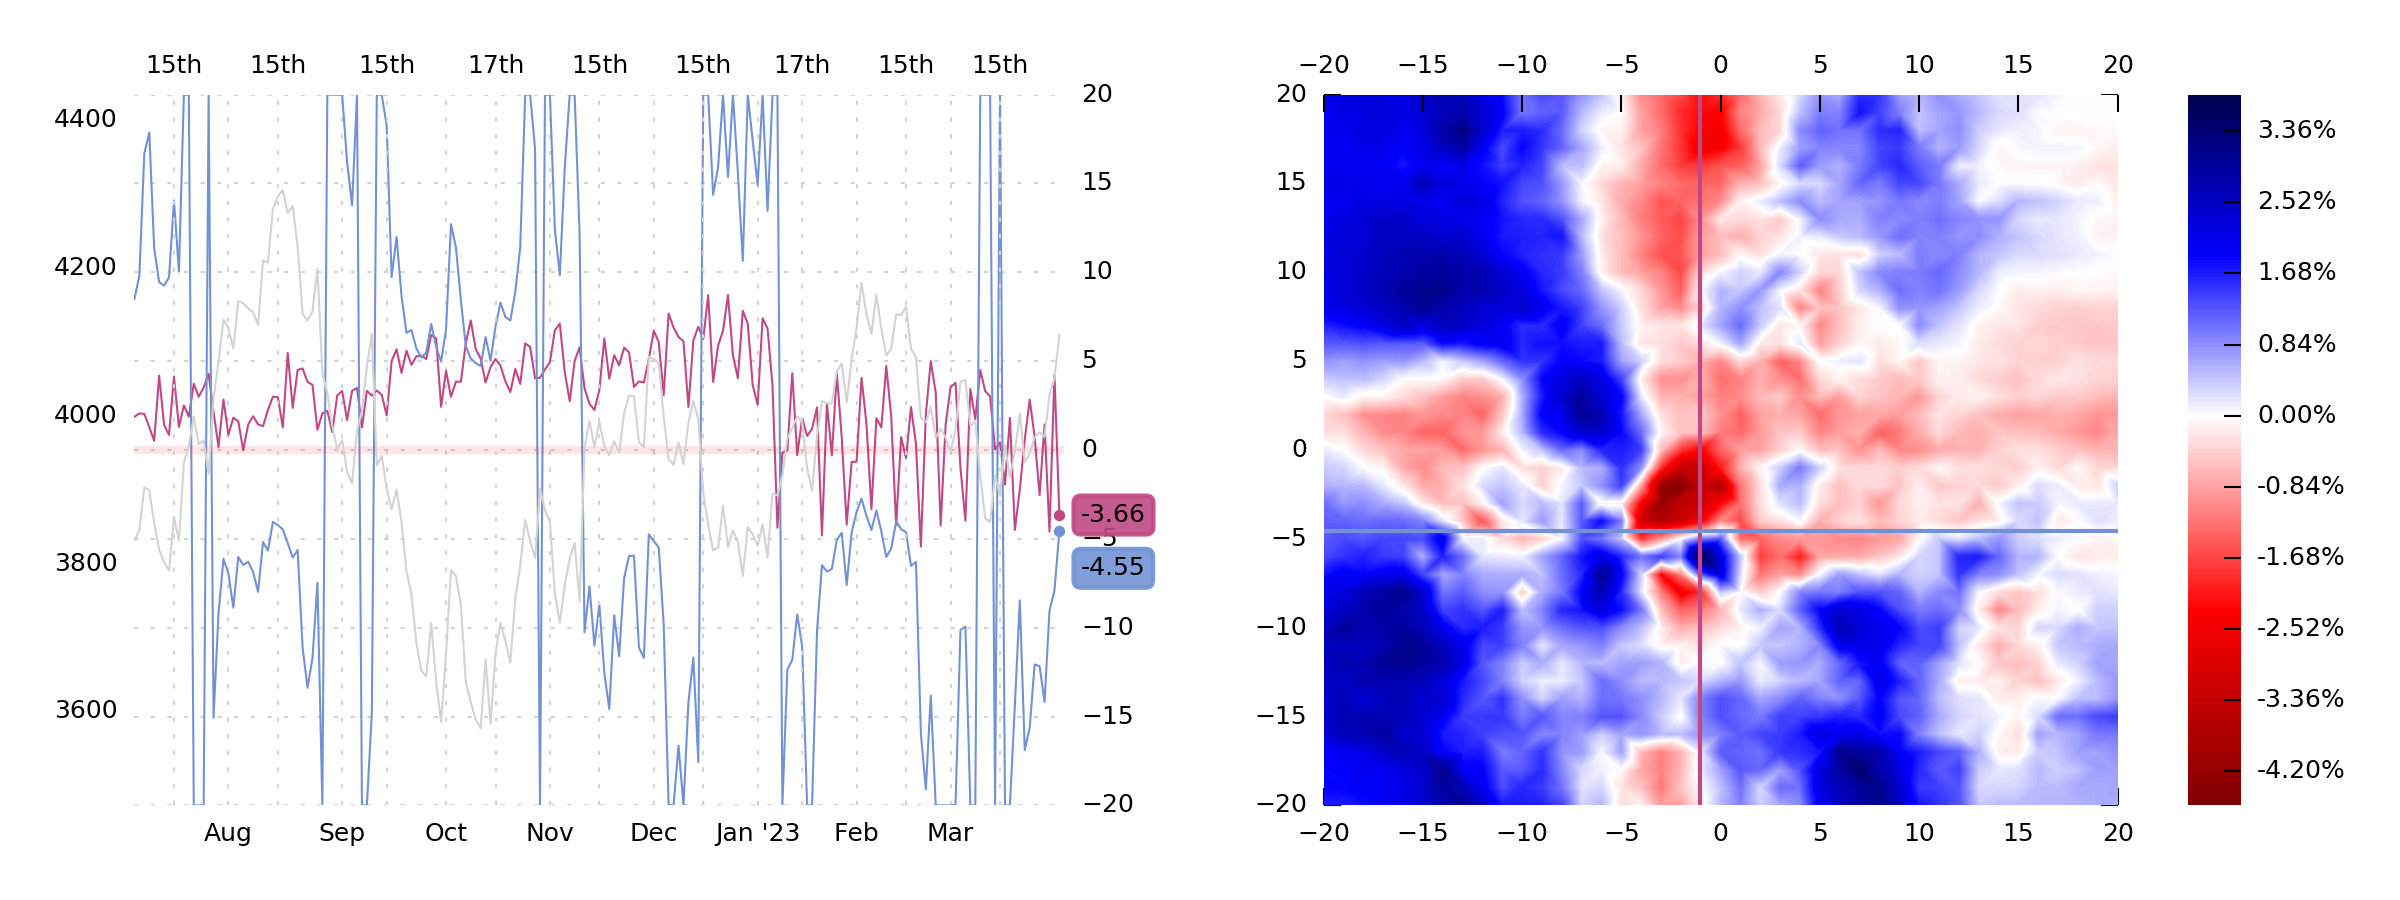
Now, granted, Friday's activity only added up to -3.66 NPD, which isn't enough net put-buying to sustain a passive, bull-market bid in the index (that historically requires more like -5 to -10), but it's still been enough to support the S&P and create some overnight gaps up (which we haven't had much of in 2023).
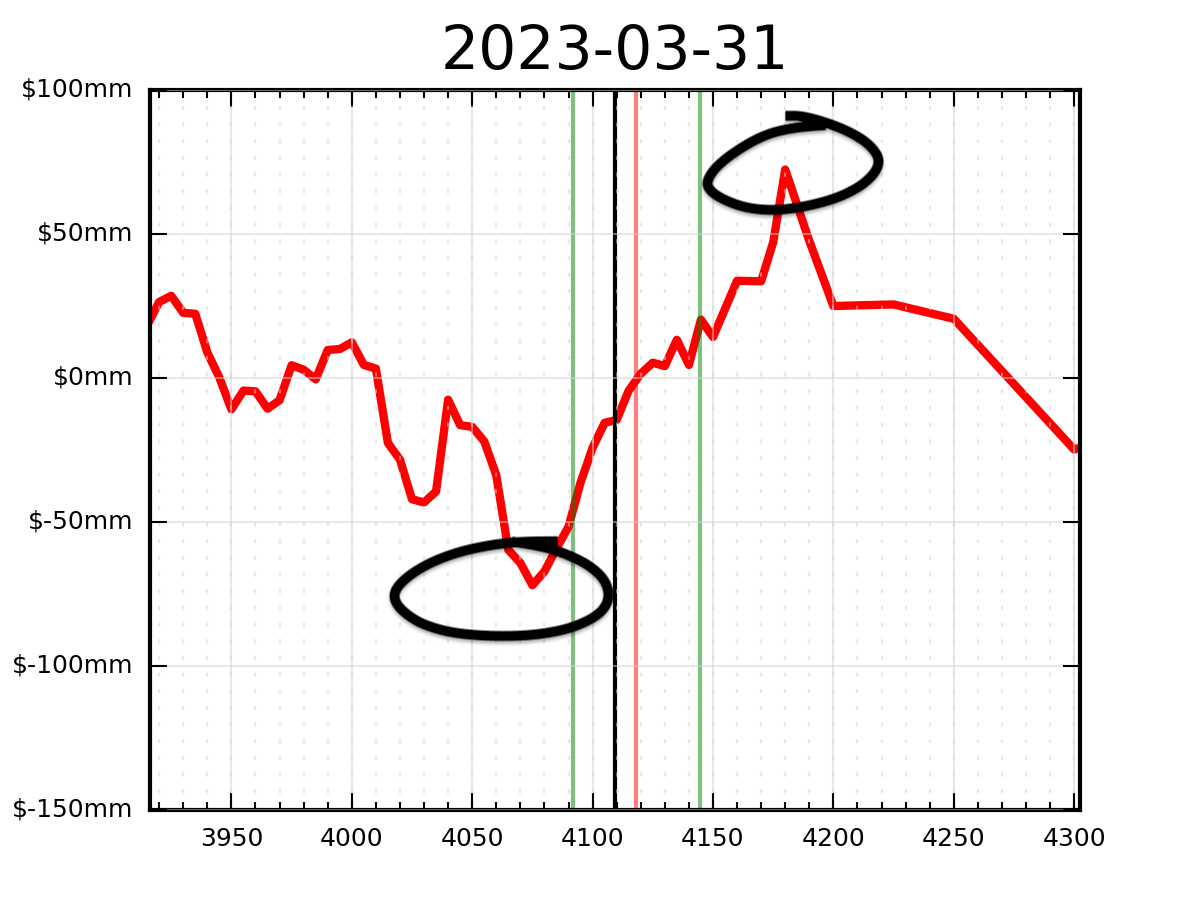
It's also been enough to make the 0DTE dealer gamma situation repeatedly look like this (here's what to expect on Monday):
From the look of it, any Monday selloff loses steam around SPX 4075, and is likely to find support there. A rally, though, can take the index all the way up to 4180 before dealers stop hedging in the same direction as the market. This is obviously a net bullish scenario—and this bullishness is all the fault of put-buyers. Oh, sweet irony.
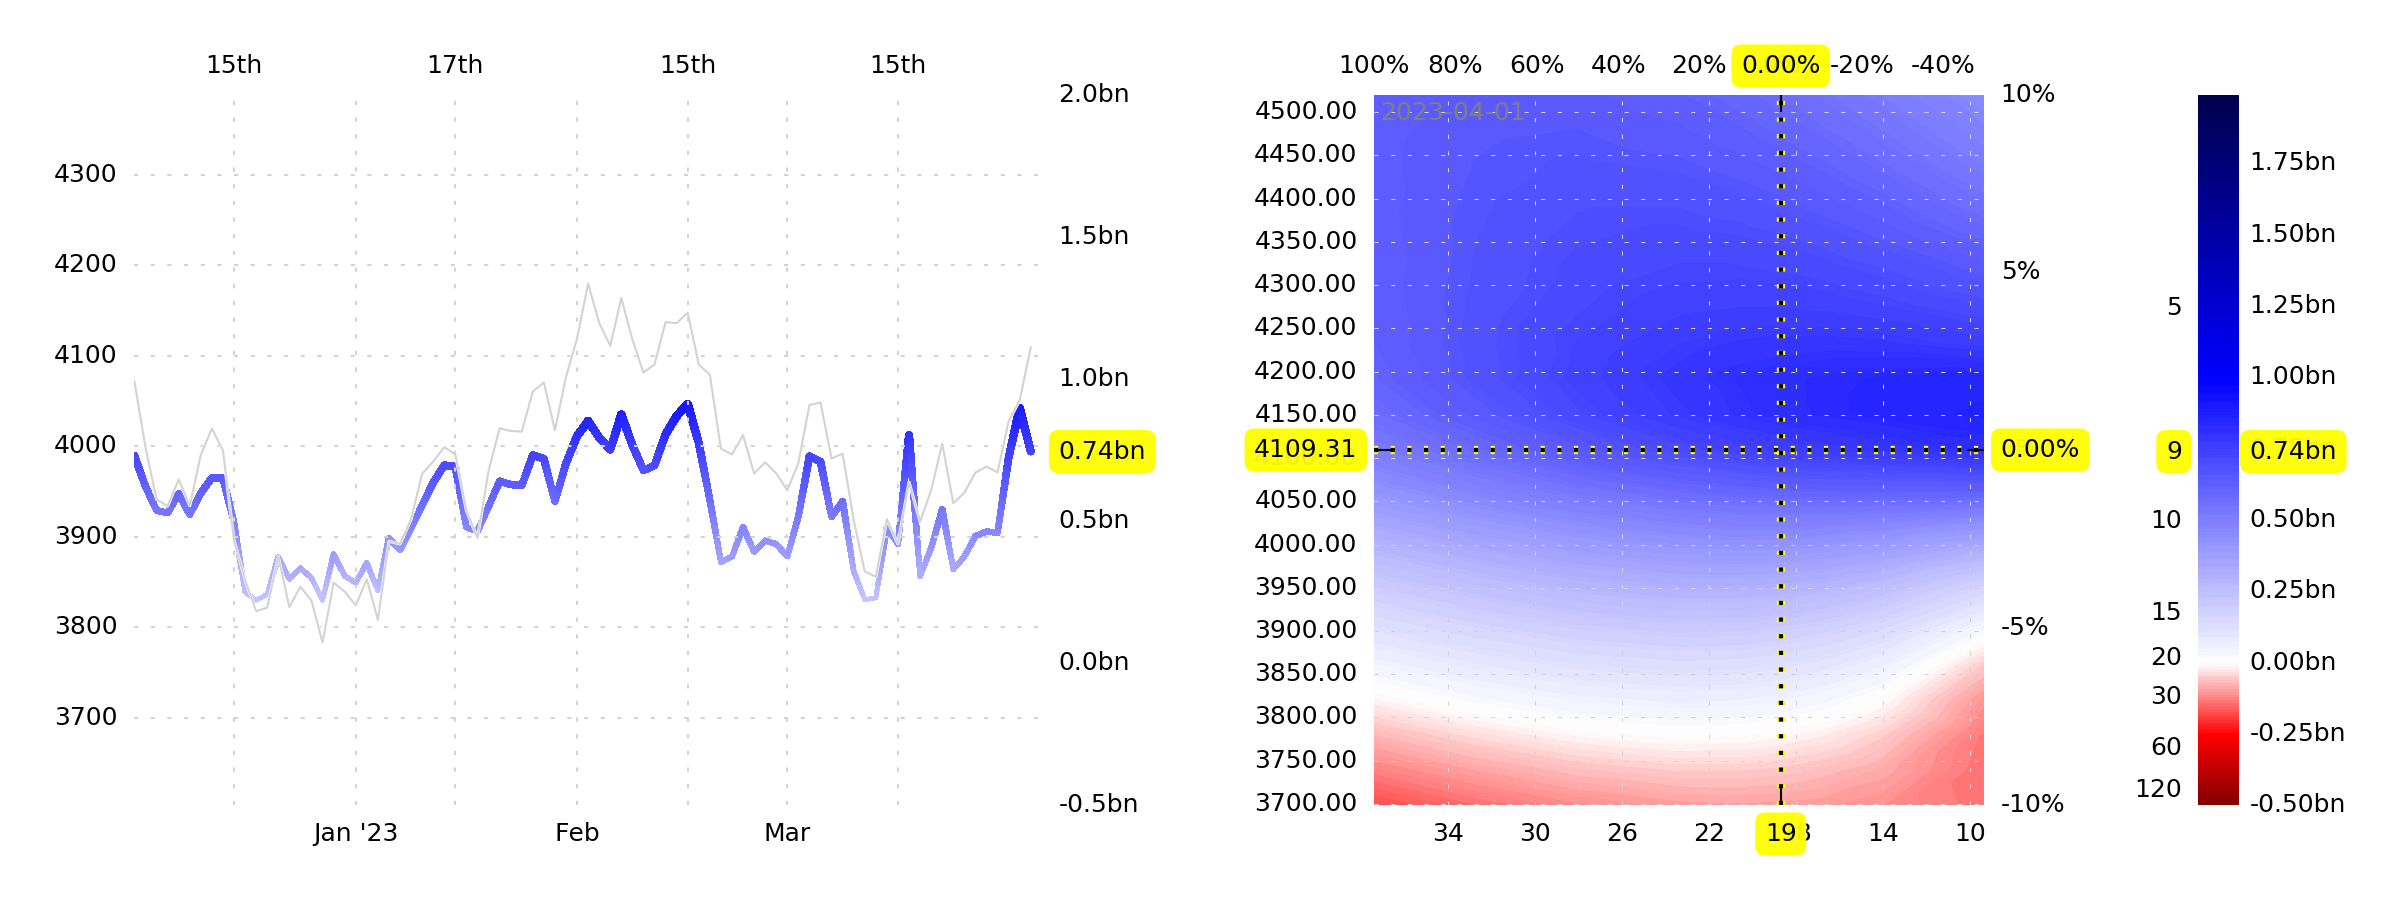
But even if there's some bullish leaning on the 1-day timeframe, we have to qualify, at the same time, that the 1-month outlook is not so sanguine. To start with, current GEX+ liquidity doesn't get better as SPX rises from here.
Indeed, recent history has seen GEX+ top out below $1bn. There just aren't enough call-sellers to create that pattern of dealer long gamma and better liquidity above spot, and to keep IVs falling as prices rise.
Then there's NPD and VGR.
The 5-day average of NPD is just below 0, and VGR is -4.55 right now. You can see that VGR hasn't been able to get any closer to 0 than this lately, and somewhere around -5 is where the index has tended to turn over. You can also see that the "crosshairs" of the NPD/VGR heatmap place us—for the first time in a while—on the edge of the Truly Evil Red Zone. Near-zero NPD and [0, -5] VGR are a dangerous combination for 1-month returns, and this frequently precedes volatility spikes.
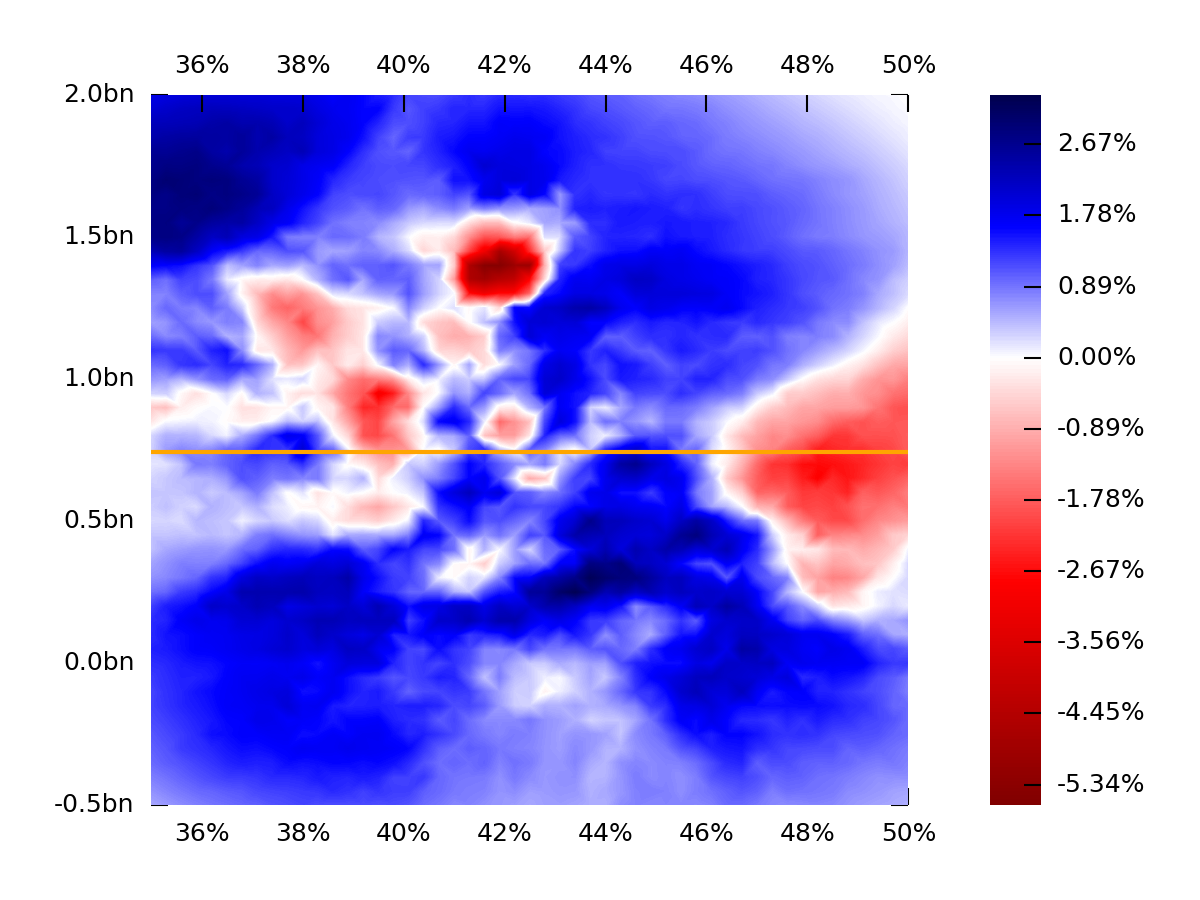
Then, lastly, there's the DIX/GEX heatmap, which we've referenced a couple times already in 2023.
When DIX is around 50% (far right on the x-axis) and GEX+ is middling, 1-month returns have been pretty bad. This has been a feature of this bear market. What we're seeing right now appears to be no different than what we've seen before.
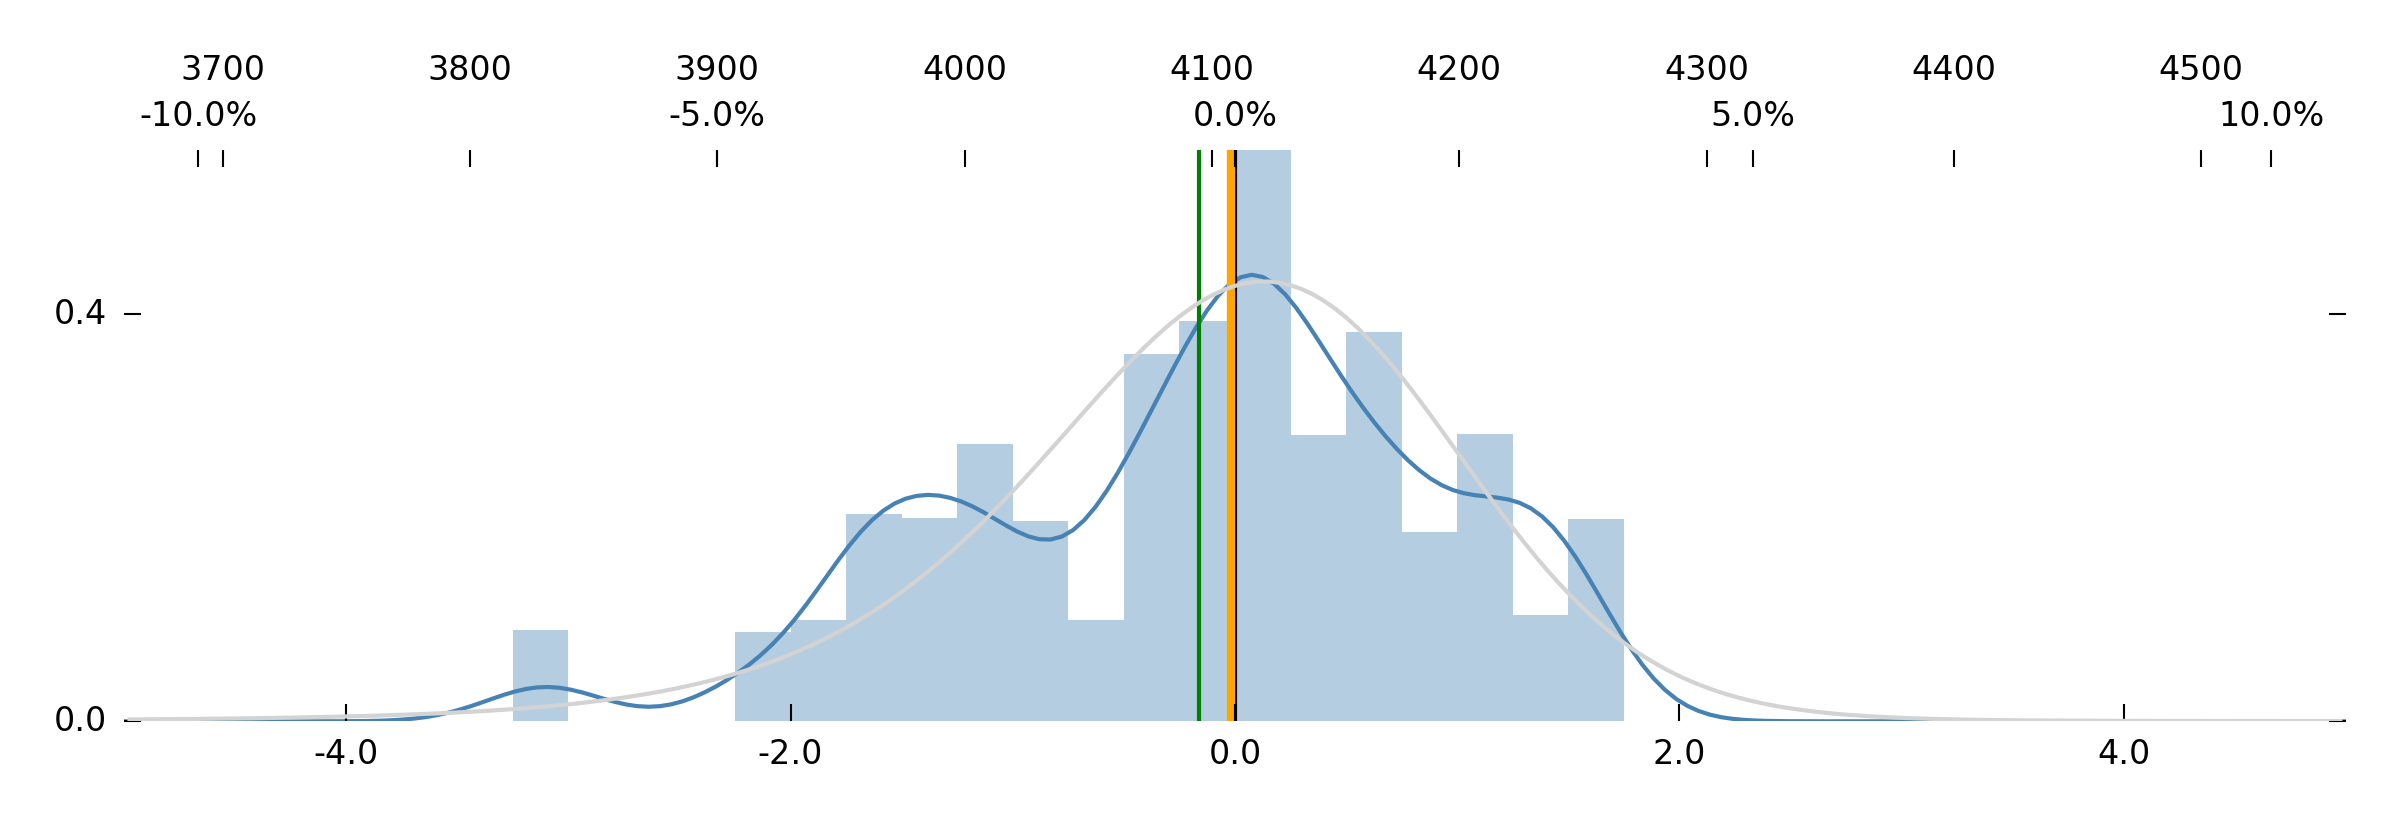
What about the space between the 1-day and 1-month forecast, though? Well, that's what Robot Jim specializes in, and here's his 1-week forecast.
Meh.
The mean is below zero, but it's a very "well-behaved" distribution with no particularly interesting features.
Now let's completely get away from the FOMO noise and the artificial intelligences and the Fed and all that nonsense and let's talk about that old-school data point that we never talk about, and why it caught our attention recently.
VRP
The Variance Risk Premiun (VRP) might be one of the most ancient, fundamental things about vol and option markets, but people (unless academics count as "people") tend to not talk about it—in the same way that people tend not to talk about "vol cones" and other stuff that was popular in the 1990s. The concept of the VRP is that, generally, options are more expensive than they "should" be—and that, more or less, you can collect a "premium" by being short options.
But that risk-premium varies over time, and, depending on the way that you measure it, it can end up really positive, or really negative, or really neither, at different points in time. There's no particular reason to believe that this should impact returns in the underlying—but in the case of the S&P 500, it does. And so, as with so many other things, we try to keep tabs on it.
We mentioned, way up there at the beginning of the note, that 2023 has been kind to us. One of the reasons that 2023 has been kind to us is that we managed to sell a bunch of our long SPX puts at
a really good time—and one of the [many] reasons that we saw fit to sell those puts was the VRP.
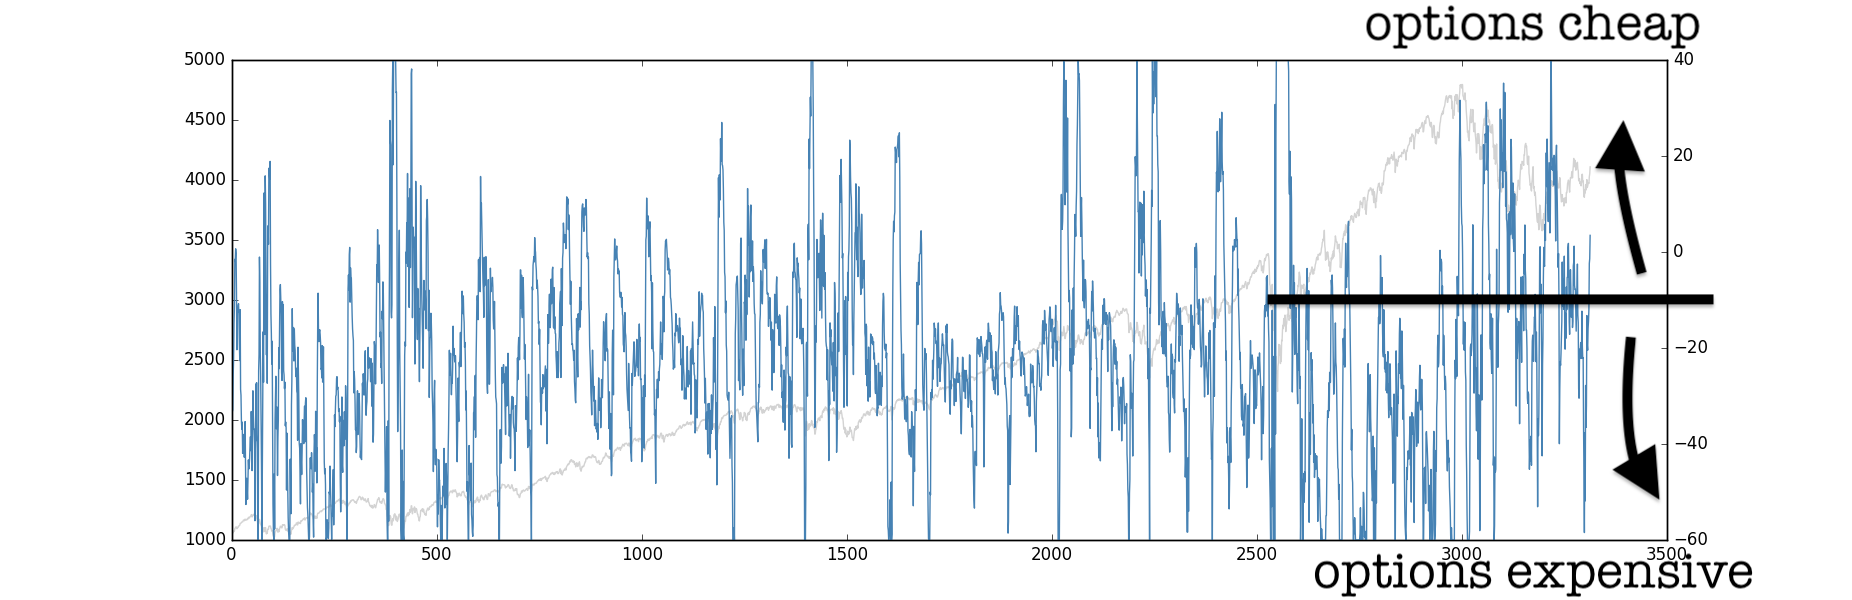
This is [a messy, provisional plot of] what the VRP looks like over time, from 2010 to present (here we're just taking realized vol, expressed in daily basis point moves, and subtracting VIX, expressed the same way):
Note that in most of 2020 to 2021, the blue line was low. Which means that options were expensive (and this is when the S&P 500 rallied). Note also that in 2022 to 2023 [so far], options have been pretty cheap. And it's a choppy bear market.
Of course, "cheap" is relative. We're considering options "cheap" here if realized volatility (looking back a month) is higher than implied volatility (looking forward a month). I.e., when implied volatility (option prices) seem low relative to the amount that the index is actually moving, that's cheap.
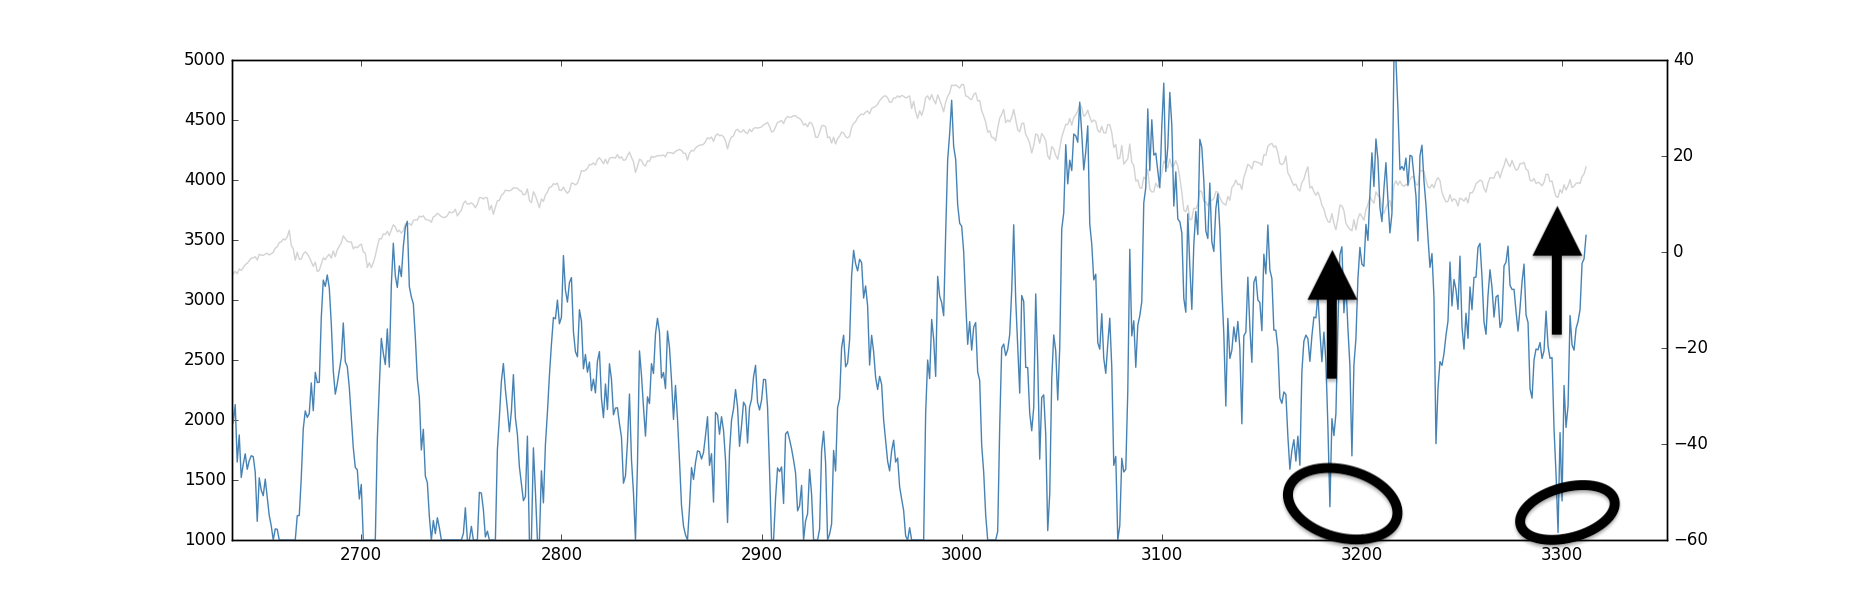
Now let's take that insight with us (that "expensive" options = bullishness) and zoom in on the chart a bit.
Those circled areas are when options are really expensive, which tends to be stabilizing and bullish. The most recent example coincided with our
3/12 Sunday note, where we said that Robot Jim thought vol looked rich, and we were taking profit on the puts.
Does Robot Jim consult VRP, or any data like it? No, he doesn't, but we still like to consult it on occasion. Like so many other old-school data points, it's mostly ignored—yet it provides an awful lot of color.
Perhaps this data deserves a place in our pantheon. What if we plotted it with VIBE on the Chart Appendix?
Oh yeah, and part of the point of bringing all this stuff up is that the VRP is at 0 right now. That means that option prices are "fair," and leaning toward being too cheap. So, again, that's not bullish. Indeed, it's one of the features of a bear market.
Enjoy the week!
The SqueezeMetrics Team