All the charts and data we refer to can be found on the Yacht Club page.
Hey everyone,
Sometimes you have to wait longer than you'd like.
This is the platitude that will carry us through today's fruitless reflections, because not only did the S&P 500 thumb its nose at us this week, but our ambition to reshape the Yacht Club page has also resisted our charms. We've scrapped our first attempt.
Nevertheless, we're excited to begin thinking about signal-hunting in SPX, since it's been quite a while since we worked on finding any vol or directional edge in the index. Yes, most traders would consider this a fool's errand—but we are fools.
So let's get a little bit ahead of ourselves and think about where signal will appear in today's market.
But first...
- Hypnotic
- Neurotic
- Quixotic
Hypnotic
Ok, so obviously we wanted the index to go down this week.
And obviously it didn't.
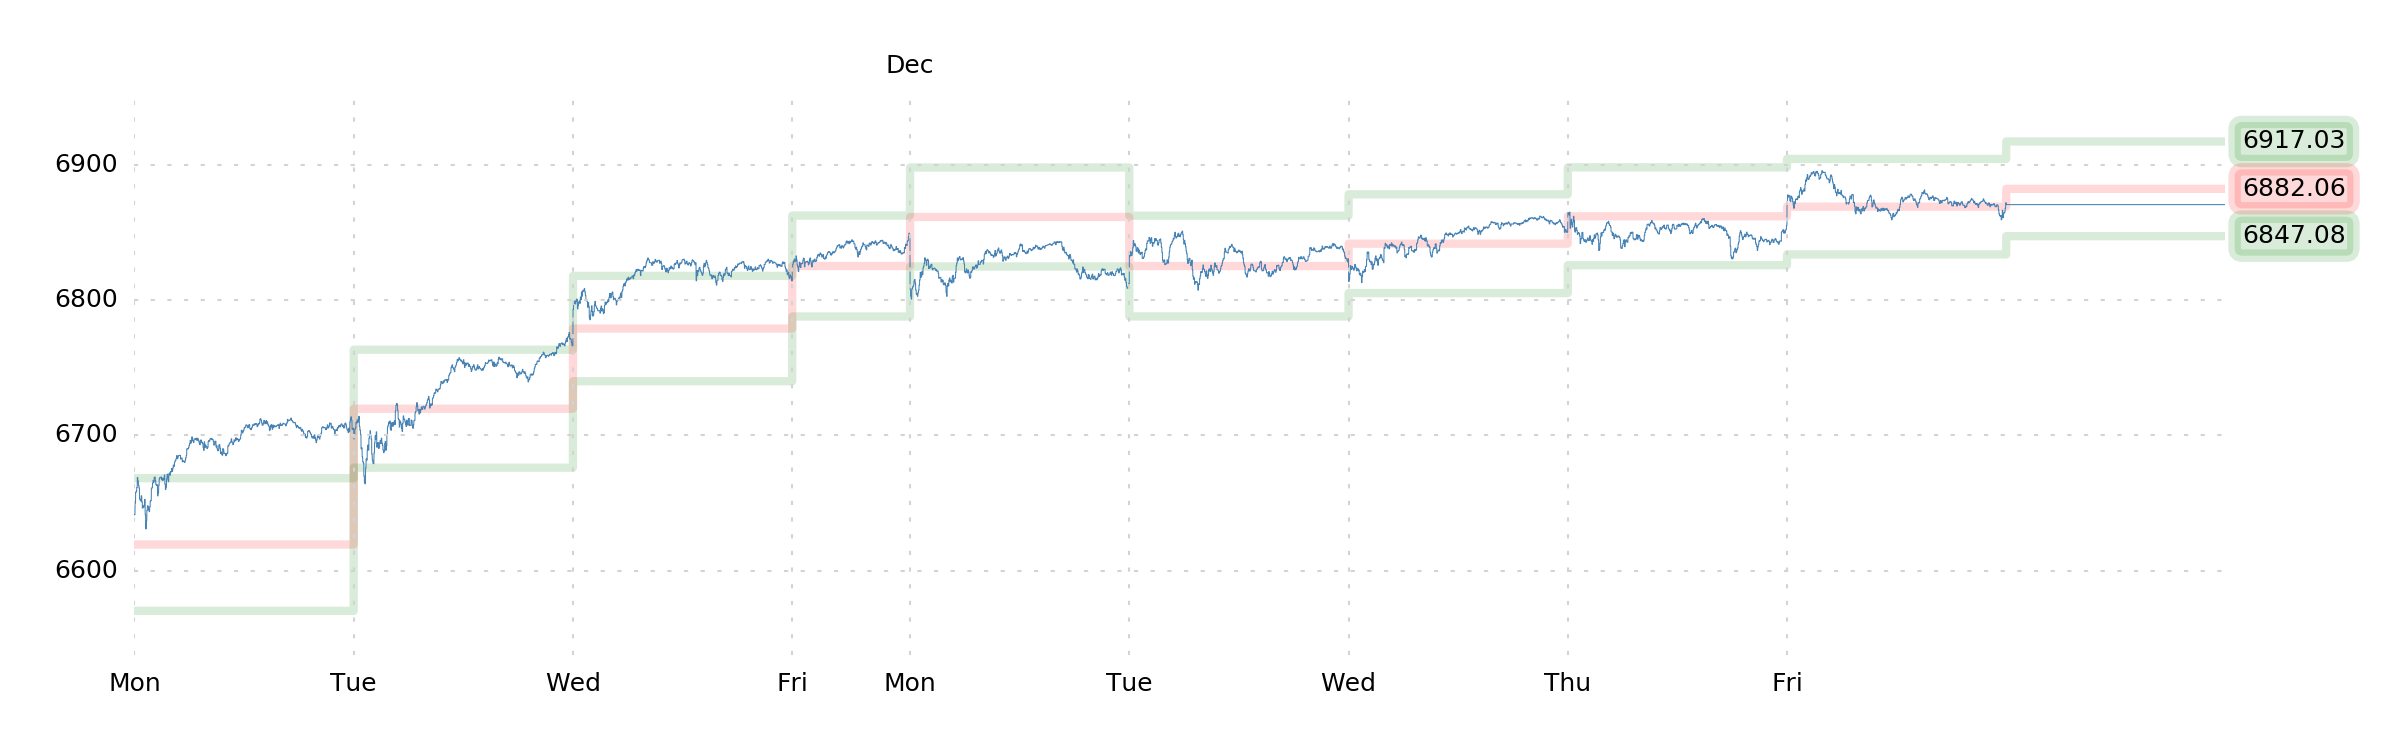
But wow, look at that price-action. Monday was the only day with price moving [marginally] outside of the SuMo bands, and there was hardly even a whisper of a trend. It was just... silence.
Notably, every day featured a 0DTE dealer hedging map with selling into rallies. This is not the norm, and it suggests that there were short-term ~ATM call sales being rolled by customers, with dealers accumulating the long gamma. As such, we surmise that there was minimal interest in long index calls from professional SPX punters, which is itself strange to see in short-term options (not implying it's bullish or bearish—just unusual).
Of course, we left off feeling like it's a great time to be long puts...
Long puts at 6700 is an easy decision for us. More 1-month options, since with VIX at 16, we want the vega.
We feel, unusually strongly, that this is the right time.
...and we still feel that way.
Neurotic
Will this anxious price-action give way to what we're positioned for?
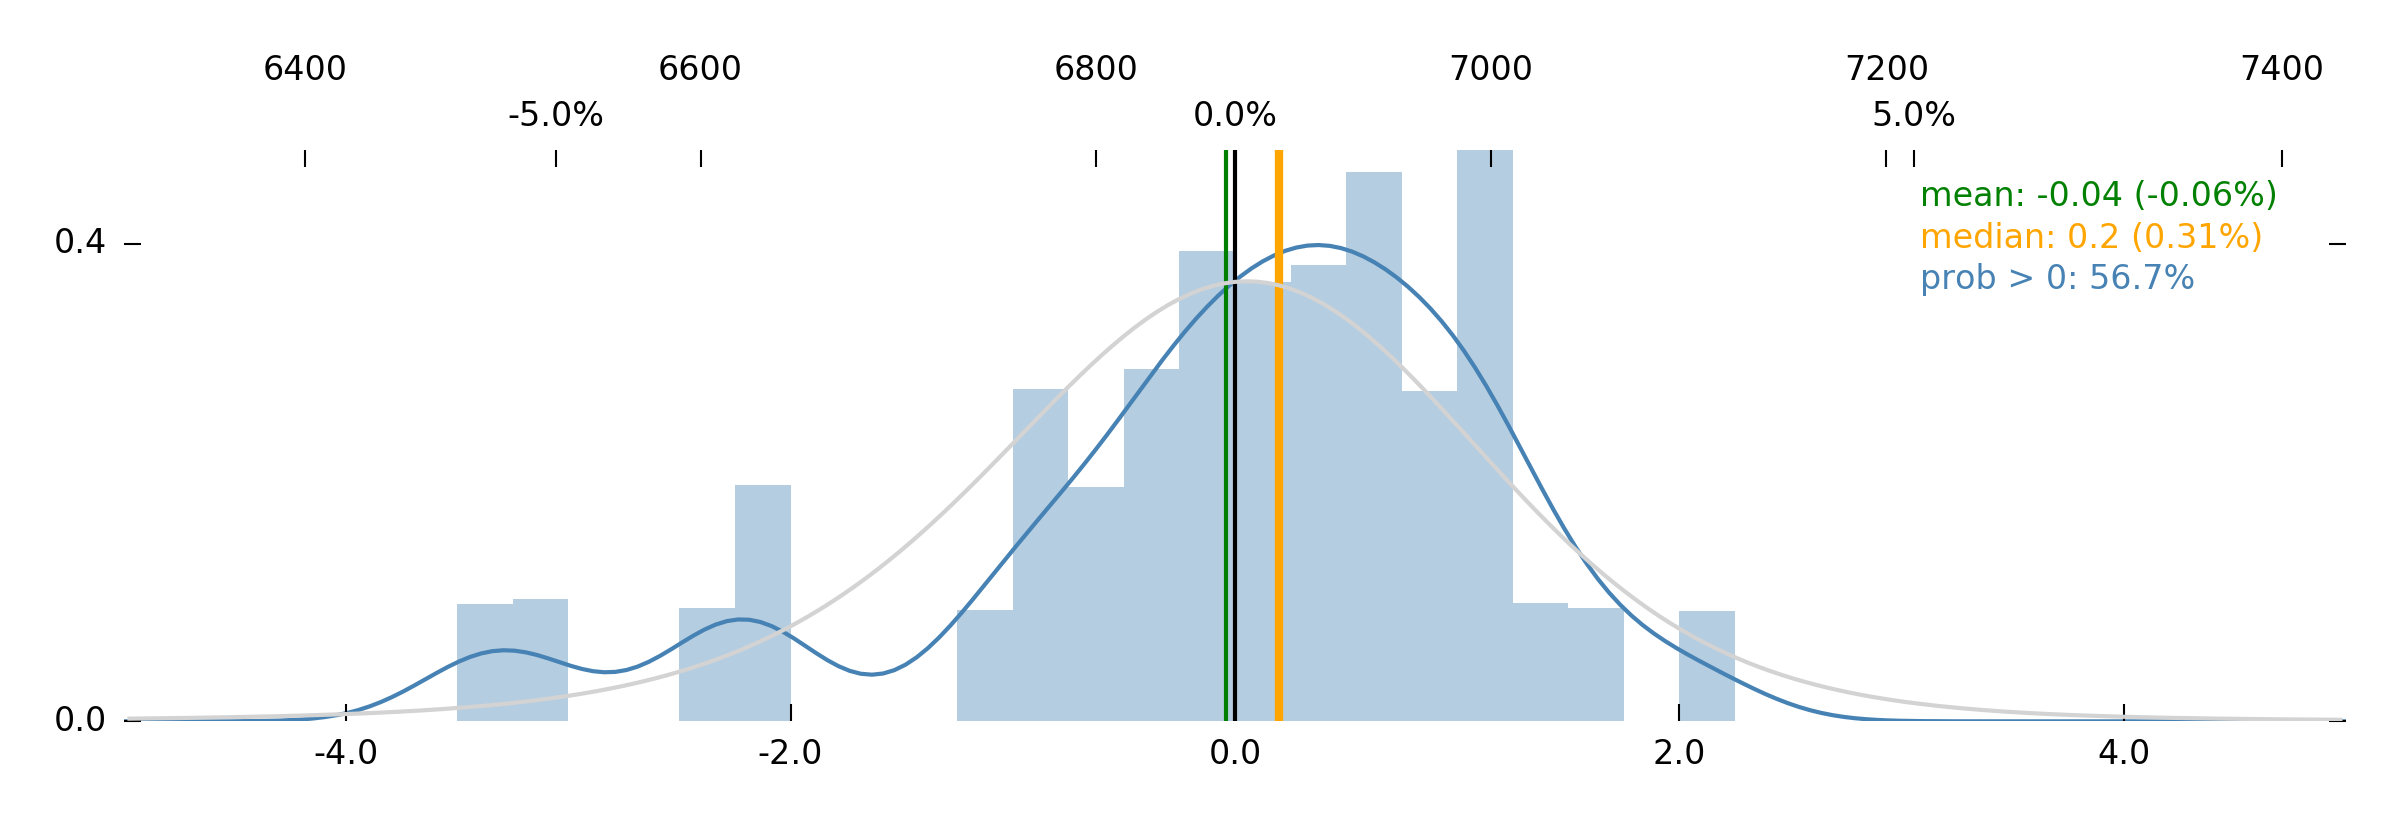
Jim offers a mean 1-week return of –0.06%. Neutral. The tail is there, just like it was a week ago. A 5.00% downside event is evidently underpriced.
The astute reader will, of course, still squint at this plot and assert that the probability of the –5.00% tail occurring is still no more than, well, 5% or so. Granted. And while we think it's actually higher than that, we nevertheless must clarify that we know we're taking a gamble here. We just think it's a very good gamble.
(We own 6700-strike puts, expiring in three weeks.)
We still believe that the most recent rally (two weeks ago) was "animated by stupidity," and that the whole premise of the artificial intelligence CAPEX-based rally is not only questionable, but now much more broadly disputed (by the middle of the bell curve). This is fertile ground for disappointing price-action.
Anecdotally, realized volatility has risen into index highs, price-action has gotten choppier and gappier, RISC and VIBE are now positive, and price is flat over the past month with implied vol flat to down. Conventionally, we often see a small uptick in implied volatility in these situations kick off some more determined downside.
The one indicator that "disagrees" with us is DIX, having printed several strong numbers early last week. We maintain, however, that these are indicative of frenzied retail dip-buying behavior (which has been working well lately)—and that, unlike before, these retail traders are quite likely to be swimming naked as the tide goes out.
Tuesday features job openings data. Wednesday has the FOMC rate decision and presser. Thursday features PPI. People are paying attention to these, and many algorithms are tuned for gobbling up the E-mini book as data is released, so expect some fits and starts; wiggles and dancing.
Wiggles and dancing down below 6700, hopefully.
Quixotic
From 1990 to 2004, you could buy the S&P 500 when volatility was high and you'd get lovely returns. After 2004, this stopped working. After 2004, the same money was made by selling VIX futures instead, because 2004 was when VIX and VIX futures were introduced, thereby abstracting the volatility risk premium into a purpose-built product.
Goodhart's Law: "When a measure becomes a target, it ceases to be a good measure." When volatility became a "target"—became directly tradable—it ceased to be a good measure, and ceased to carry a signal for the underlier.
The market is always in an iterative process of pushing edges and risk premia into increasingly abstracted forms. If we want to capture those edges and risk premia—if we want to lick the savory dressing off the sides of the risk-sandwich while it's being smooshed together—we need to recognize the pattern.
And the pattern is that it's fear that's being abstracted and transformed. It's always fear that we're trying to identify, isolate, and trade against. And then, at the same time, we want to identify dealer disintermediation—that moment when non-dealers start warehousing (however temporarily) unhedged risk.
Fear is usually a fear of large losses, but it can also be a fear of a choppy PnL (driving fund redemptions), or of underperformance, or of "missing out." A classic, old-school example is investors paying a relatively high price for index crash puts (bullish!).
Dealer disintermediation is when the instrument of hedging fear is being handled by someone who's internalizing that risk to themselves instead of hedging it in the market. A classic, old-school example is investors deciding to undercut the dealer and sell index crash puts to other investors for less than they're worth (bearish!).
With all this in mind... where do we look for fear and dealer disintermediation in the S&P 500? Some initial thoughts:
- 0DTEs: Gamma to the max. Pure top-of-book liquidity. Dealers absorb tons of risk here, but some hedging still needs to happen. We already know it works intraday. Is there more information in here?
- VVIX: Vol-of-vol. VIX option prices are, or seem like they ought to be, the "buck stops here" of market liquidity expectations.
- RISC: The spread between realized vol and implied vol. Classic. Still important.
- VIBE: "Realized skew." Is implied volatility moving as much as it seems it ought to, given moves in realized volatility? Should offer a view into positioning.
What about something like "correlation entropy?" Like, imagine you track the correlations of all the—or many of the—component stocks of the index. Dealers rely on those correlations to determine hedge ratios and ability to quote. When those correlations get wonky, that seems like a "disintermediation" moment.
What about signals from a basket of non-equity assets? What if we smoosh gold and high-yield bonds and Bitcoin and maybe a rotating cast of momentum-characters into a basket? When that basket goes down, is that "fear?" (Probably not, but there might be something here anyway.)
We'll start poking at one or more of these next weekend.
And we'll get that Yacht Club page up, too. We will find a way.
Enjoy watching the S&P go down!
The SqueezeMetrics Team