Hey everyone,
You may have noticed, by now, that the website has changed—and with it, the way all of the data is presented. These changes were only planned and executed in the last few weeks—but they were a long time coming. The last two years of these Sunday notes have had a common theme: "We need more dimensions."
First, in 2020, that was vanna exposure (VEX). We needed VEX in order to understand "crash risk" in the S&P 500, and we needed to view it in terms of GEX, VIX, and SPX. This multidimensional need led to our first multidimensional visualization—the "GEX+ heatmap."
Then it was the GIV heatmap. Then the "vol triangle" 3D heatmaps. Then the NPD/VGR heatmap. Then it was the PIVT plots. Then, finally, it was Jim and his robot-vision. And although we didn't realize it at the time, the real need wasn't necessarily for better data—but rather for a better way of expressing it.
Indeed, very little of the data has actually changed. The new "price," "volatility," "gamma," and "dark" were always part of the platform (as price, GEX, DPI/DIX, IV). It's the same underlying data. Now, they're just normalized, so as to more accurately express their edge. The only change is methodological.
Of course, it will take some getting used to. We've been so busy on testing everything that we've hardly had the time to get a feel for it ourselves. If we may be so bold, the "weather maps" are a revolutionary way to look at market time-series data—so it'll take time to get accustomed to that.
But we have time. We have all of 2022. And since we like to talk about our ambitions for the year on the first Sunday of January—let's do that. But first...
- Last
- First
- Next
Last
The last week of the year was a very interesting one. Indeed, the month of December has been interesting altogether. On 12/12, we made the point that net put delta (NPD) was adding substantial fragility to the market—but that we had every reason to believe that DIX would save the day.
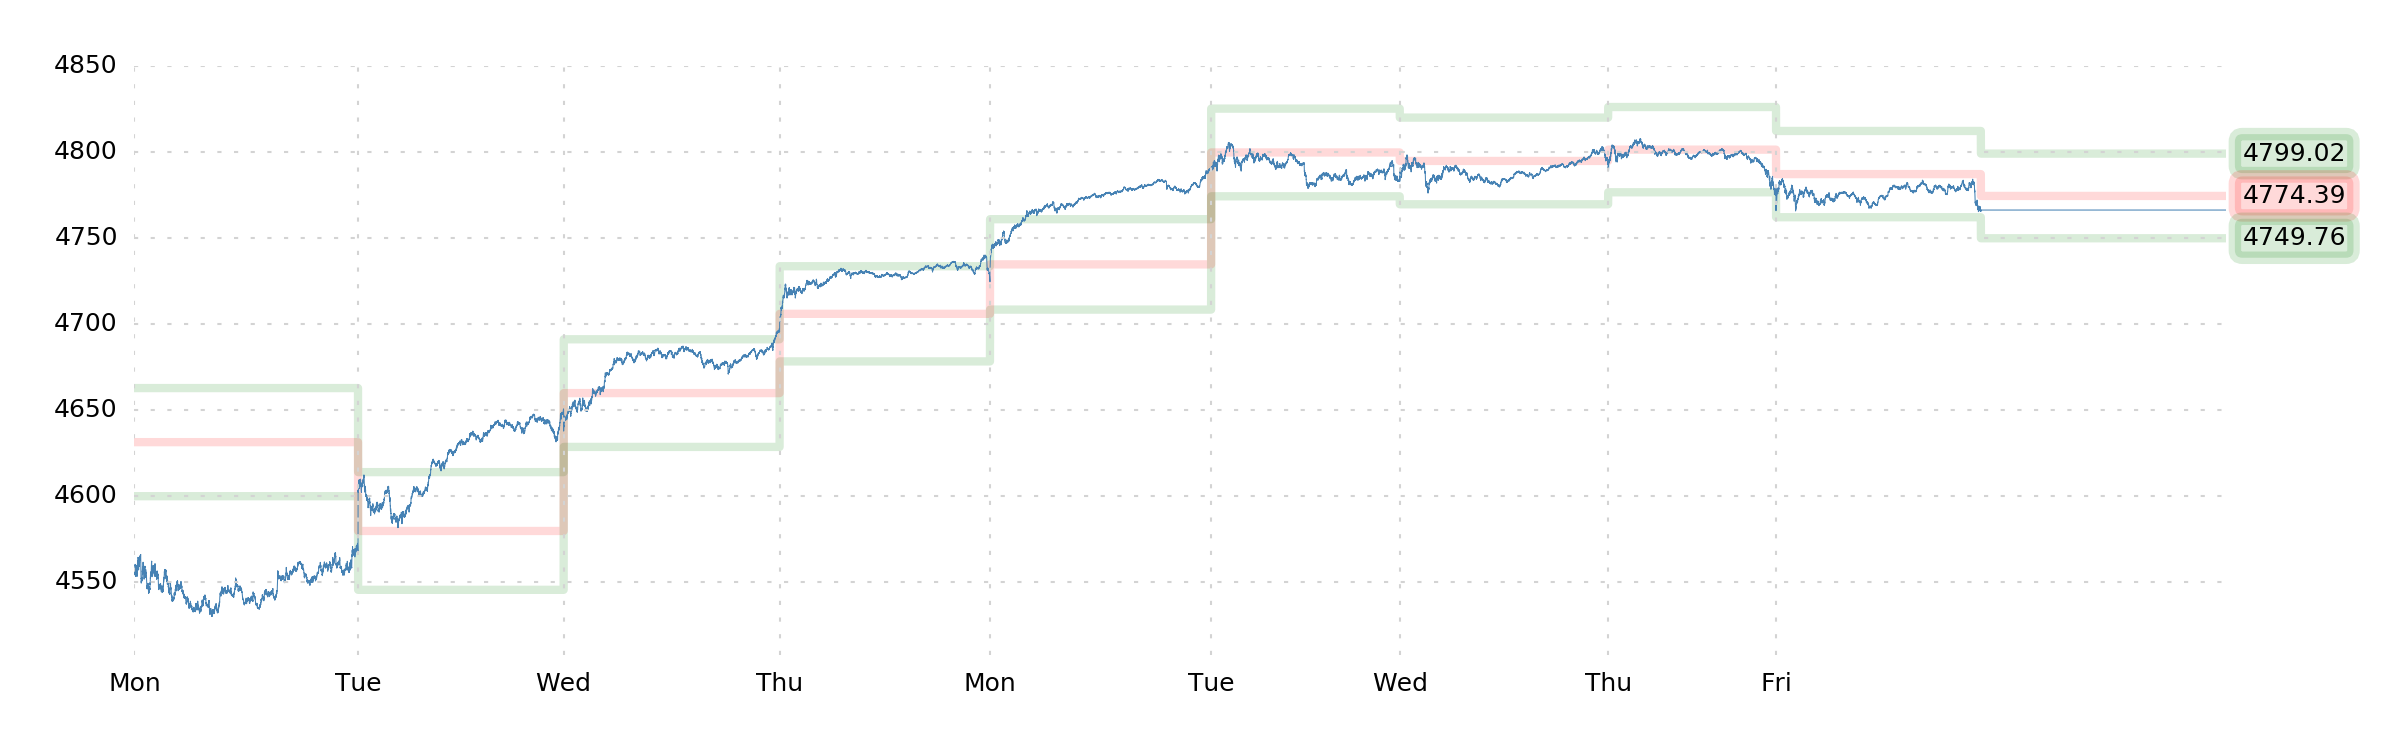
And it did! We were long via ES or SPX call spreads ever since then, and it's gone wonderfully—but quite a lot of risk lurks under the surface owing to the fragile customer positioning. And so, late last week (as DIX fell), we started noticing Robot Jim telling us that some real tail risk had appeared (-10% one-week returns).
Still, the mean expected return was positive, and the median was significantly positive. So we held on to some call spreads (~ATM).
Those call spreads didn't have a stellar week, but no matter. We were in the right trade for the circumstances.
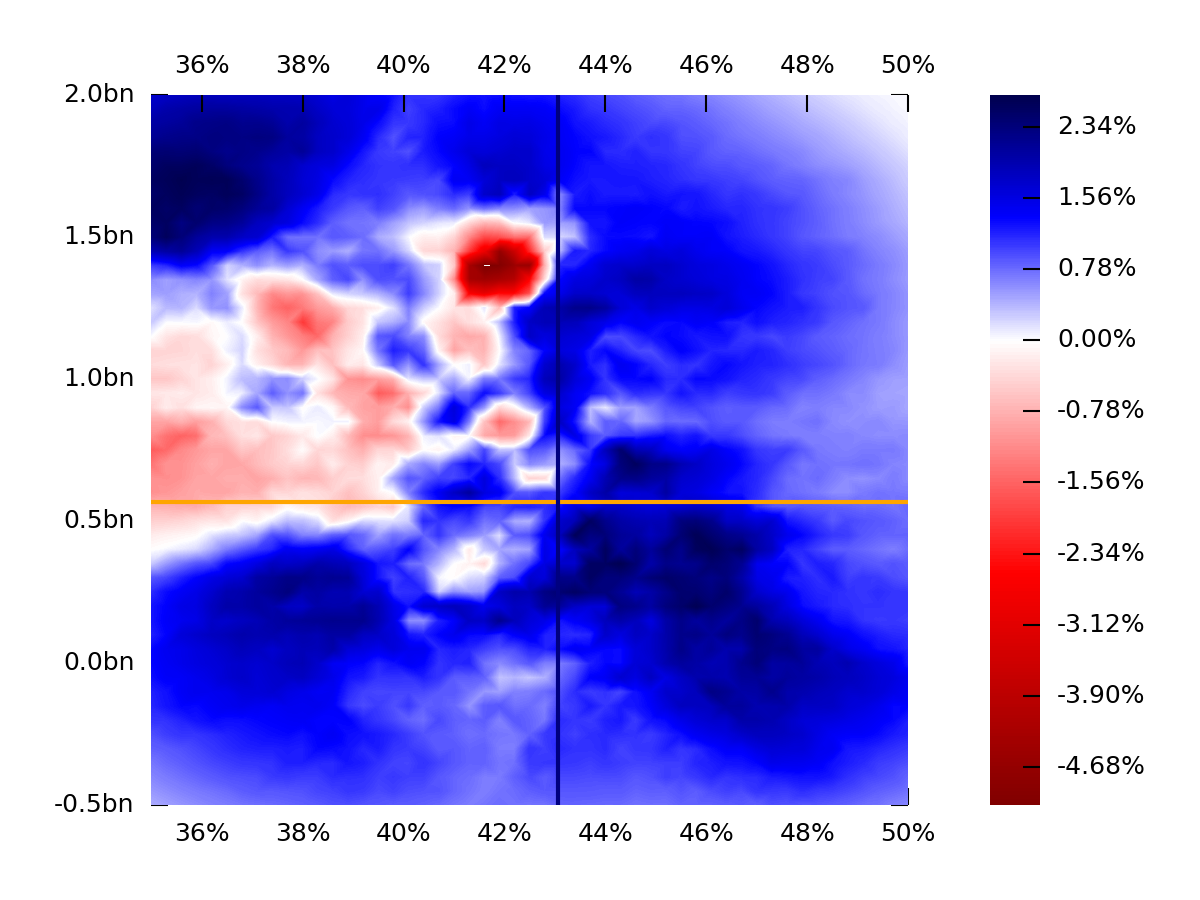
Finally, DIX, the data we were watching most closely, had a Friday print of 44.1%. Not bearish—but not 46%, either.
First
In the first week of the new year, we're... much in the same predicament as we've been for most of December.
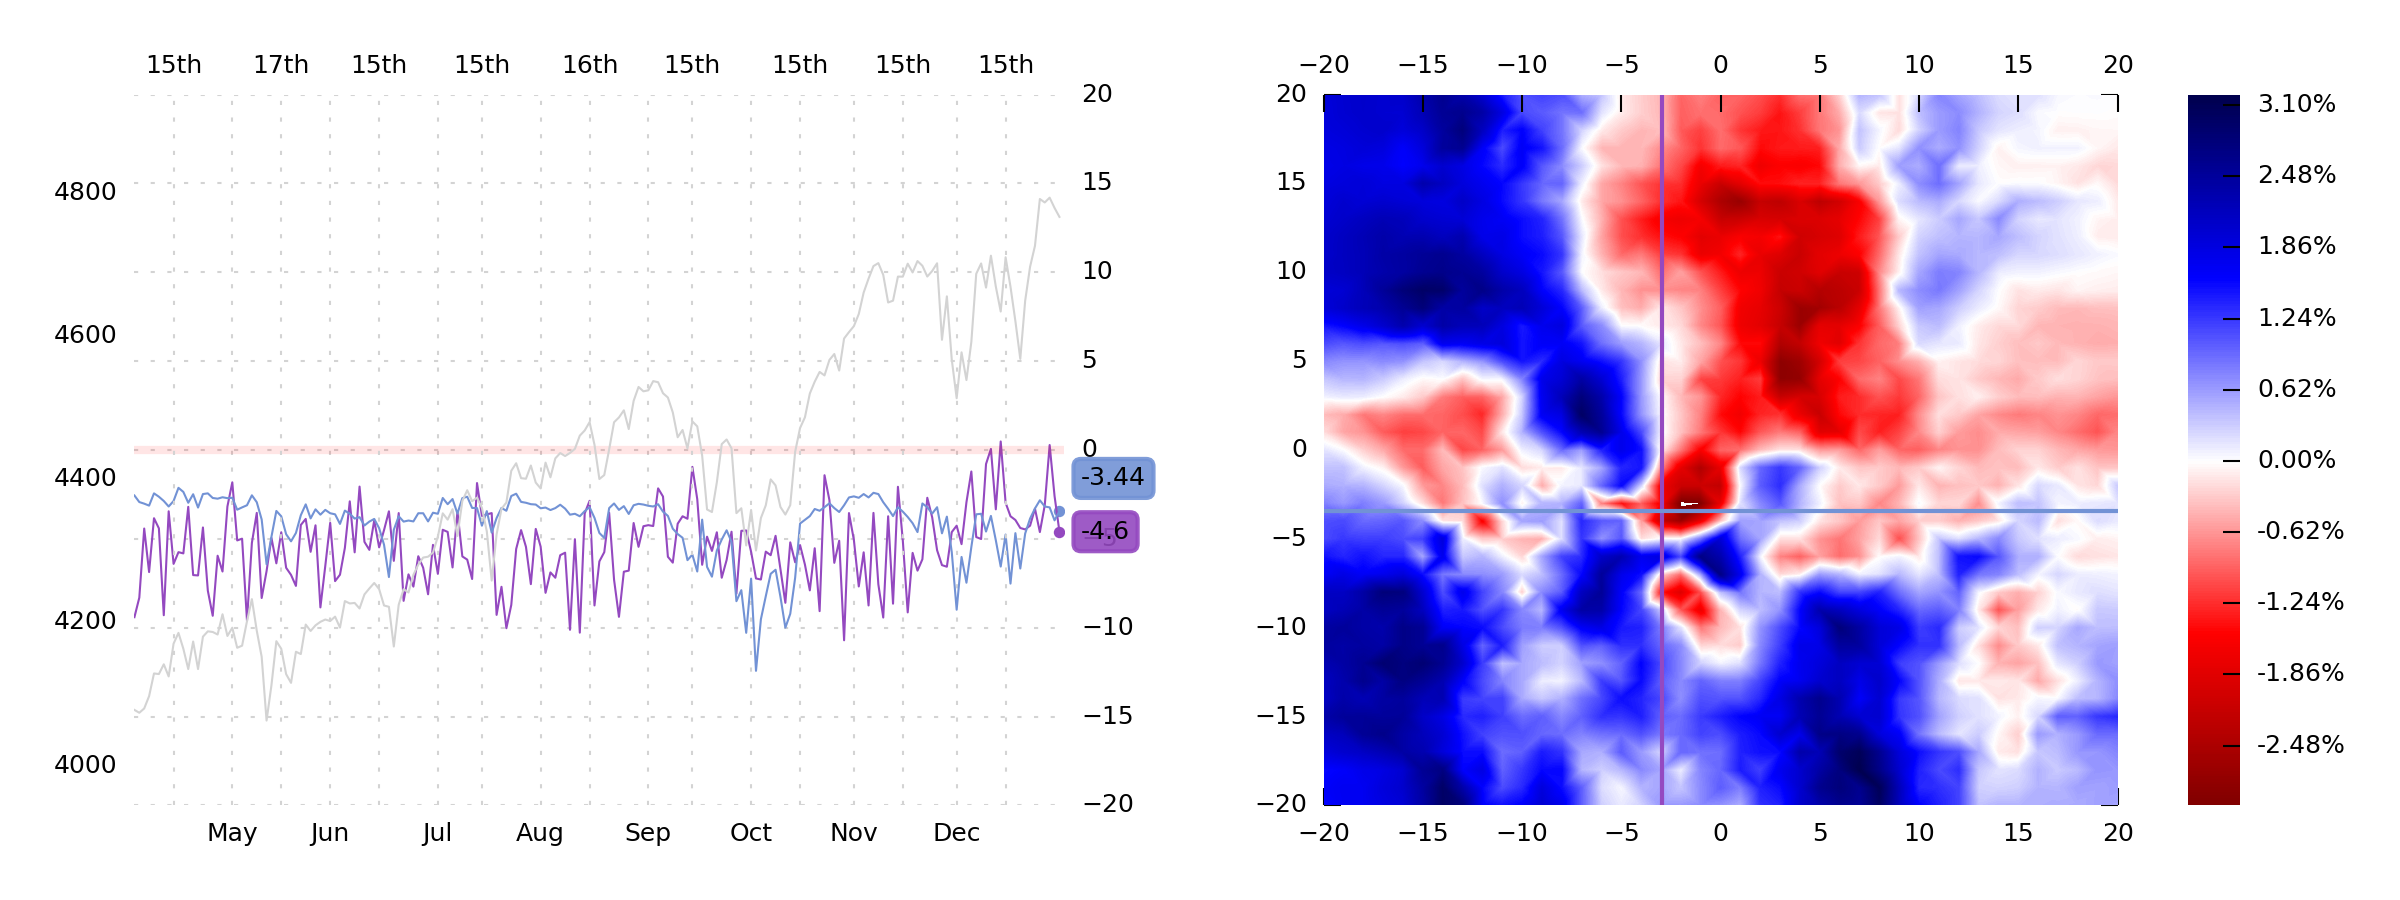
NPD and VGR are still in the danger zone, suggesting that customers are overexposed to changes in IV, and dramatically under-hedged. Again, the only thing that stops this train from derailing is the strong natural demand for shares (and the willingness of dealers to facilitate) shown by DIX.
If DIX starts really falling, risk turns on very quickly.
There's one other interesting thing going on—now that the end-of-year SPX expirations are over and done with. There's now only $570mm of GEX+, which is pretty low, considering that we're at all-time-highs, and we were, previously, spending a lot of time arond $1bn.
This relatively low GEX means that near-term IVs may be too cheap. At the very least, they're relatively cheap, compared to recent history. This, reflexively, makes it more likely that we see bigger, choppier moves, since the market isn't adequately "insured" against movement.
But... with Robot Jim as our guide (and heck, the 1-week Probability densities on the Probability Page, derived from GEX+ alone, will tell you the same thing), upside jumps are still more likely than downside jumps.
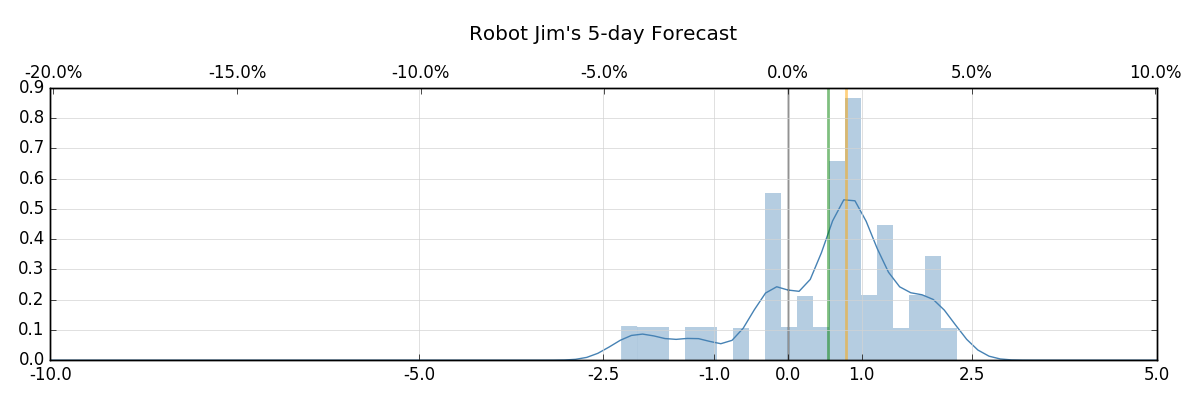
That's a mean expected weekly return of around 1.12%, and a median even higher.
We're holding call spreads and twiddling our thumbs.
Next
Our first and biggest ambition for 2022 is to come to terms with the new data. We're using at least two orders of magnitude more CPU power to generate this stuff on a daily basis, and we'd like to either distribute that load across more CPUs to speed things up, or improve our algorithms.
This is no small task—we've already sped up the work from over 24 hours to more like 2 hours. That's to generate data for around 5,000 tickers. It's not bad, but it means some data still won't come in until 7:00pm or so. We want to work on this, and improve on these internal processes.
That's boring. But honestly, "boring" sounds pretty nice right now.
Aside from that, we only have two "big" ambitions for 2022: (1) To generate some extra-special multidimensional Robot Jim data for the S&P 500 datasets (GEX+, NPD, VGR...), and (2) to finally, at long last, get some extensive data on, and acquire a better understanding of, VXX.
VXX is a magical creature (especially its options), but we tend not to use it to trade (we tend to use SPX options and VIX futures), since we just don't feel like we "get" it. But the more we think about VXX (and especially its options), the more we think that it's just about one of the coolest financial instruments ever created—but nobody seems to agree with that. So maybe we're crazy.
And on that note—Happy New Year!
Questions? Let us know.
Enjoy the week!
The SqueezeMetrics Team